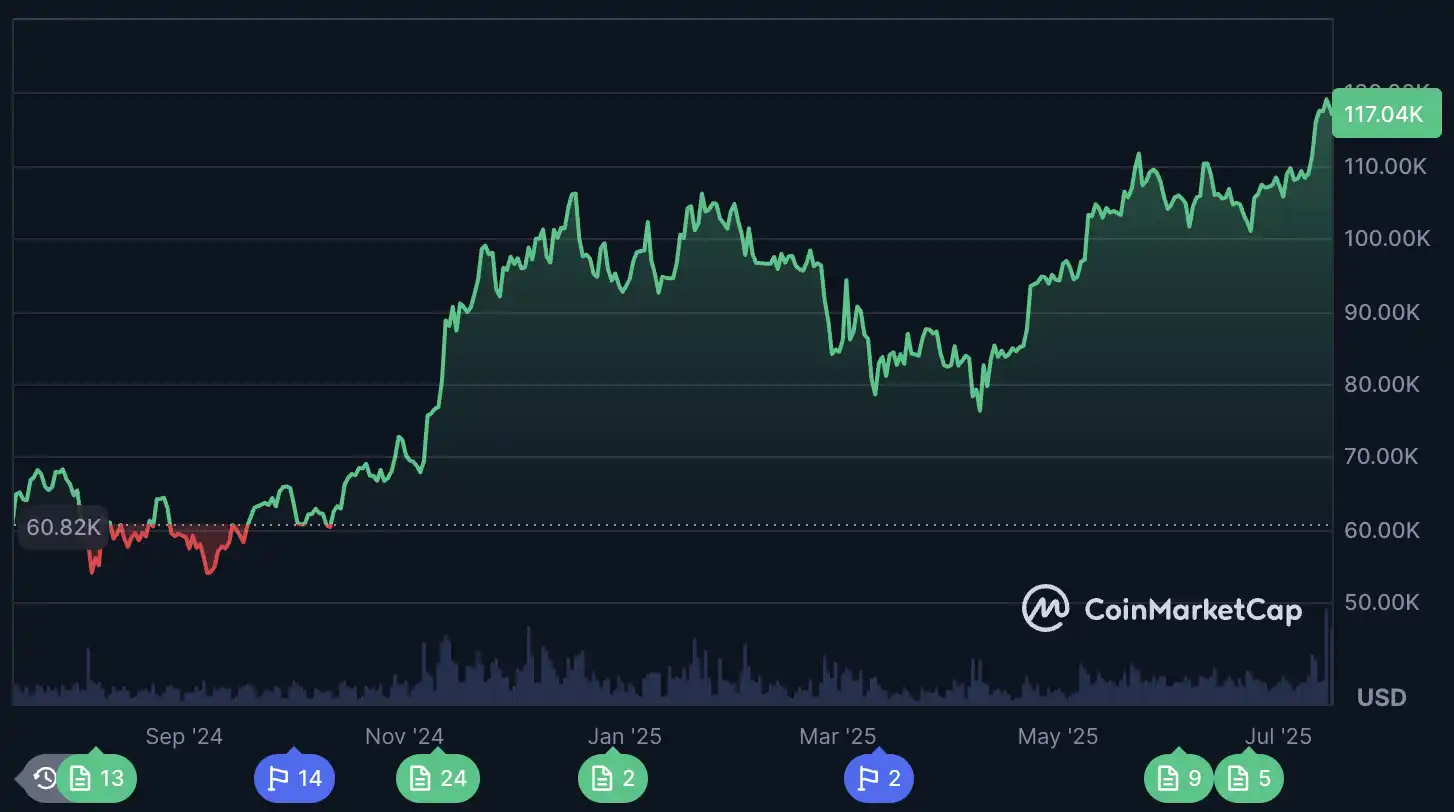
Exactly one year ago, Trump was shot in the right ear during a campaign rally, leaving behind a historic photo of his clenched fist. After that, he was elected president and officially launched the U.S. Crypto Capital Plan. The price of Bitcoin has also surged from $60,000 a year ago to a new historical high of over $120,000.
This year has not only changed the price of Bitcoin; the market structure of cryptocurrencies has also undergone significant transformation. Will this be a raging bull market or a phase of bullishness? What impact will Bitcoin's widespread consensus have on the market? Where will policy direction take cryptocurrencies?
With Bitcoin at $120,000, everything must start anew. This article will share the views of several traders on the future of cryptocurrencies as Bitcoin breaks new highs.
Macroeconomic Policy Direction
Regulatory Boundary: The CLARITY Act
The most notable cryptocurrency-related legislation recently is the upcoming vote on the CLARITY Act this Wednesday, which has generated significant discussion within the community. This act will define the boundaries of cryptocurrency regulation.
Mark Palmer, an analyst at Benchmark Investment Company, stated in a recent report that the CLARITY Act could become a turning point for the digital asset market. Due to uncertainties in legal compliance, many institutions have remained on the sidelines, and this legislation may provide the long-awaited regulatory certainty for traditional financial institutions such as asset management companies, hedge funds, and banks.
Trader "@Trader_S18" believes that as regulatory authority shifts from the SEC to the CFTC, the market may experience a significant adjustment in underlying logic, leading to a differentiation in the cryptocurrency ecosystem: mature assets like Bitcoin and Ethereum may be clearly classified under CFTC regulation, while other cryptocurrencies that do not meet CFTC standards will remain under SEC regulation, creating a coexistence of commodity contracts and investment contracts.
At the same time, trading platforms may need to re-register with the CFTC and complete compliance processes, and the spot market is expected to develop in a more standardized direction similar to commodity futures. If CFTC regulation becomes more lenient and clear, it will be seen as a positive development, and the market may witness a "currency exchange trend," with various projects actively "aligning" to obtain more favorable regulatory affiliations, driving a new round of market rotation.
What Impact Will Potential Rate Cuts Have?
With the Federal Reserve deciding to maintain the federal funds rate in the range of 4.25%-4.5% during the FOMC meeting on June 17-18, and Fed Chairman Jerome Powell indicating that if there are no new tariff policies from the Trump administration that could push inflation higher, the Fed may have already begun to consider rate cuts. There are two prevailing opinions in the market: one is that with continued pressure from the Trump administration, Fed Chairman Jerome Powell may "consider" resigning, which would significantly increase the likelihood of a rate cut occurring at the July 30 FOMC meeting.
However, according to CME FedWatch data, the probability of a rate cut at the July 30 FOMC meeting has dropped from 24% in June to 5%, with the market generally expecting the first rate cut to be delayed until September or December.

Although it is uncertain whether the cut will happen in July or September, the trend towards a rate cut seems quite evident. Trading observer BTCAB5 is optimistic about this, stating that if a rate cut occurs on July 30, BTC could surge to $135,000. Additionally, Standard Chartered even predicts it could reach $250,000 by the end of 2025. The expectation of rate cuts is also favorable for compliant tokens like XRP and SOL, especially in the context of the upcoming vote on the GENIUS Act. Morgan Stanley predicts that by the end of 2026, the Fed may cut rates seven times, bringing the rate down to 2.5%-2.75%, which would provide long-term benefits for risk assets like cryptocurrencies.
CPI Expectations
Notable KOL @unaiyang stated that the U.S. June CPI data, to be released tonight at 20:30, will be a decisive factor for the short-term market, directly affecting the price direction of Bitcoin and Ethereum. The market currently generally expects the core CPI to be 3% and the annual CPI to be 2.7%. She pointed out that "if the data comes in below expectations, it may trigger a decline in U.S. Treasury yields, weaken the dollar, and boost risk assets, with Bitcoin likely returning to the $122,000 range and Ethereum possibly rebounding to $3,200. However, if inflation data continues to show 'stickiness,' it may suppress market sentiment, and BTC could short-term pull back to the $115,000–$116,000 range, with ETH potentially dropping to the $3,000 mark."
The current market is in a tense state, with macro data becoming the only variable of high concern for traders. In the context of high pressure and unclear direction, more investors are choosing to wait and see, looking for macro data to provide clear guidance. The release of tonight's CPI could become the trigger for the next round of market fluctuations.
When Will the Buying Frenzy of Public Companies Fade, and How Will It Affect Cryptocurrencies?
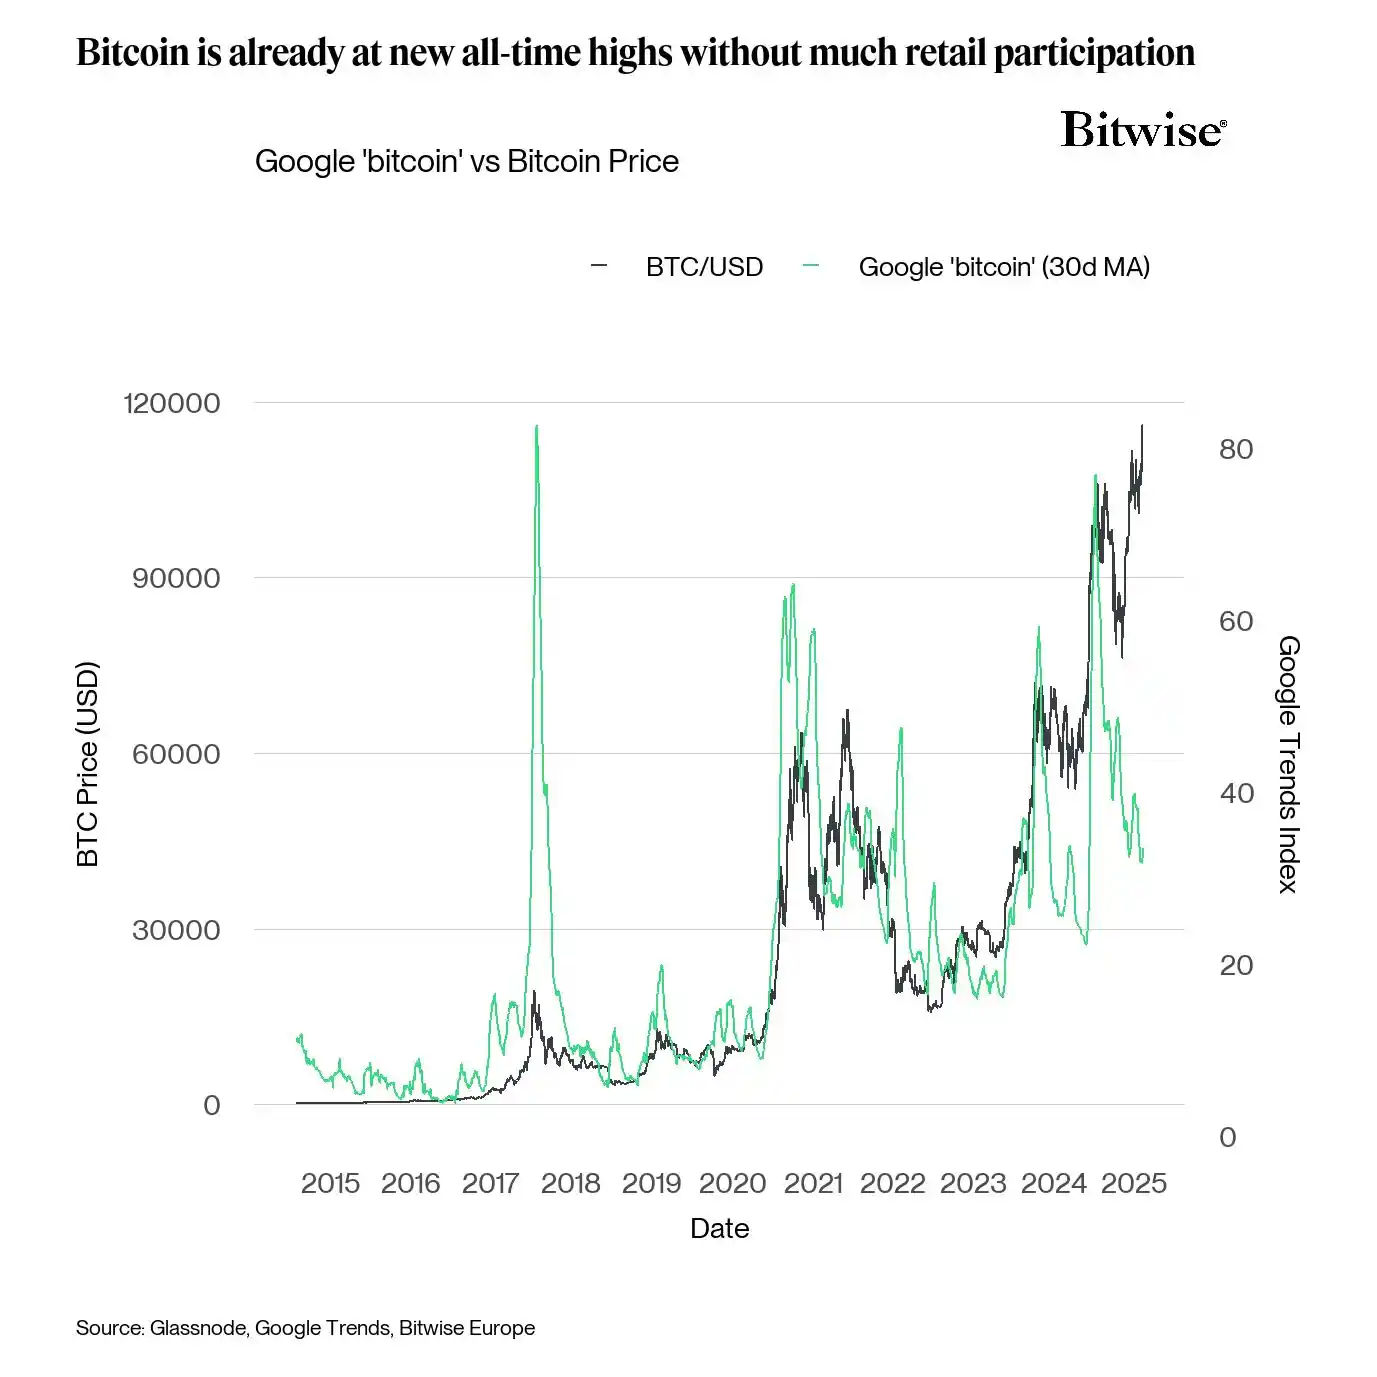
As more and more public companies transform into "crypto treasuries," the influence of ETFs is gradually diminishing, while the impact of public companies and institutions on cryptocurrencies is steadily rising. KOL moneyordebt pointed out that to maintain Bitcoin's power-law rise, a massive influx of new capital is needed, and only institutions can provide such scale. Fortunately, institutional adoption is also accelerating exponentially, especially corporate "BTC treasuries" are taking over from ETFs as the main force driving price increases. Bitwise's chief researcher @Andre_Dragosch also presented data expressing the same view, stating that "retail growth is almost nowhere to be found, and the latest round of increases is primarily driven by institutions."
On-chain analyst @_43A6 also used the mNAV data of public companies as one of the trading indicators based on the theory of well-known trader James Check, along with two auxiliary indicators: Days to Cover and Days to Replace. mNAV (market value to net asset value ratio) has become a key indicator for judging a company's intention to buy or sell Bitcoin: when mNAV is above 1, it means the company's market value exceeds the value of its Bitcoin holdings, creating an incentive to issue more shares and acquire Bitcoin; when mNAV is below 1, it may prompt the company to sell Bitcoin to repurchase shares, thus correcting the deviation in market value. If mNAV compresses rapidly among several leading companies, it could trigger collective profit-taking, leading to a chain reaction.
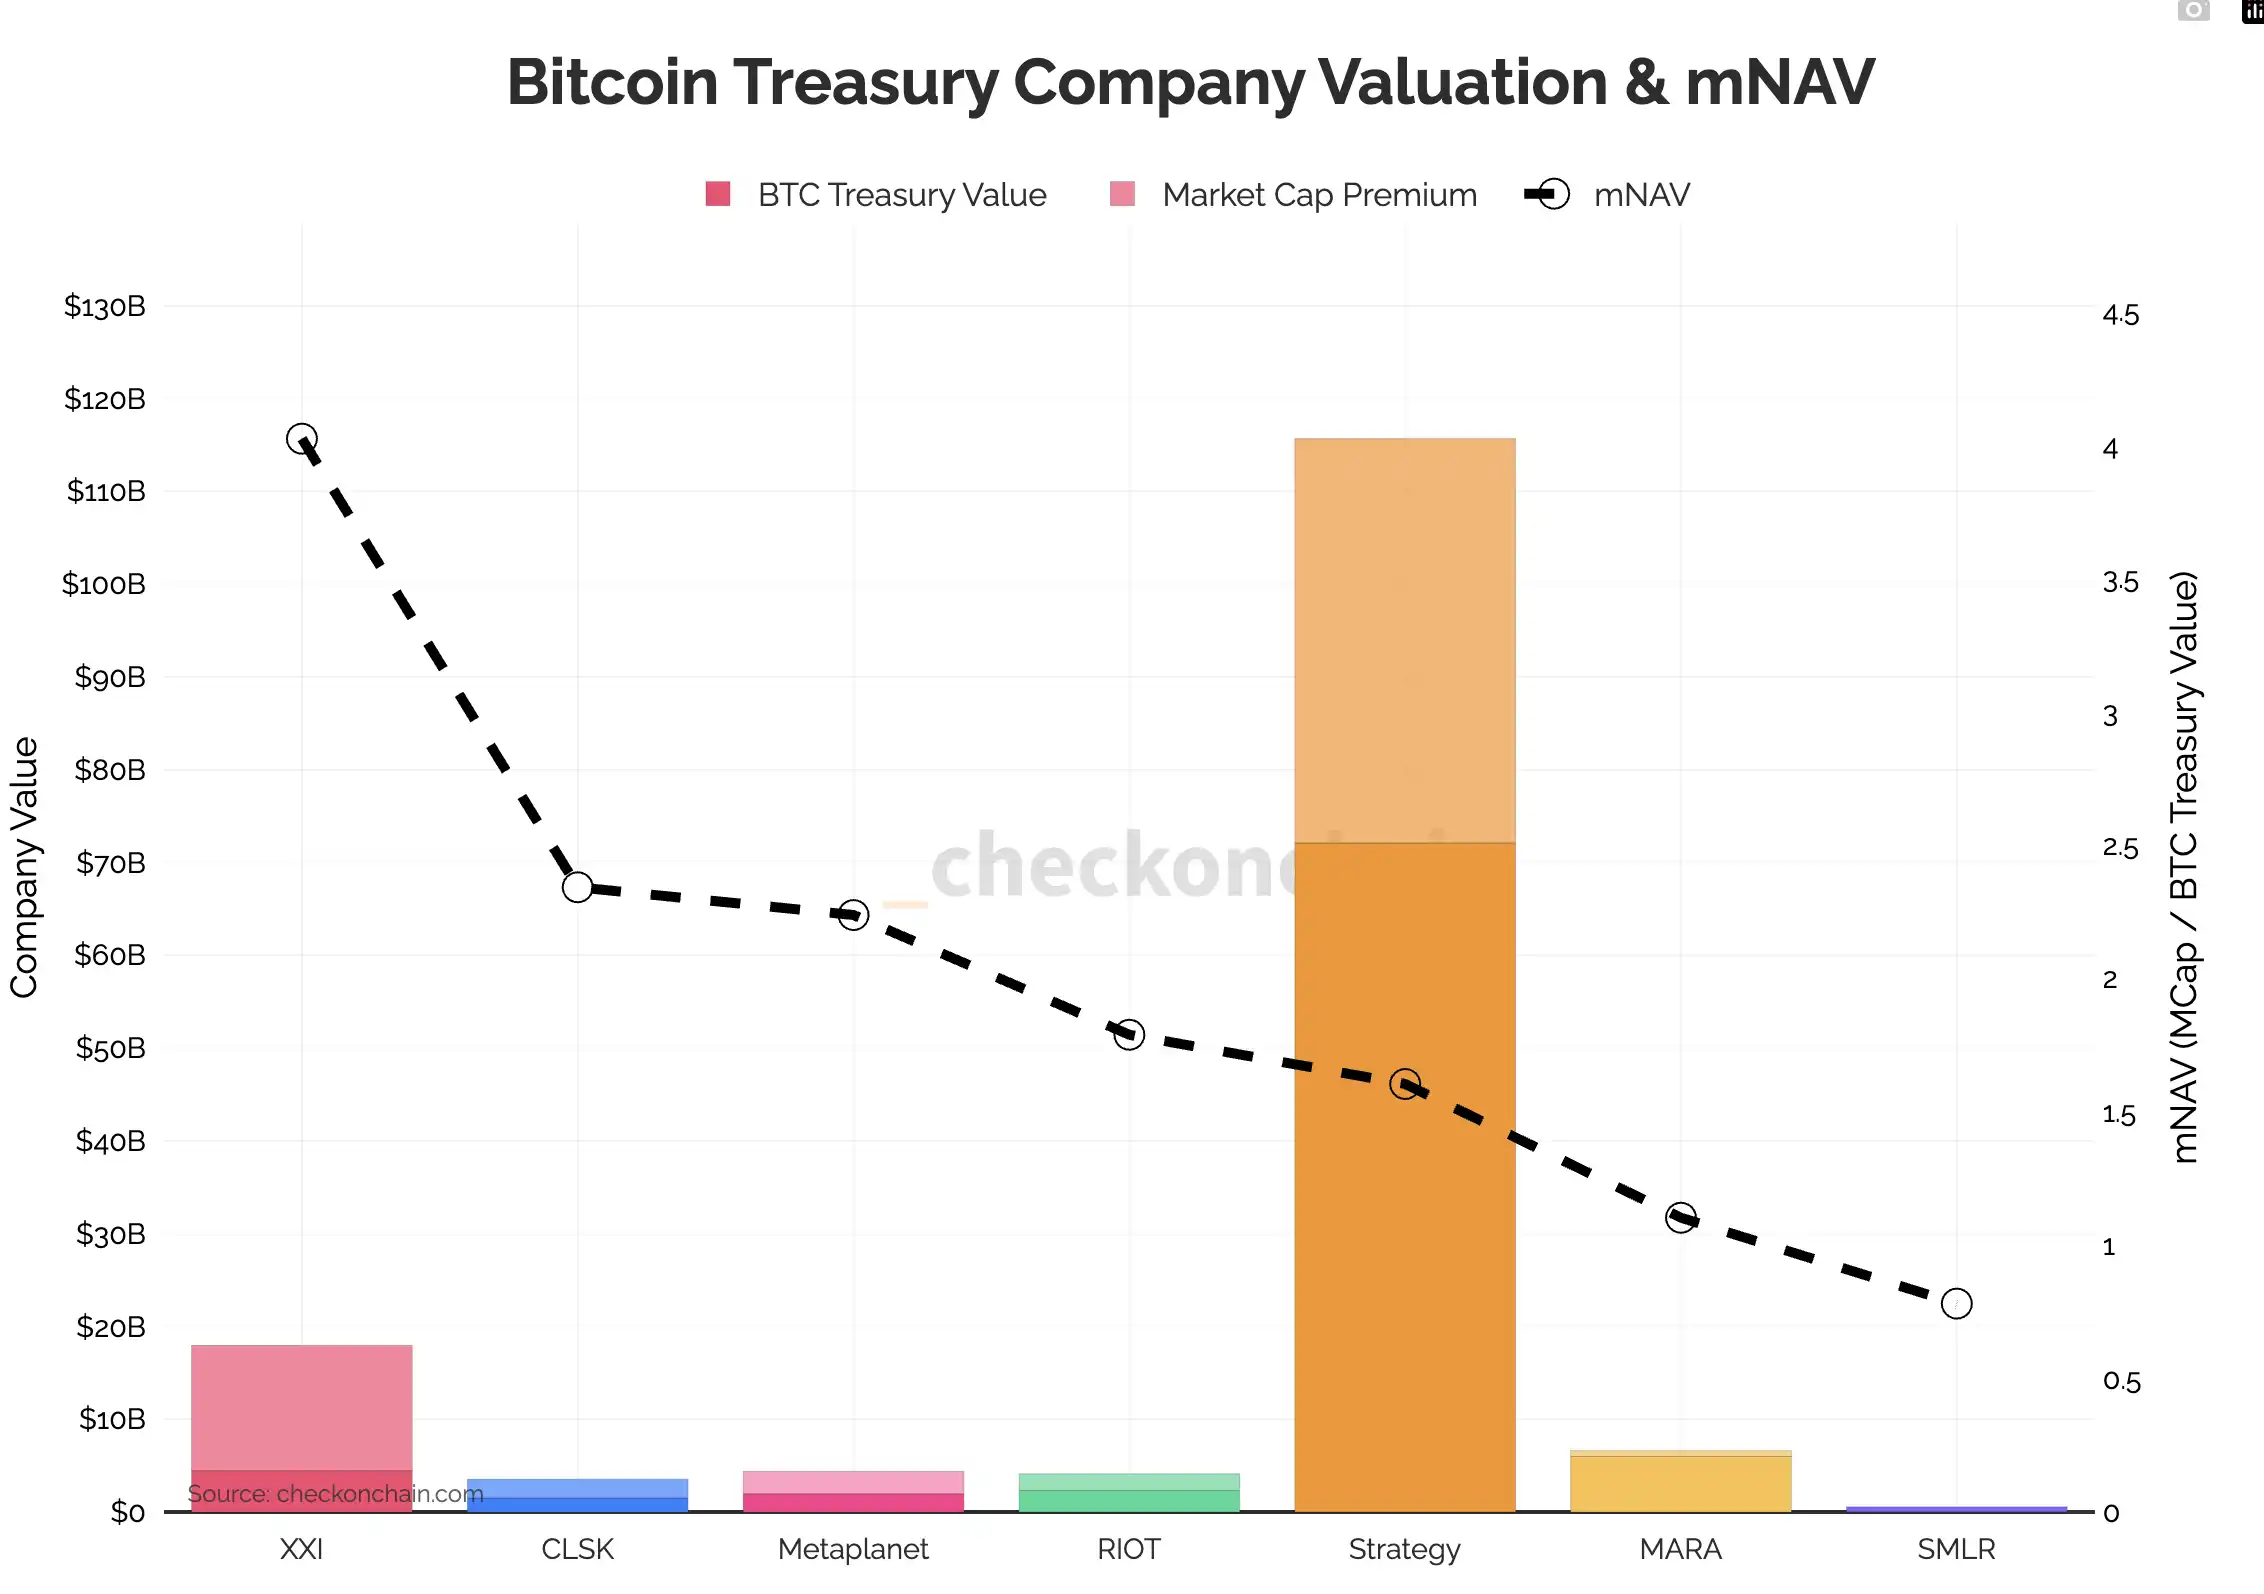
Bitcoin reserve company's mNAV dashboard, source: checkonchain
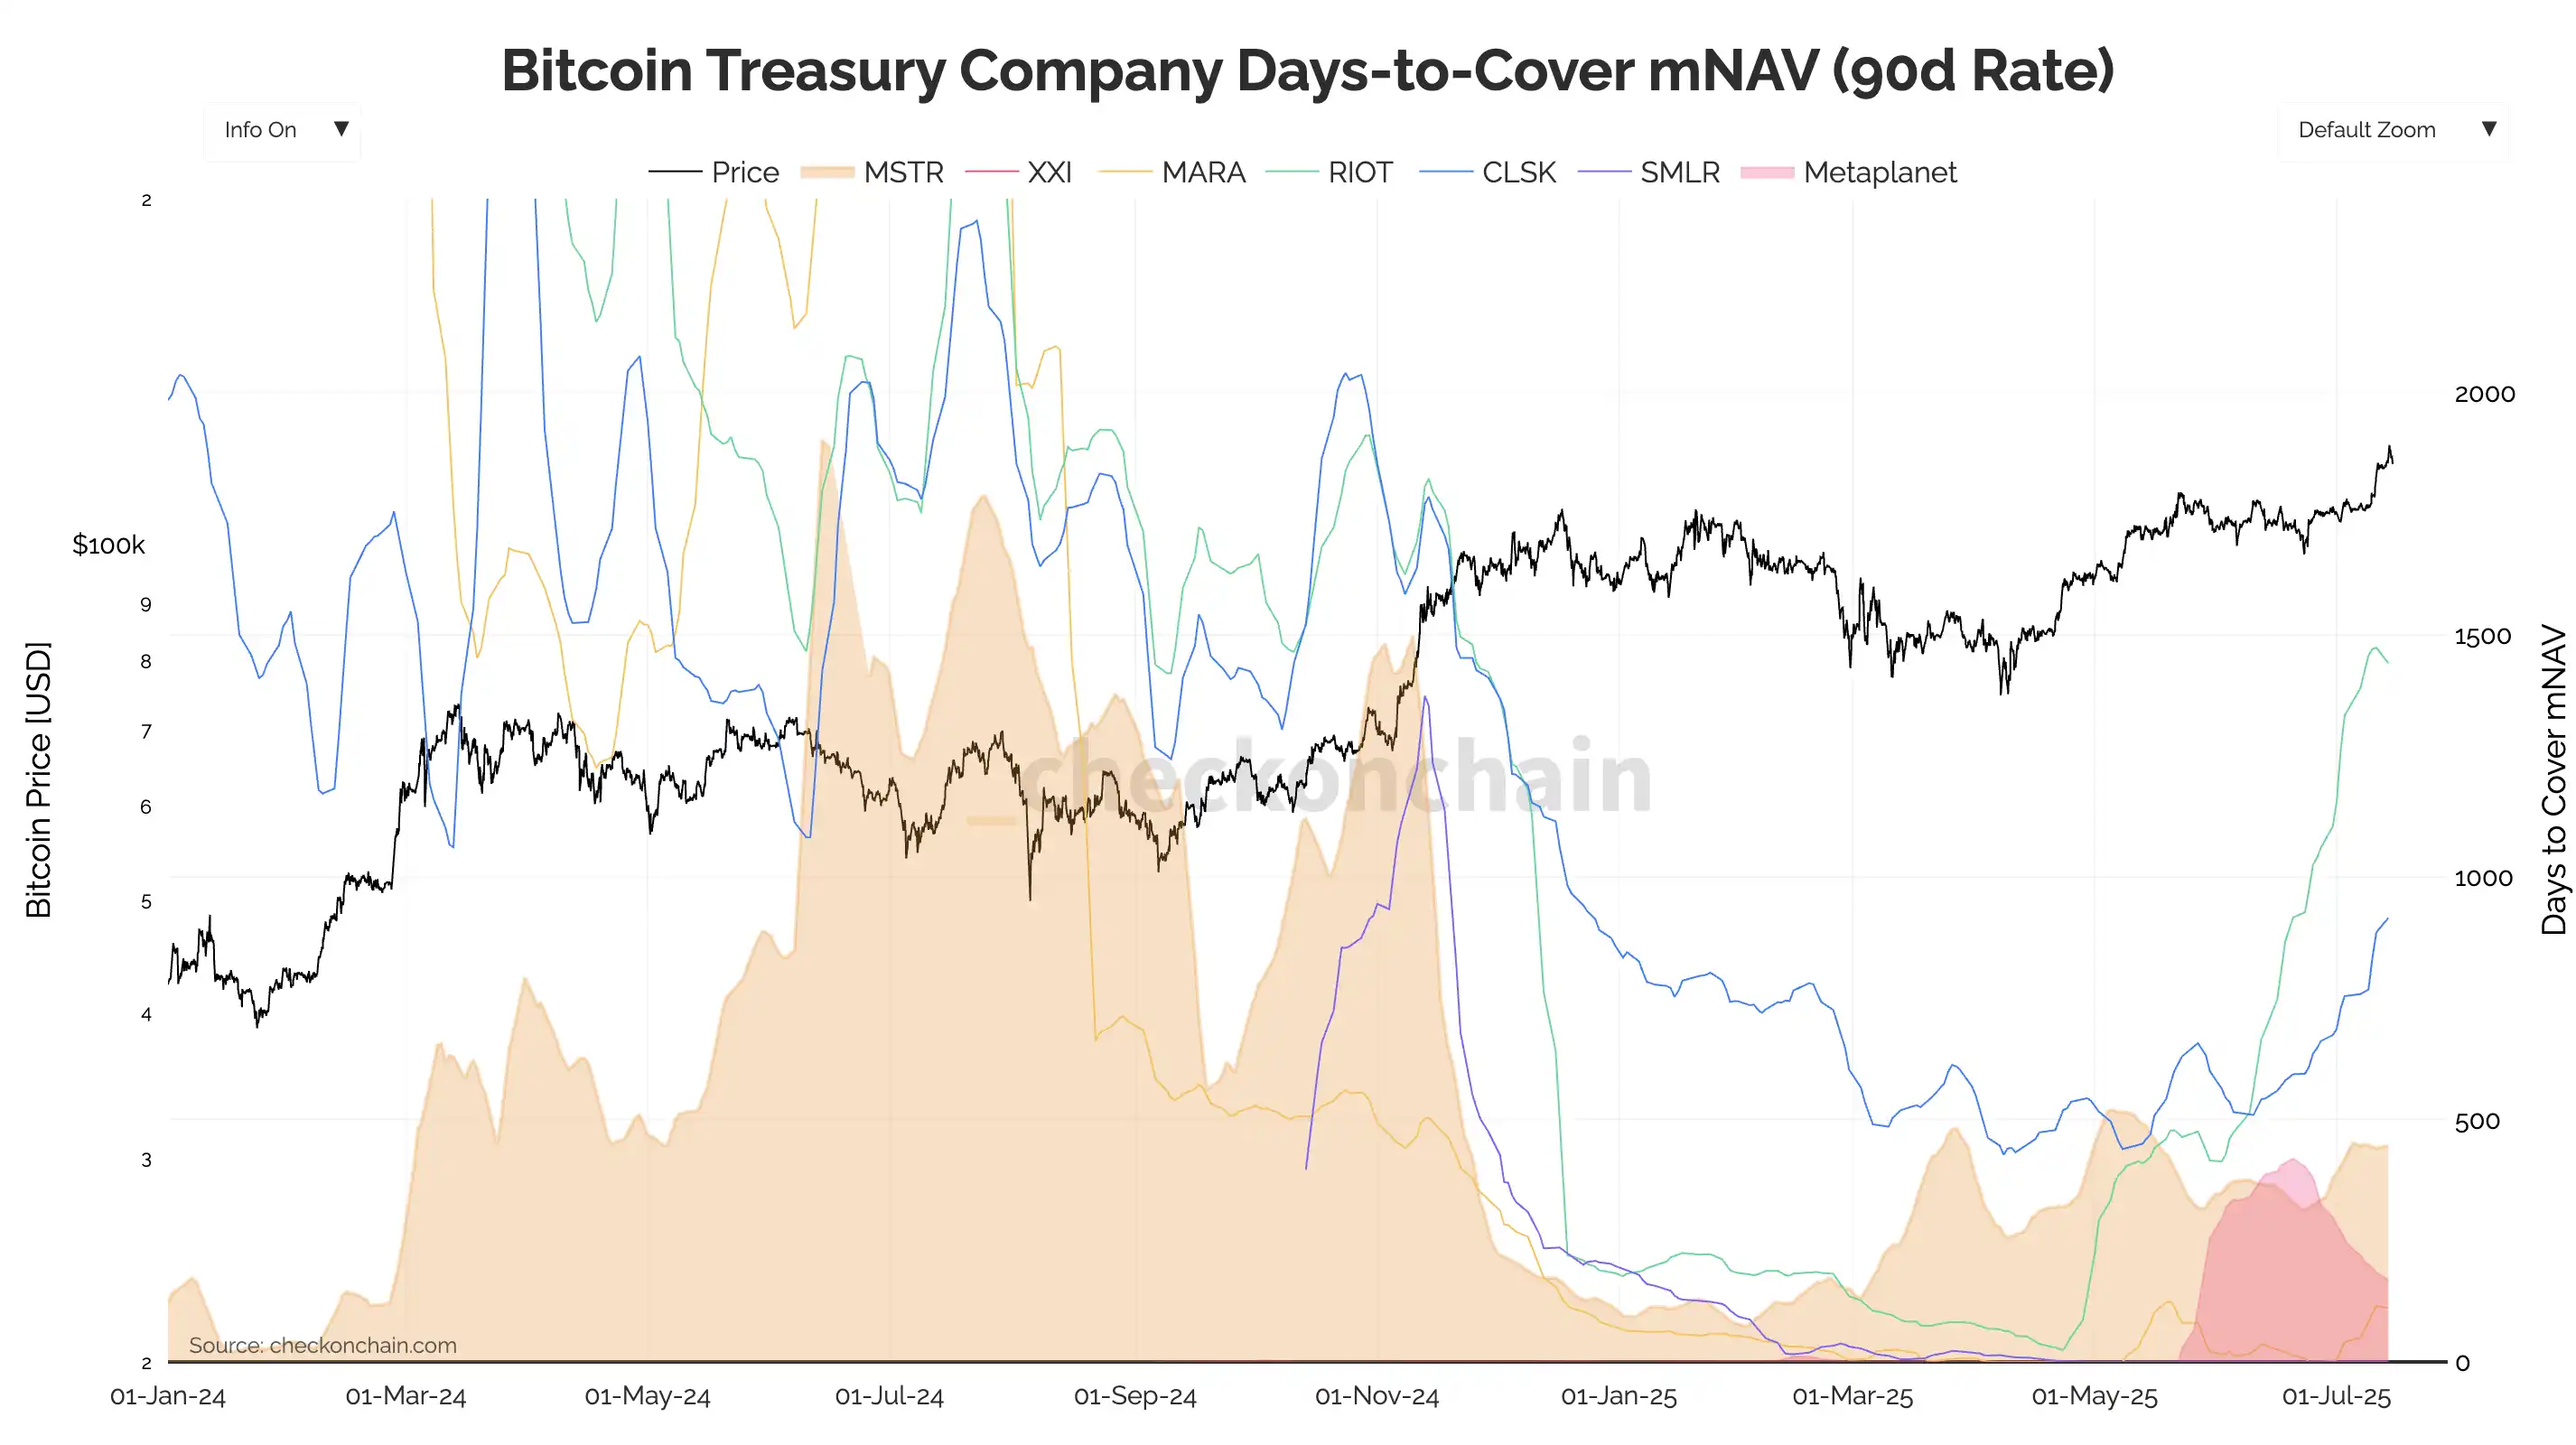
While mNAV is influenced by market prices and has a lagging nature, it already possesses leading signal significance at the behavioral game level and may become an important forward-looking indicator for future Bitcoin market volatility. The newly created indicators Days to Cover and Days to Replace have also been proposed to assist in observing the "buying" trends of public companies, with the former measuring the time required for a company to fill valuation premiums at the current pace, and the latter assessing the pace of doubling current holdings.
Meanwhile, with MicroStrategy (MSTR) holding nearly 80% of the Bitcoin holdings among public companies, its market dynamics are seen as an important barometer for Bitcoin price trends. James Check indicated that observing the recent performance of MSTR's three types of preferred shares—convertible bonds STRK, investment-grade bonds STRF, and high-risk STRD—will serve as a good top warning signal. If the prices of these preferred shares fall below the par value of $100, it indicates that the market is beginning to reassess MSTR's financing sustainability and the potential risks of its Bitcoin exposure. Through changes in bond yields and credit spreads, investors can gain early insights into possible market top signals.
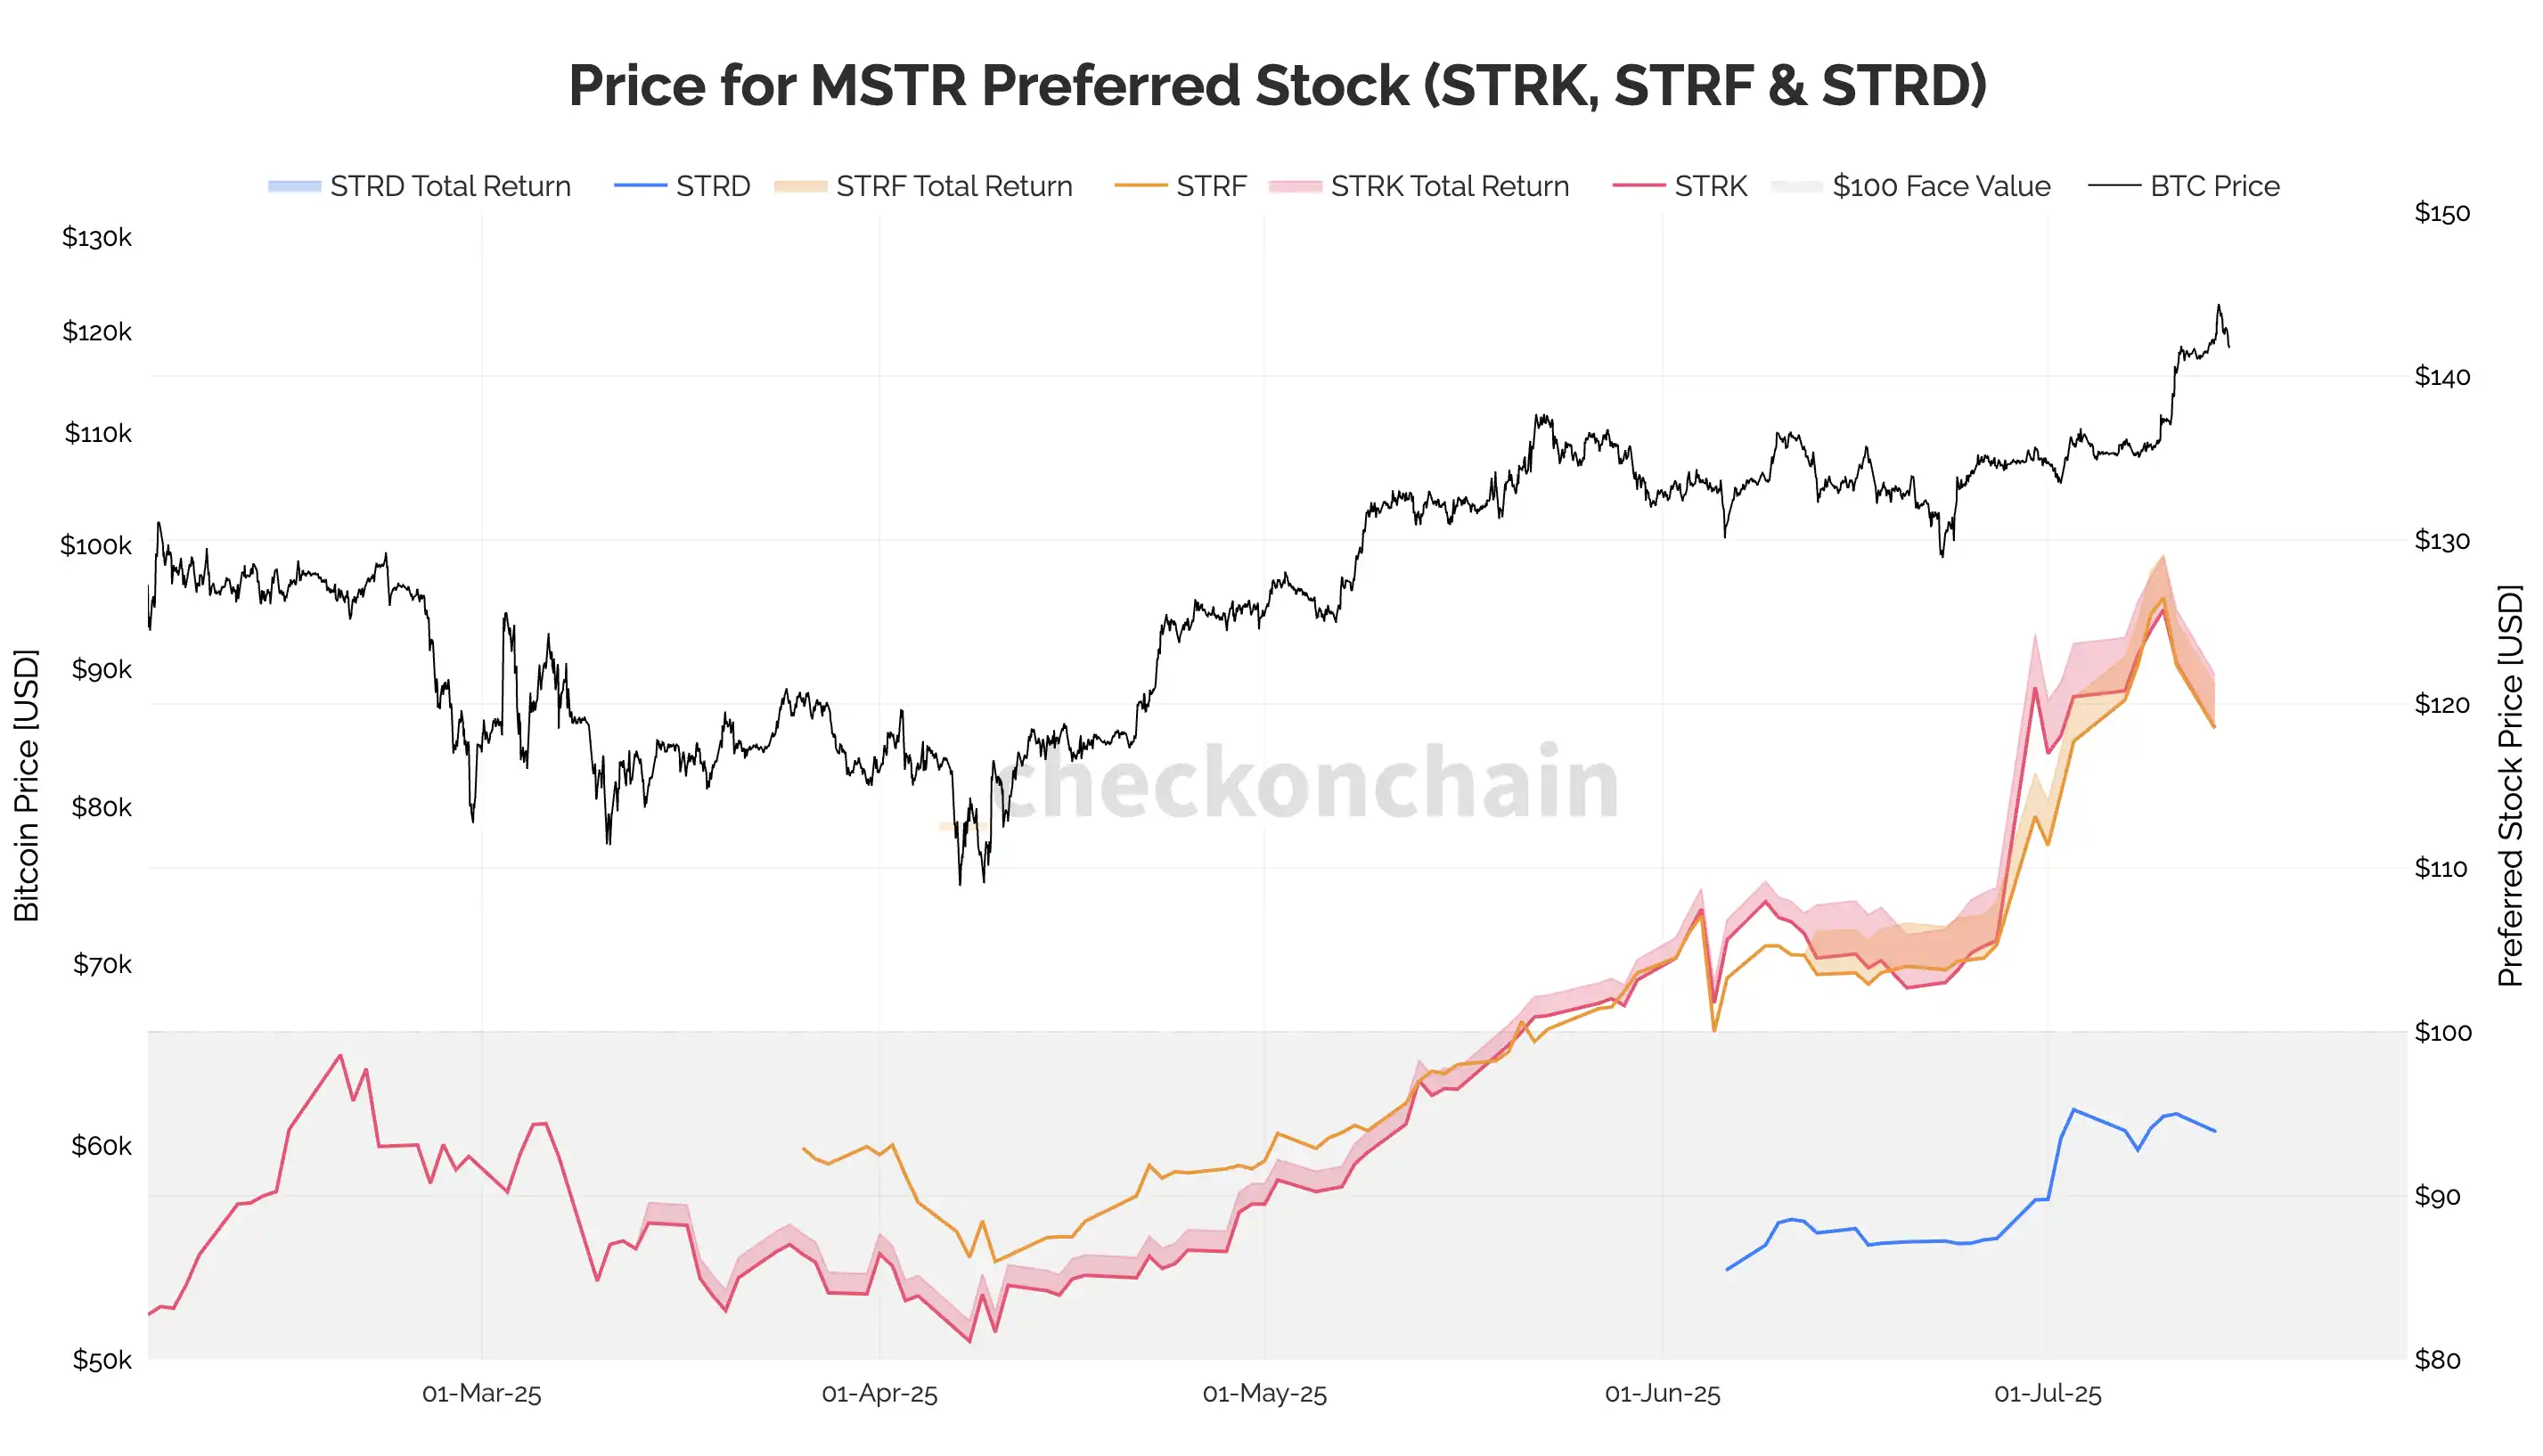
Performance of MSTR's three types of preferred shares, source: Checkonchain
As institutional capital becomes the main driving force behind Bitcoin's rise, companies like MSTR, which are "crypto treasury" types, are quietly forming systemic variables for the new generation of Bitcoin market trends.
Transformation of BTC's Financial Attributes
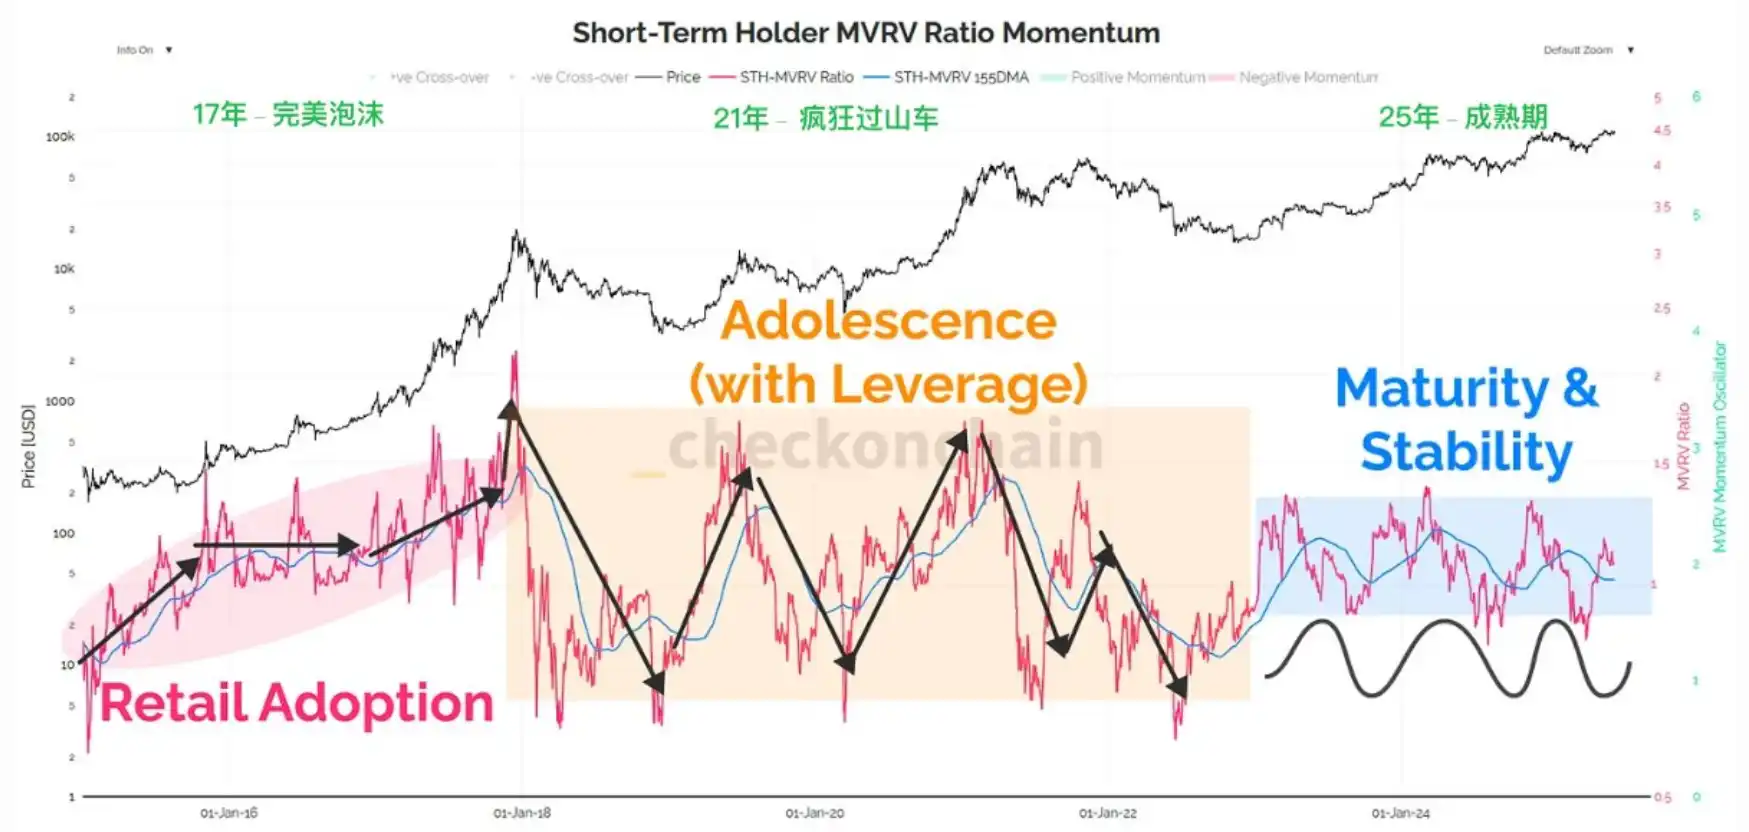
From the MVRV data perspective, the current cycle's Bitcoin price is healthier compared to the previous cycle. The MVRV in 2017 exhibited a perfect "tulip bubble"; by 2021, the entry of institutions like FTX and the use of leverage caused the MVRV to resemble a roller coaster. This year's MARV data curve is smoother and more natural, showing characteristics of "disorder turning into order, erratic spikes and drops gradually shifting to orderly fluctuations, with a healthier and more genuine demand side."
@Trader_S18 stated that after the passage of the CLARITY Act, Bitcoin's Nasdaq attributes may decrease while its commodity attributes may strengthen. This means that in the future, the reference benchmarks for Bitcoin's price movements may shift from U.S. stocks to a greater extent following the trends of crude oil, gold, copper, and soybeans. For example, when Trump threatened to impose a 100% tariff on Russia, WTI fell, and Bitcoin also fluctuated accordingly.
Formation of Broad Consensus and Rising Costs of Bitcoin Holdings as Key Support for Bull Market
On-chain analyst James Check recently released a study indicating that the current Bitcoin market is exhibiting highly healthy structural characteristics, with "rising holding costs" and a very high proportion of "long-term holders (LTH)" becoming core variables supporting the continuation of the bull market.
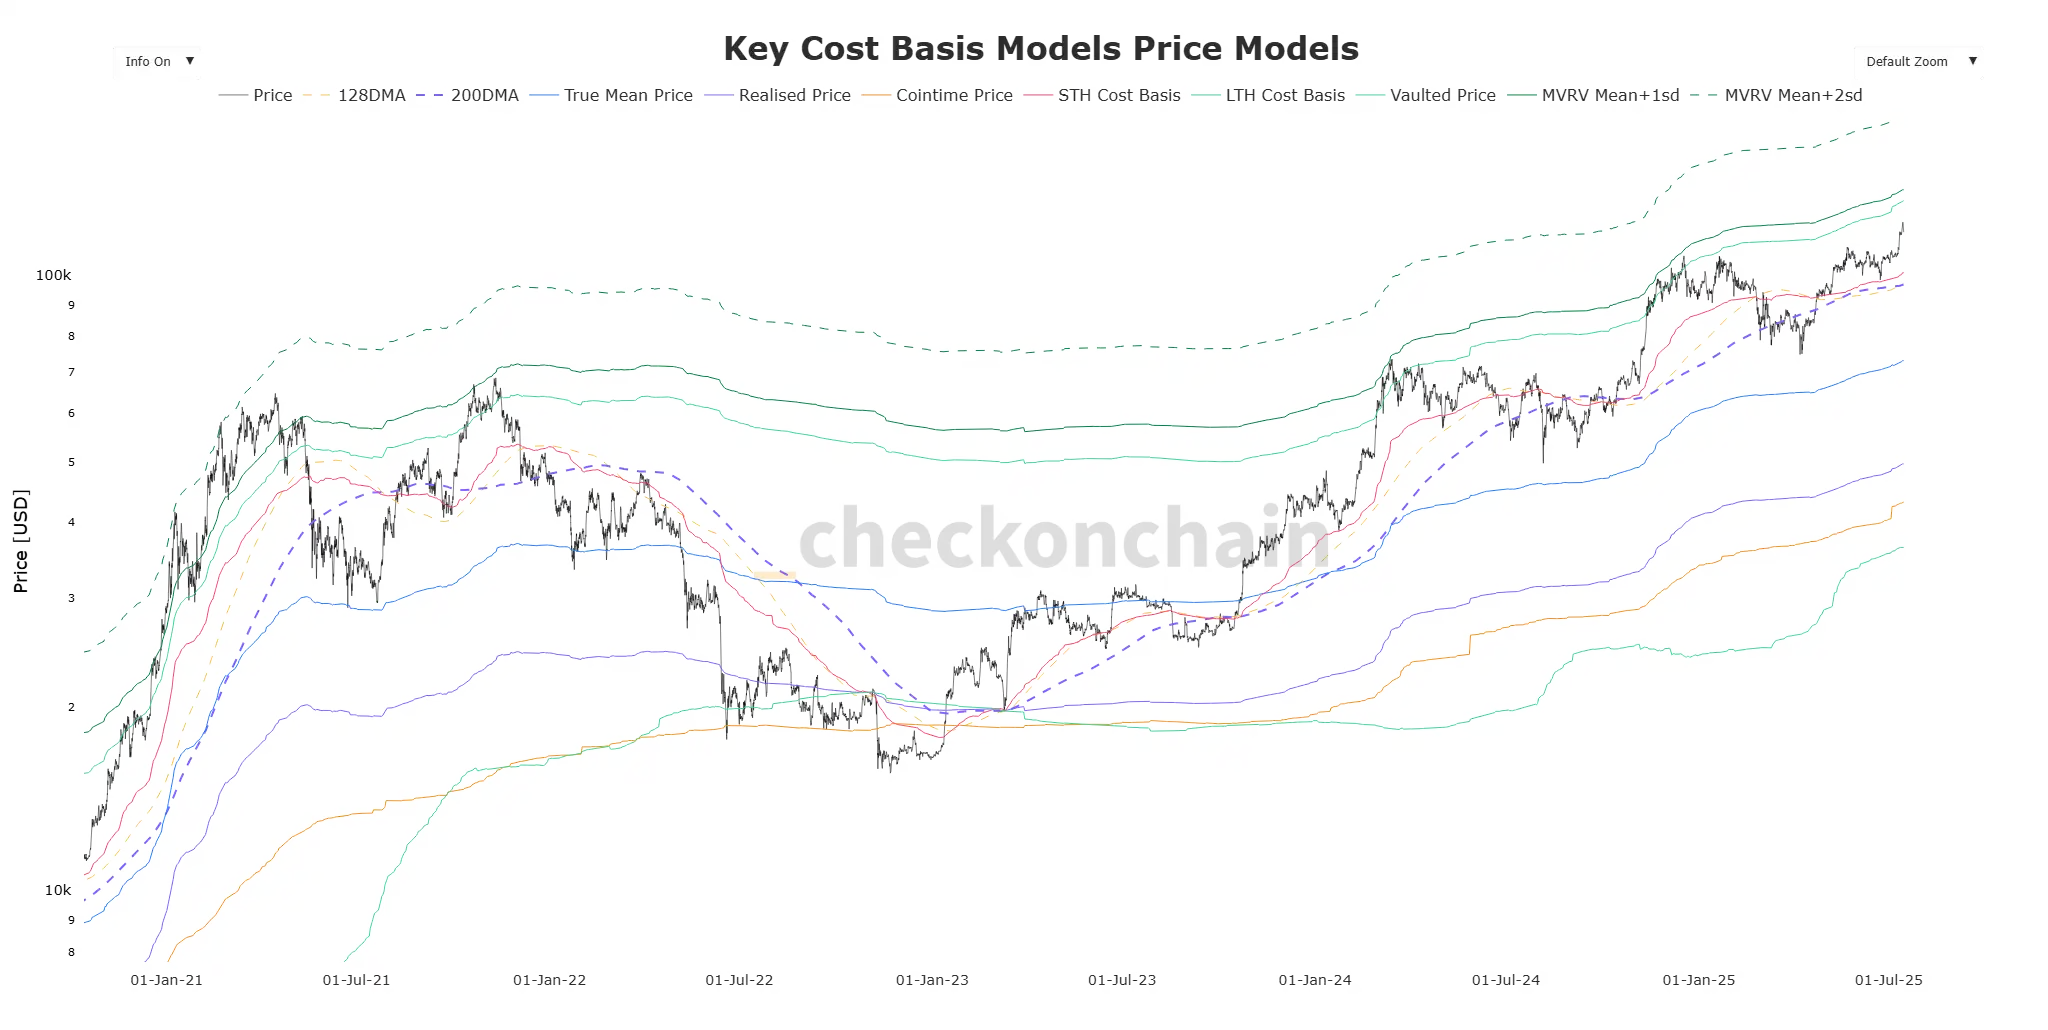
Key Cost Price Model
In the key cost price model he constructed, it is clear that compared to the previous quarter, the overall relative holding cost in the market has significantly increased. This means that with each price pullback, the market's "average buying cost" will rise, forming a higher support area for holdings. According to the URPD-R indicator data, over 55% of Bitcoin holding costs are currently concentrated above $90,000, creating a strong on-chain support zone. James Check emphasized that unless an extreme systemic event occurs, this range is unlikely to be easily broken.

As of July 14, 2025, based on realized cost distribution of investment wealth
At the same time, the LTH (long-term holders) indicator is releasing a rare historical signal. As of July 14, 2025, approximately 80% of Bitcoin has not been transferred in the past five months, indicating that market holdings are extremely stable and selling pressure is scarce. Through the "realized value distribution heatmap" and "holding group profit and loss status chart," it can be seen that a large number of long-term holders continue to hold despite global uncertainties (such as geopolitical issues, stock market adjustments, and tariff fluctuations), demonstrating a strong belief structure.

Relative holding amounts of various holding groups under profit and loss conditions
Additionally, @_43A6 further interpreted the "Peak HODL" signal, indicating that after LTH holdings reach a peak, the market often sees the start of a bull market. The average cost for LTH is about $35,000, and if the MVRV (Market Value to Realized Value ratio) reaches 5 as a reference for an extreme bull market peak, the theoretical peak price mentioned by James Check could be as high as $175,000. However, the probability of such an extreme situation occurring is very low, as most long-term holders will gradually realize profits at "life-changing" points (such as 5x or 10x returns) rather than dumping all at once.
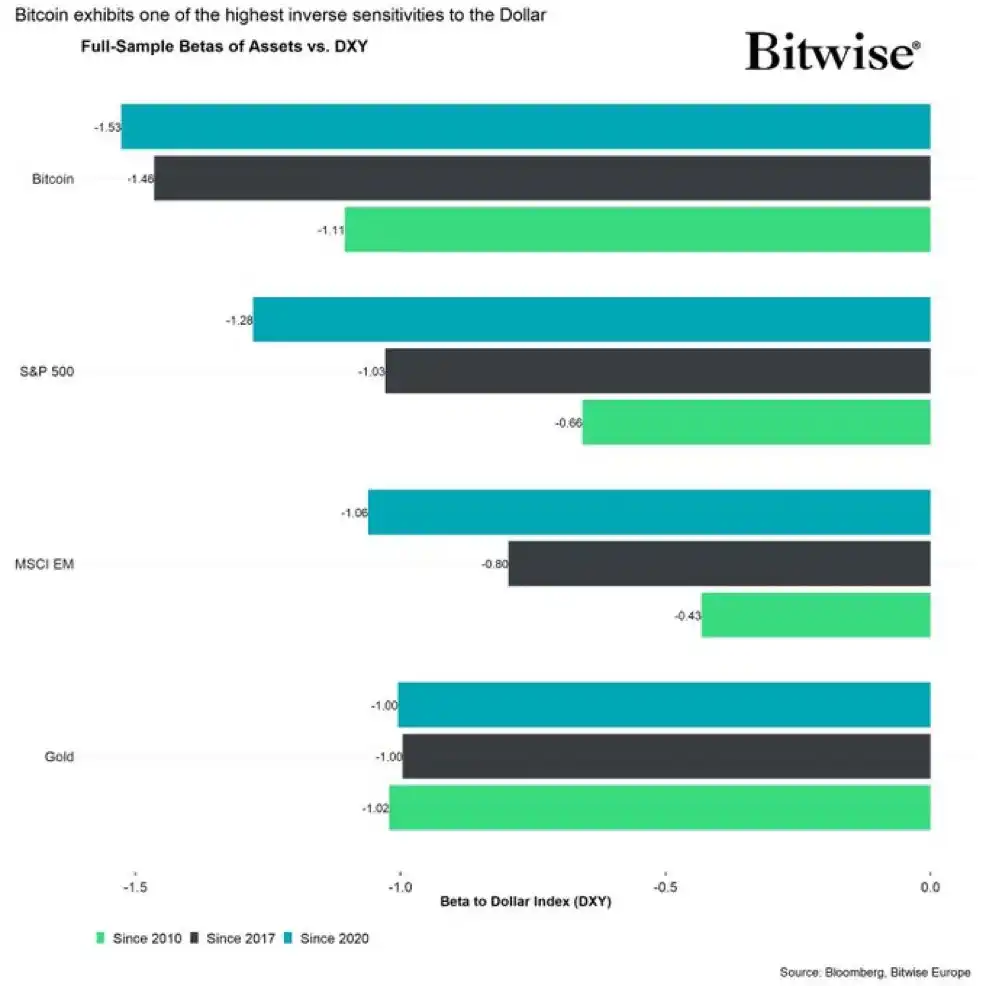
André Dragosch, PhD, provided data to explain part of this phenomenon, stating that the view that "Bitcoin reached a new high because the dollar fell more than 10% in 2025, and Bitcoin did not rise but merely reflects currency devaluation" is incorrect. In fact, Bitcoin's beta coefficient against the dollar is about -1.5, meaning that BTC's increase far exceeds the implied increase from the dollar's depreciation. This indicates that the active exit of LTH is a core manifestation of a healthy market structure, mature holdings, and the release of real value, rather than a mere monetary illusion.
Can We Be Bearish?
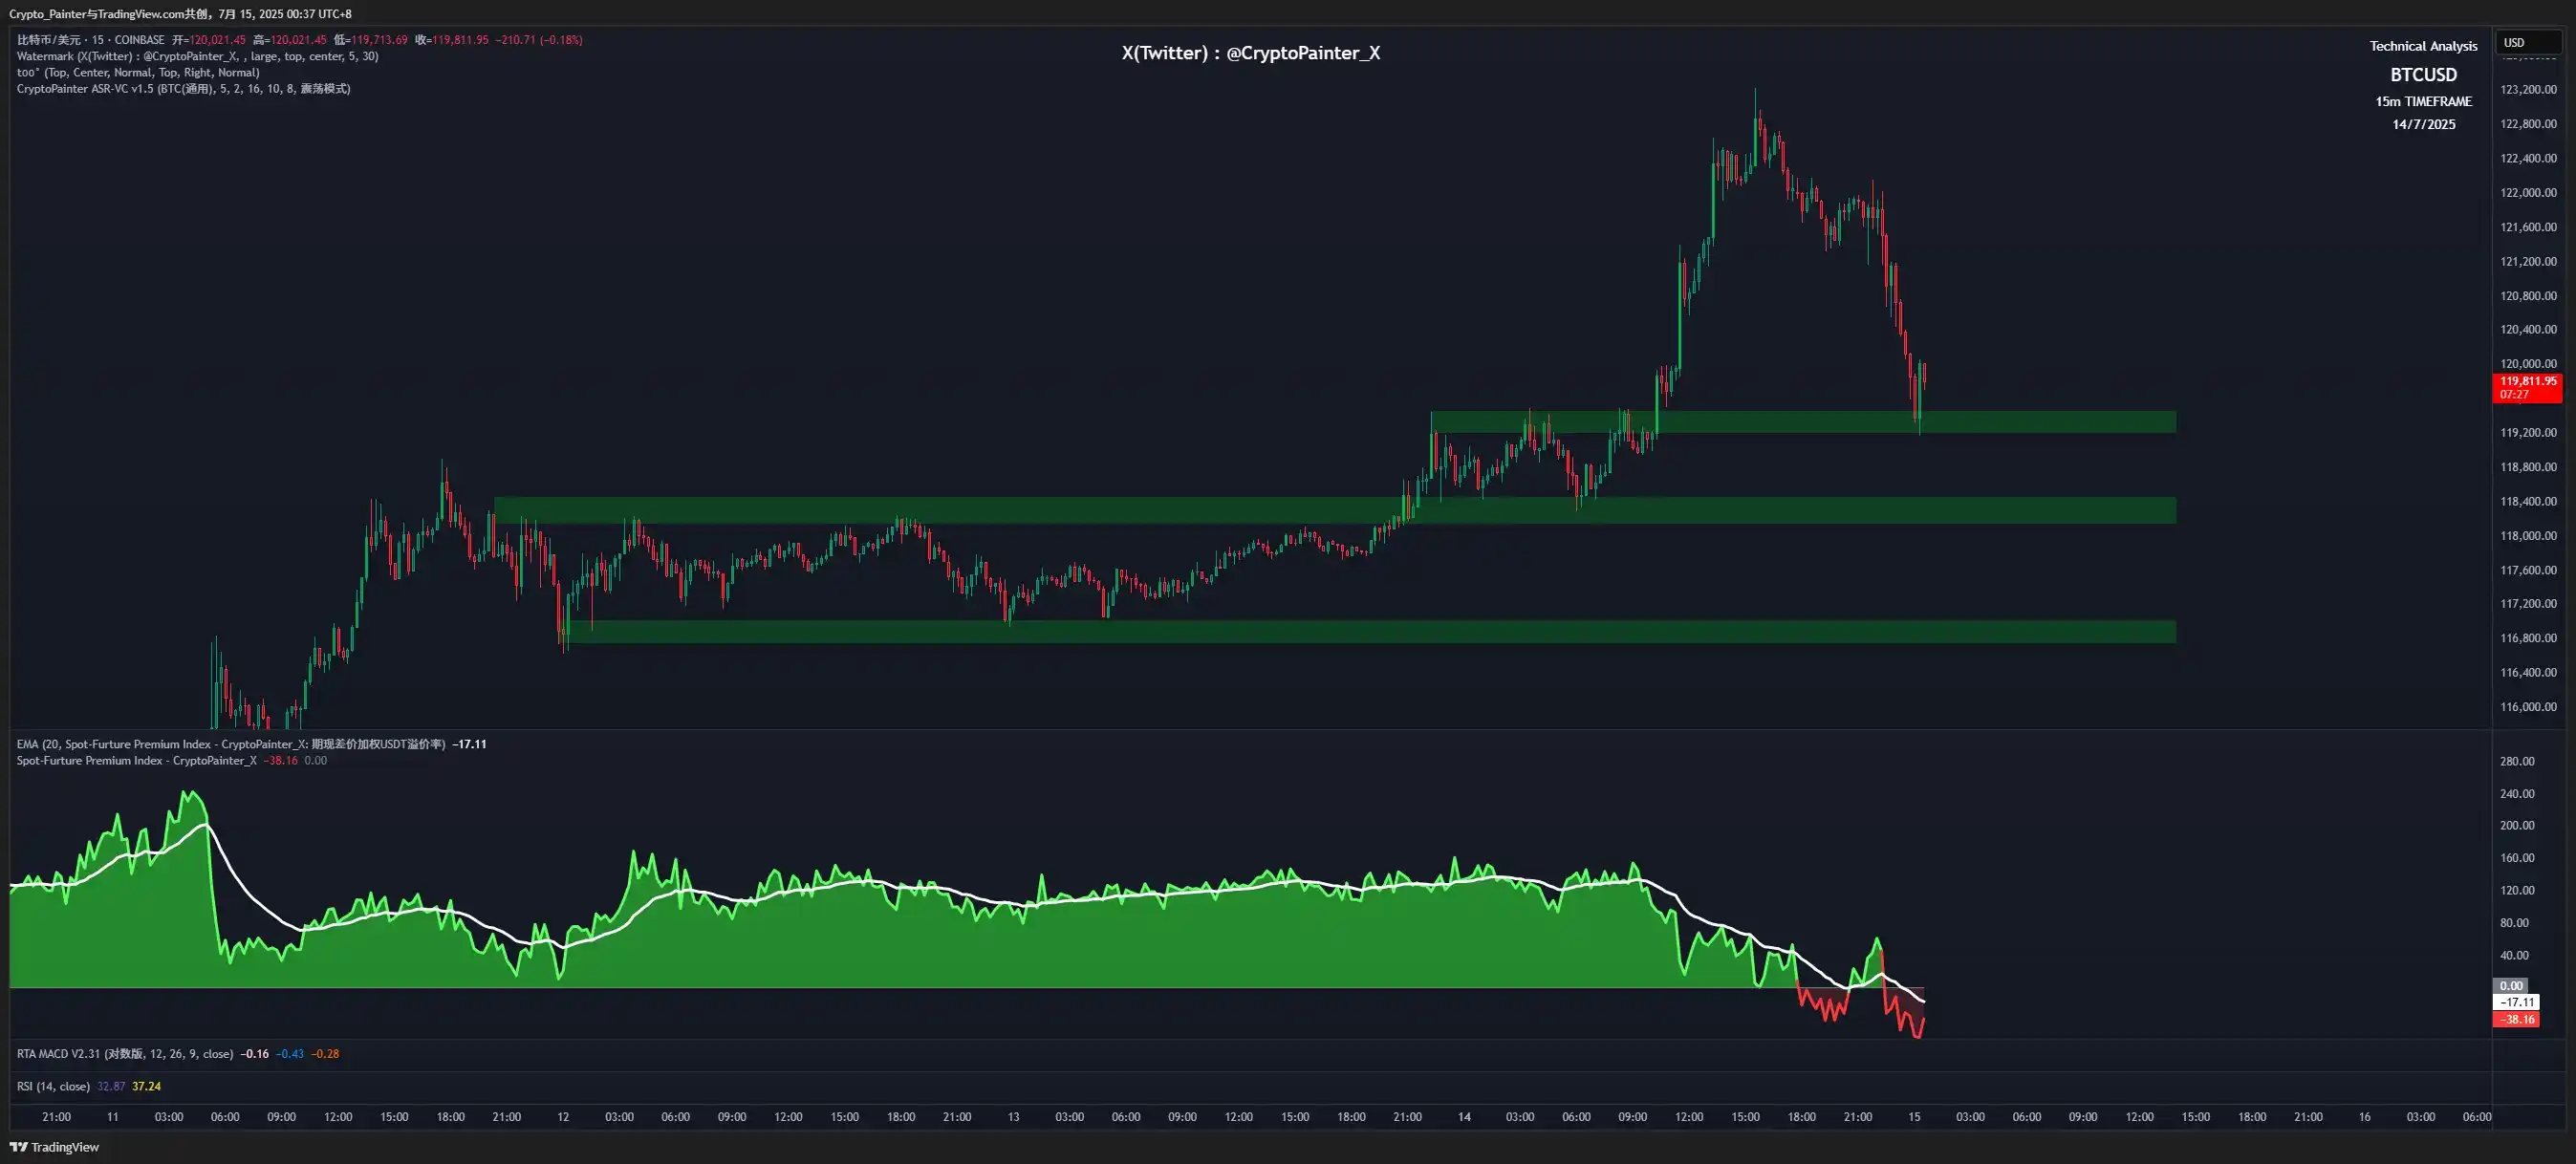
Notable observer and artist Crypto_Painter stated that after Bitcoin's price briefly surged to $123,000, the premium index in the spot market continued to decline, while the holding volume did not fall in tandem, indicating that U.S. investors are exhibiting clear high-level selling behavior. Meanwhile, long positions in the futures market are still being taken on, creating a misalignment between "dark selling" in the spot market and "hard buying" in the futures market. He pointed out that if this structure continues, the market may face a technical pullback in the short term, advising short-term bulls to tighten stop-losses until the spot premium is restored.
However, Crypto_Painter also emphasized that from an overall trend structure perspective, there has not been a fundamental breakdown, so he maintains a "pullback but not bearish" judgment. He further noted that although the current market has already experienced a significant initial pullback, short-term risks have been released, but since the premium has not yet rebounded, the mid-term risks facing the market are actually accumulating. While bulls buying during the pullback can provide short-term price support, under the backdrop of a continuously declining premium, the trend will be difficult to sustain.
He predicts that the market will likely enter a period of consolidation to wait for the repair of capital sentiment and structure. Within the current range of fluctuations, the three green potential support zones illustrated remain valid, and unless they are all broken, it is not advisable to easily turn bearish. What is truly concerning is if the price drops while the premium further declines, which could trigger a deeper market downturn, forming a trend reversal signal. Crypto_Painter summarized, "In the current situation, we are not afraid of pullbacks, but we are afraid of uncontrolled premiums."
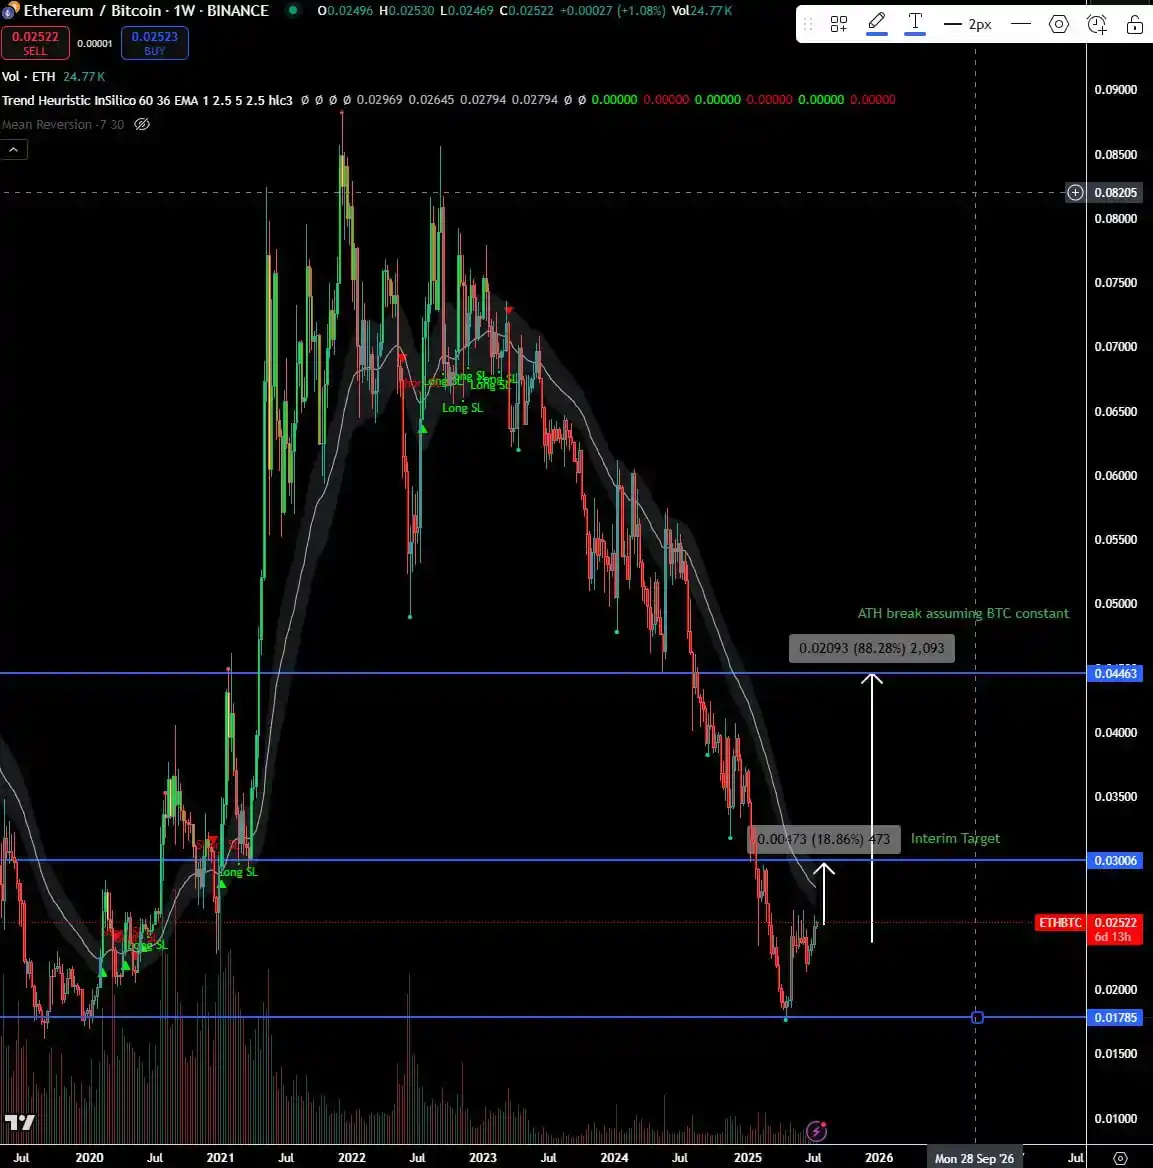
Trader Eugene Ng Ah Sio also chose to remain on the sidelines. He published an ETH/BTC exchange rate analysis on his personal channel, stating, "Although the price movement over the past week is encouraging, I need to see ETH/BTC break through the current range of 0.022-0.027 to confirm a structural breakout. My short-term target is 0.03, which now seems within reach. If Ethereum can hold above the $4,000 mark, the target of 0.04+ in higher time frames will also come into view. If this judgment holds, there will be significant operational space ahead."
Despite Bitcoin breaking historical highs and market sentiment being high, reflecting on the political upheavals, regulatory restructuring, and capital structure shifts experienced over the past year, this round of Bitcoin's rise is no longer merely a price fluctuation but a systemic reassessment intertwined with global capital, institutional signals, and technological faith.
As the driving force of the bull market shifts from retail speculation to institutional entry, and from liquidity games to upgrades in holding structures, the narrative of the rise seems to have transformed from a four-year cycle of "bull markets" to whether this marks "the beginning of a new order in crypto."
免责声明:本文章仅代表作者个人观点,不代表本平台的立场和观点。本文章仅供信息分享,不构成对任何人的任何投资建议。用户与作者之间的任何争议,与本平台无关。如网页中刊载的文章或图片涉及侵权,请提供相关的权利证明和身份证明发送邮件到support@aicoin.com,本平台相关工作人员将会进行核查。


