Cryptocurrency News
July 14 Highlights:
1. Cathie Wood: Ethereum zk integration measures may help maintain institutional leadership
2. Tornado Cash case prosecutors cite erroneous messages to prove "criminal intent," sparking controversy
3. UK BOE Governor warns banks against issuing stablecoins, opposes the introduction of a digital pound; Governor Andrew Bailey calls for prioritizing the development of digital deposits
4. Vitalik: AI is fully capable of seizing the cryptocurrency crown in a matter of weeks
5. Lianlian Digital plans to raise approximately HKD 394 million for blockchain, AI, and other technology applications
Trading Insights
In the trading process, finding the right entry timing is the biggest challenge. Today, I will share five trading entry logics. The same structure, different perspectives, which I believe can help you! 1. Trendline entry to catch rhythm continuation → If the trend is upward, the bullish rhythm remains intact; if it doesn't break, there is gaming value. 2. Horizontal support entry to observe range boundaries → The market's repeated return points are the balance points of bulls and bears; a pullback confirmation is a second opportunity. 3. Fibonacci 0.618 retracement entry to bet on inertia adjustment → Most pullbacks stop at the golden ratio, essentially a probability game of "adjustment after a rise." 4. Candlestick pattern entry to read market intentions → Patterns like engulfing and hammer are direct expressions of bullish and bearish attitudes, capturing immediate reactions. 5. Multiple signal overlap entry to seek probability resonance → Clues like trendlines, horizontal lines, and candlesticks overlapping at the same position approach the "maximum probability value." There is no right or wrong in these five logics; it only depends on your chosen market observation perspective.
LIFE IS LIKE
A JOURNEY ▲
Below are the real trading signals from the Big White Community this week. Congratulations to the friends who followed along; if your operations are not going smoothly, you can come and test the waters.
The data is real, and each order has a screenshot from the time it was sent.
**Search for the public account: *Big White Talks About Coins*
BTC
Analysis
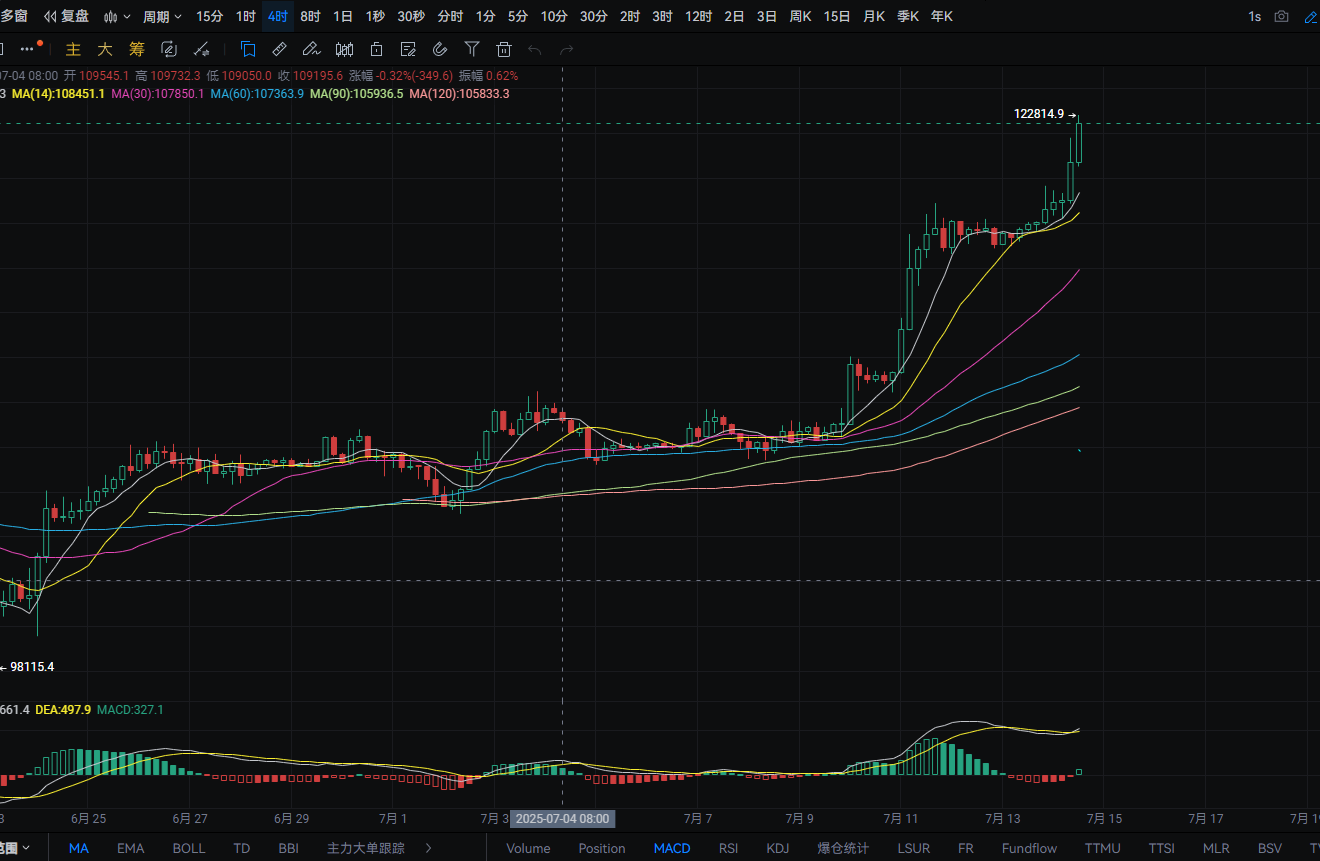
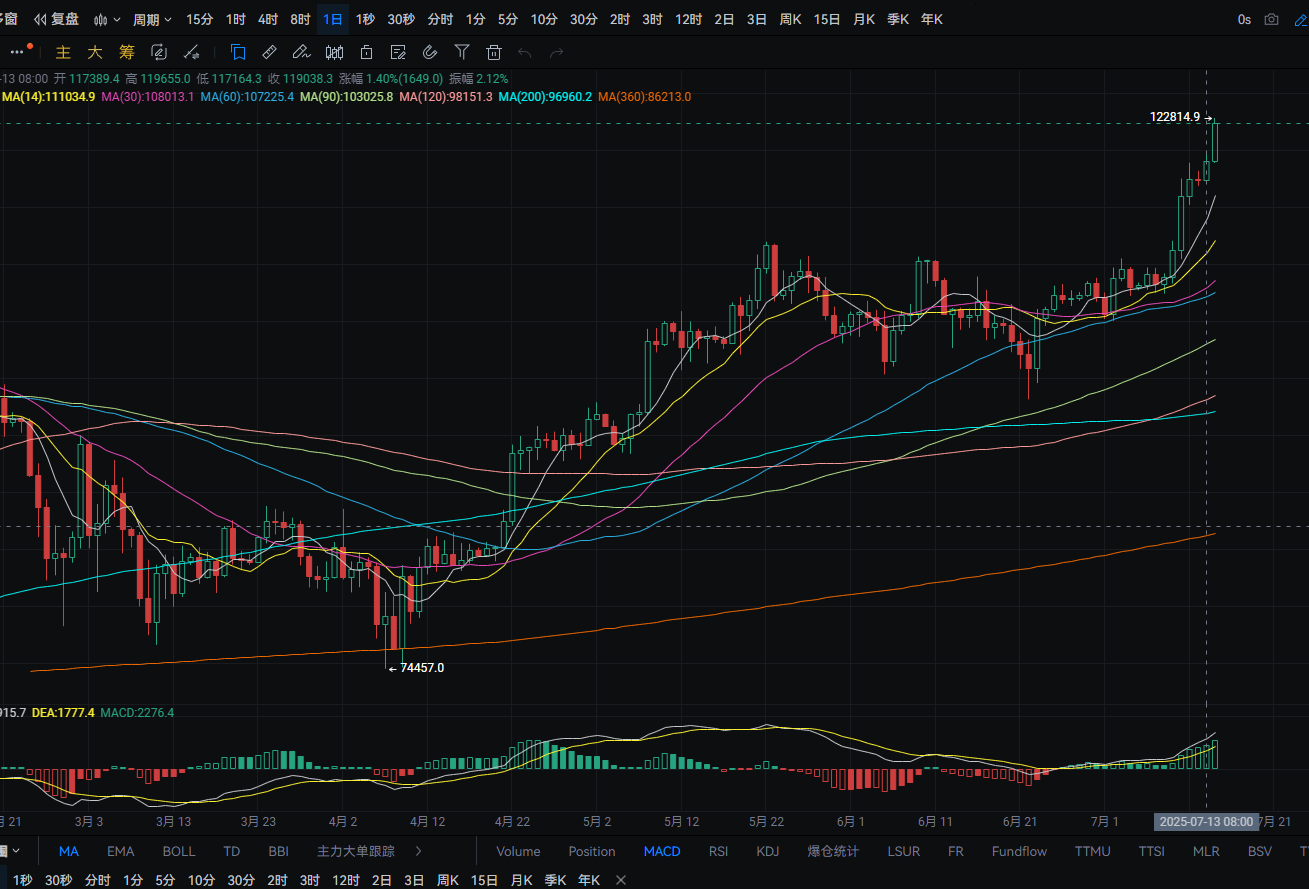
Bitcoin's daily line rose from a low of around 117,150 yesterday to a high of around 119,650, closing at around 119,050. The support below is around 117,500; if it breaks, it can be seen near MA14. A pullback can be made to buy near this level. The upper side can look for new highs again. MACD shows bullish increment. The four-hour support below is near MA14; if it breaks, it can be seen near MA30. A pullback can be made to buy near this level. MACD shows a decrease in bearish volume and has signs of forming a golden cross.
ETH
Analysis
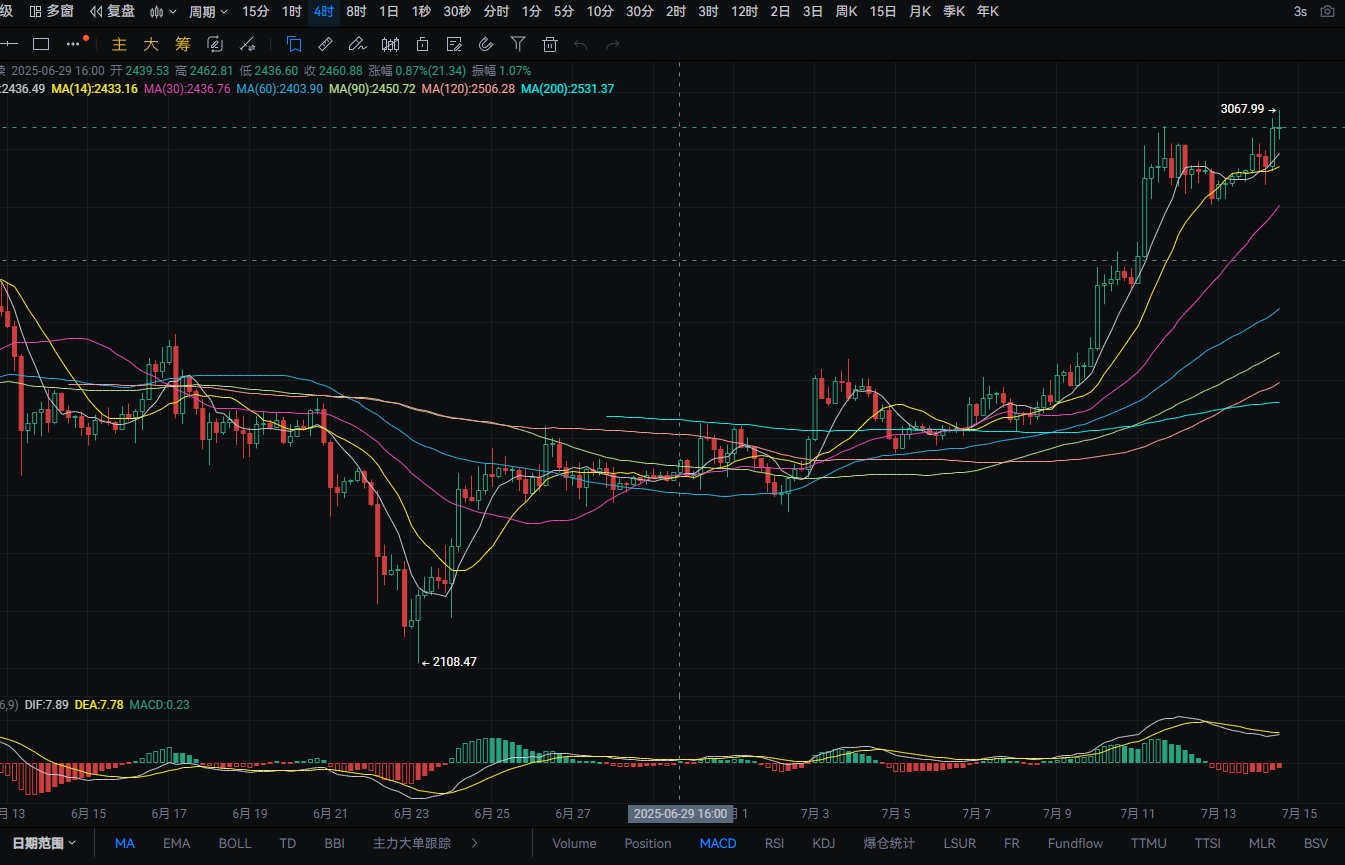
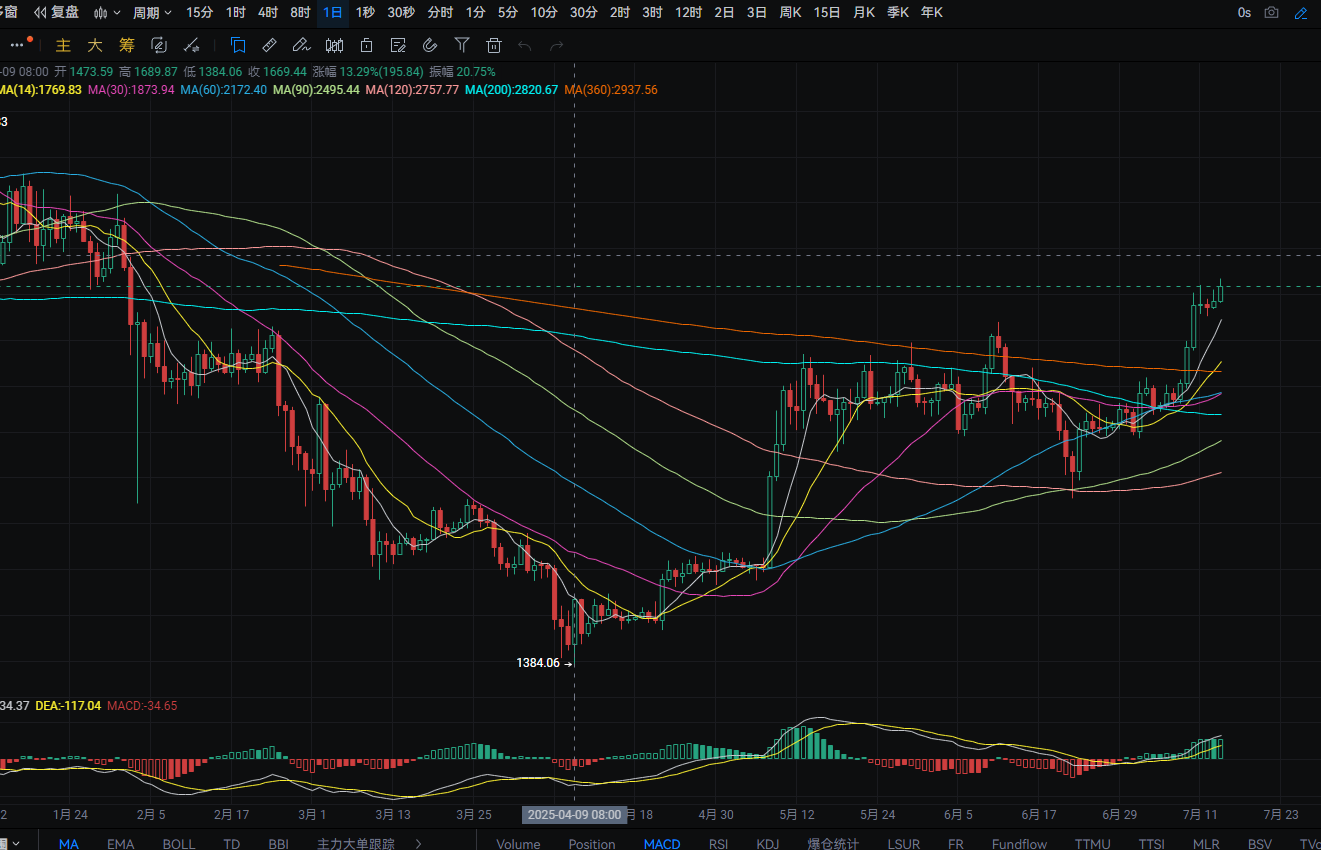
Ethereum's daily line rose from a low of around 2,935 yesterday to a high of around 3,020, closing at around 2,970. The support below is near the MA7 moving average; if it breaks, it can be seen near 2,680. A pullback can be made to buy near this level. The upper pressure is around 3,115; if it breaks, it can be seen near 3,225. A rebound to this level can be used to sell. MACD shows bullish increment. The four-hour support below is near MA14; if it breaks, it can be seen near MA30. A pullback can be made to buy near this level. MACD shows a decrease in bearish volume and has signs of forming a golden cross.
Disclaimer: The above content is personal opinion and for reference only! It does not constitute specific operational advice and does not bear legal responsibility. Market conditions change rapidly, and the article has a certain lag. If you have any questions, feel free to consult.
免责声明:本文章仅代表作者个人观点,不代表本平台的立场和观点。本文章仅供信息分享,不构成对任何人的任何投资建议。用户与作者之间的任何争议,与本平台无关。如网页中刊载的文章或图片涉及侵权,请提供相关的权利证明和身份证明发送邮件到support@aicoin.com,本平台相关工作人员将会进行核查。


