
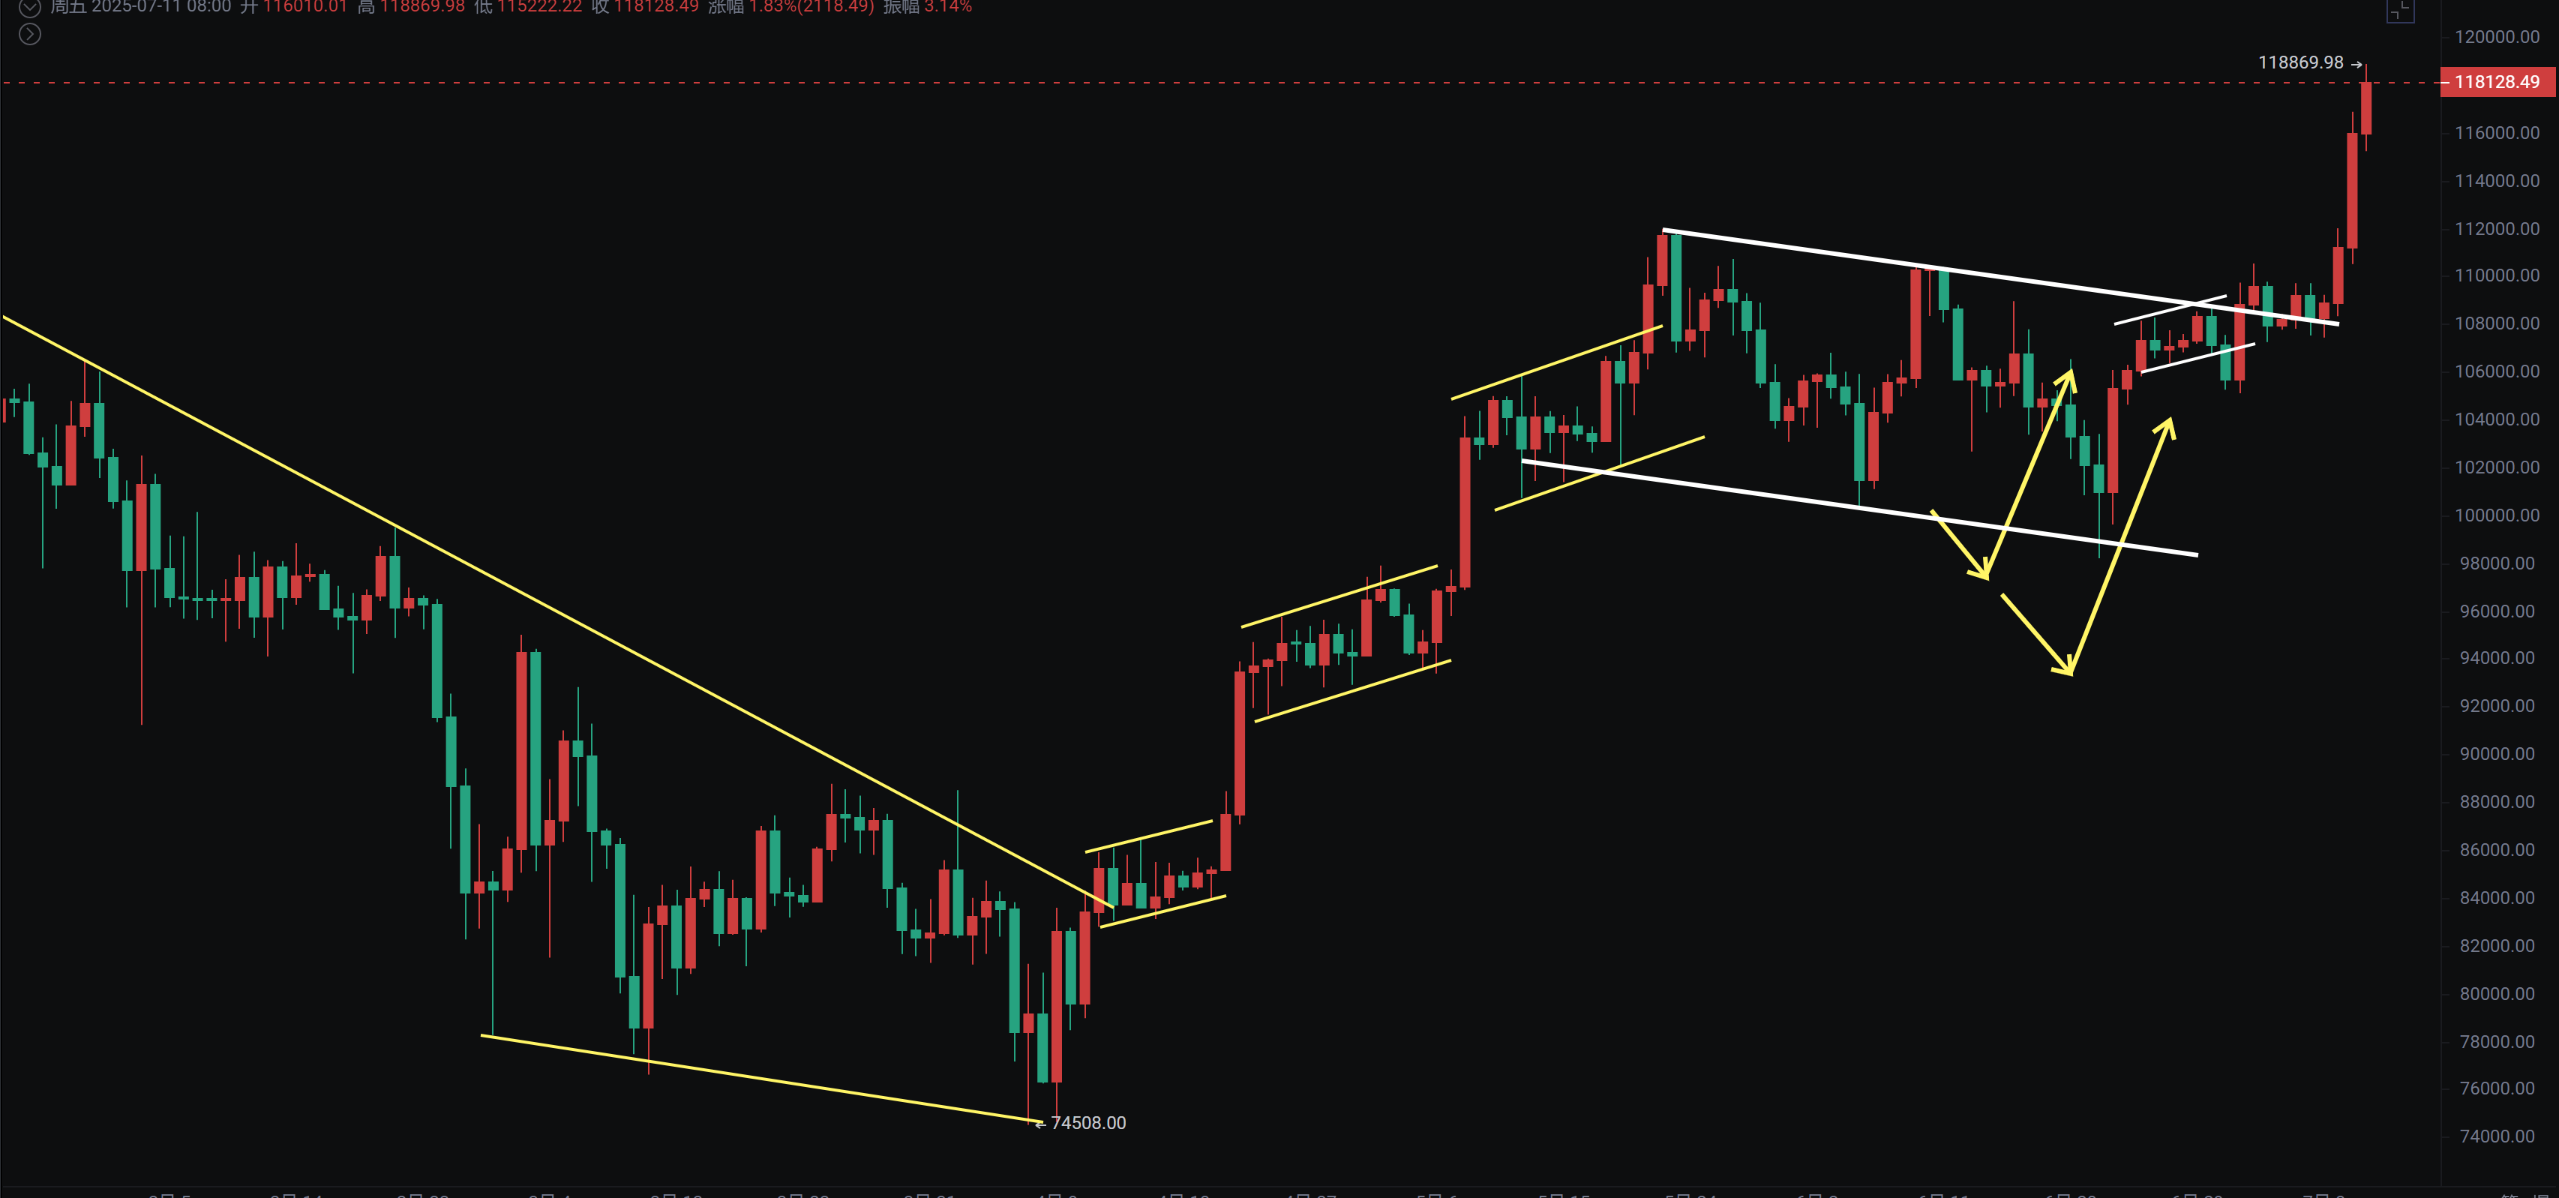
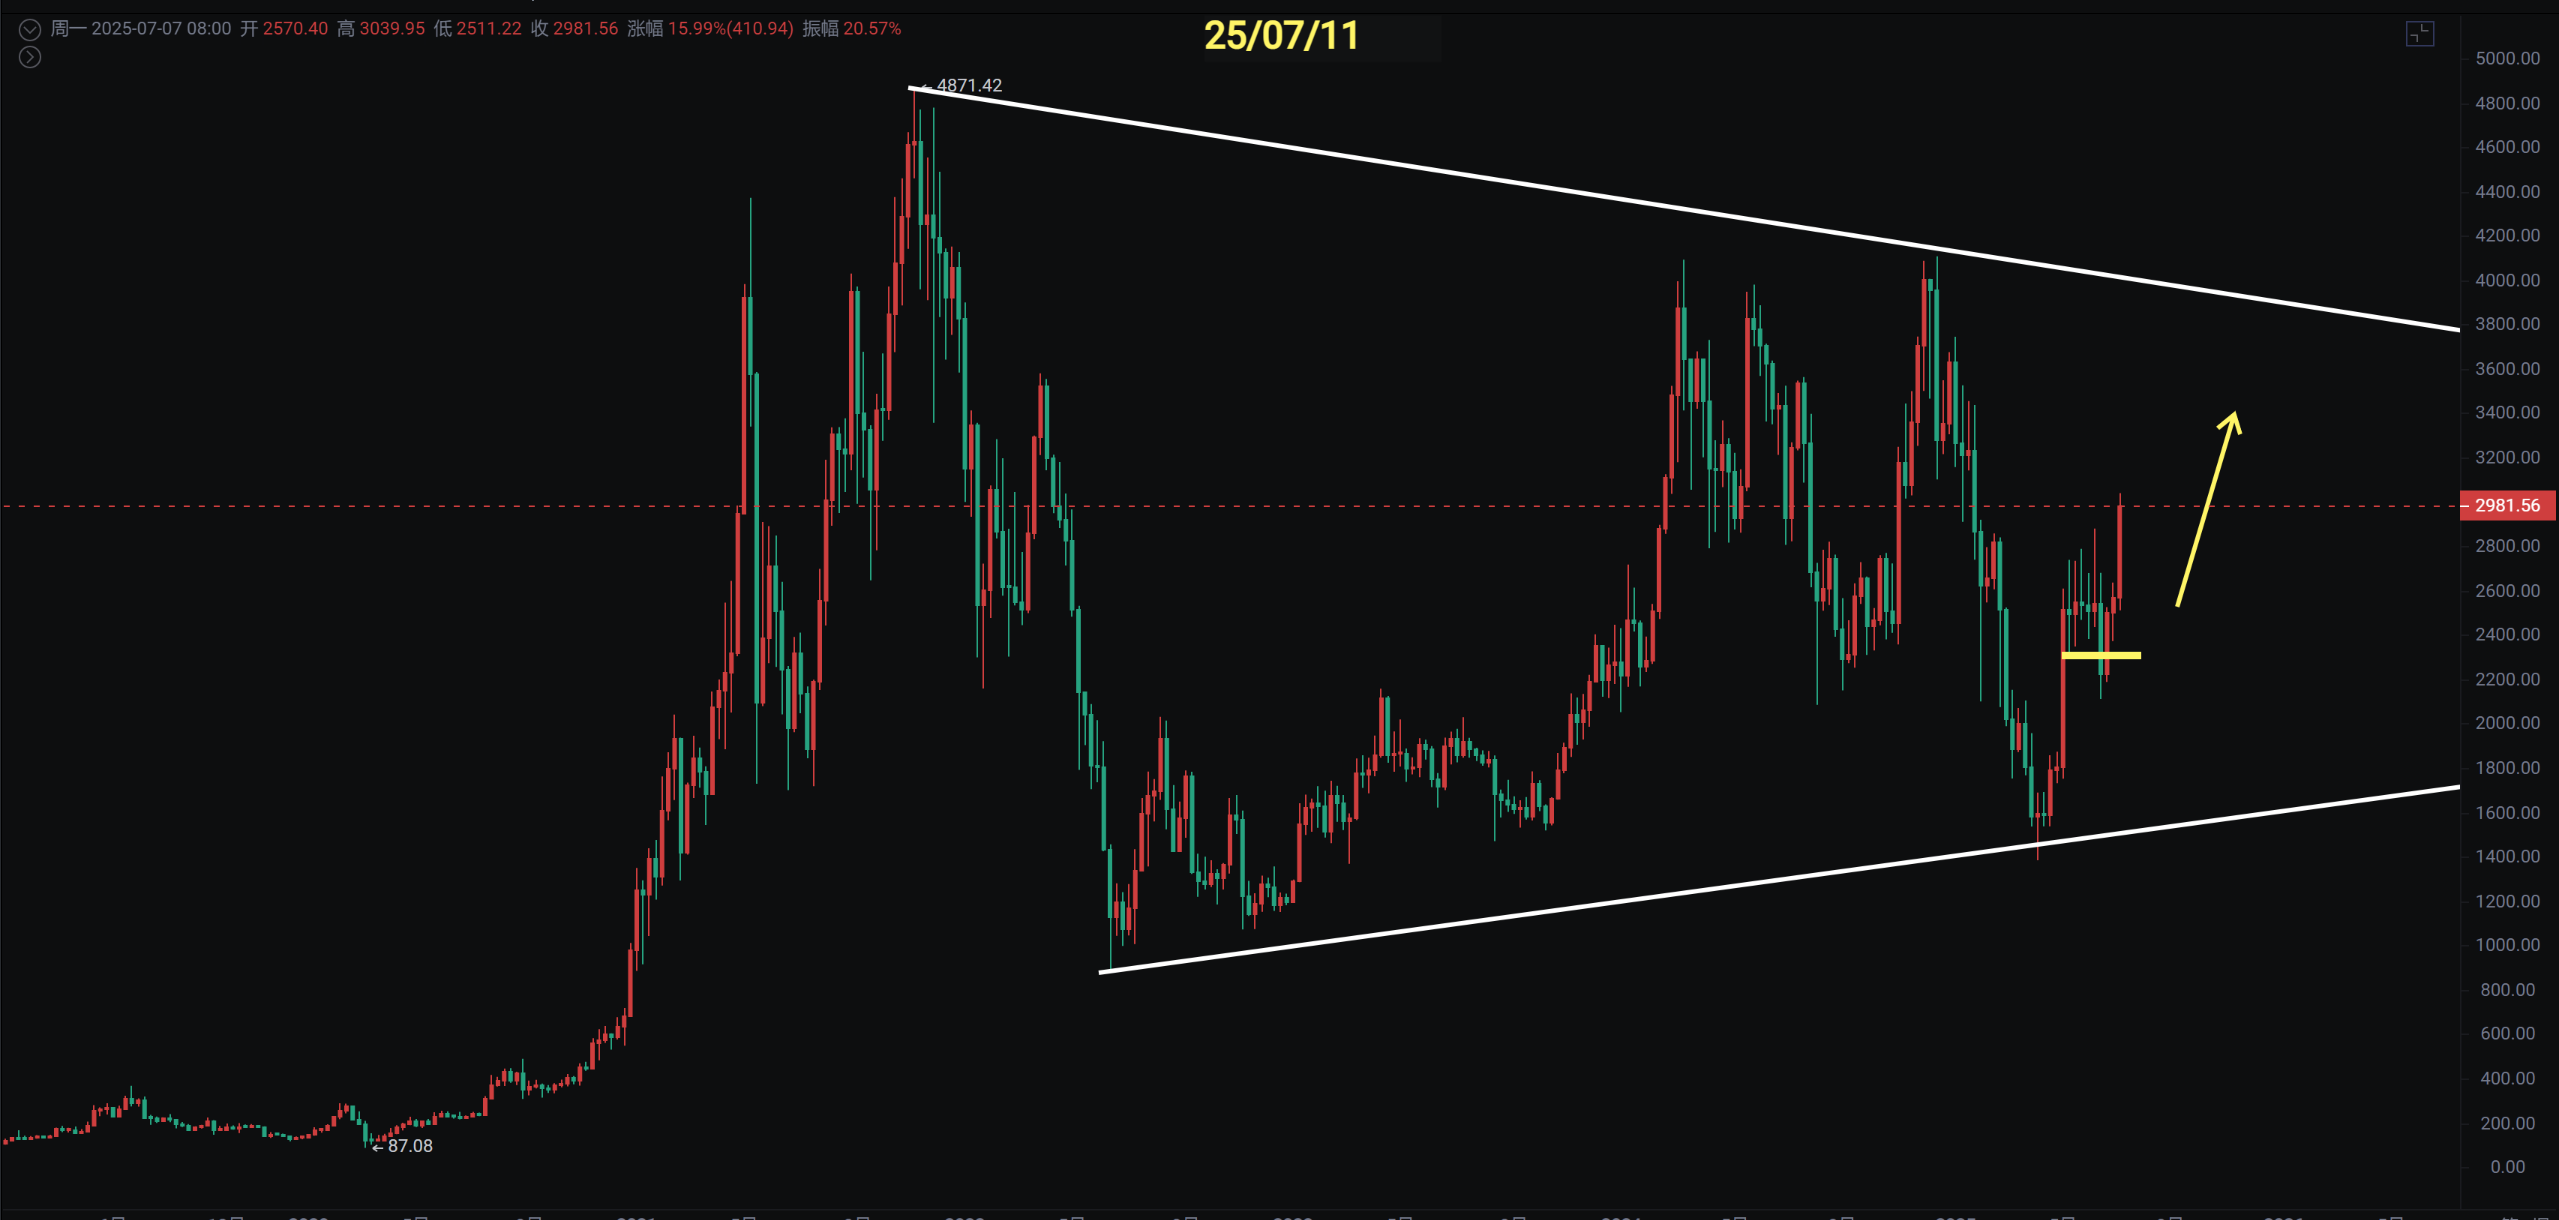
Bitcoin has finally broken through to a new high, reaching a maximum of 118,900, while Ethereum touched 3040. It has been worth it for us to remain bullish during this time, and altcoins have also taken off. Bitcoin's bullish flag has broken through and set a new high.
Next, we are looking at a target price of 135,000 for Bitcoin, with the peak of the bull market expected to be between 180,000 and 250,000. For Ethereum, the first target is 3300 and the second target is 4000. The peak of the bull market is unpredictable and mainly depends on whether the weekly level converging triangle can break through. If it does, there is a chance to reach 8000 to 10,000.
Bitcoin
The bullish flag for Bitcoin broke out after oscillating at the upper edge for four to five days, ultimately choosing to break upwards. Therefore, as I mentioned, as long as the daily MA20 and MA60 are not broken, there is still a chance to remain bullish. Currently, the MA20 and MA60 have formed a duck-bill shape and have just broken through the previous high, indicating that the trend will continue…
I have held onto my long position since last year's bullish flag breakout, and I currently have over 60% profit. Although the process has been quite torturous, the predicted trend has not been an issue. The narrative of this bull market and institutional funds has completely changed, with more and more listed companies joining the ranks of regular Bitcoin investments. Coupled with the increasing uncertainty in the global situation, gold has reached a temporary high, and funds from traditional financial markets need new reservoirs and safe-haven products to drive Bitcoin to continuously set new highs…
Support: 112,000
Resistance: None (temporarily looking at 135,000)
Ethereum
The entire operational logic of ETH is similar to what I mentioned before. Over the past two years, it has often consolidated at the bottom for several months before entering a one-sided trend. This wave is no different; I have been saying that the weekly chart is in a throwback pattern, but it took over a month to choose to break upwards, extending the time cycle.
If we consider the rise from 2020 to 4800 as the first wave, and from 2021 to now as the converging triangle second wave, then we are still in the second wave. When it breaks through, it may lead to a one-sided trend. Therefore, how long Ethereum will oscillate still needs observation. Unless it breaks through 4100, it may head towards new highs and a doubling trend.
Support: 2879
Resistance: 3300—4100
If you like my views, please like, comment, and share. Let's navigate through the bull and bear markets together!!!
This article is time-sensitive and for reference only, with real-time updates.
Focusing on K-line technical research, sharing global investment opportunities. Public account: BTC Trading Prince Fusu

免责声明:本文章仅代表作者个人观点,不代表本平台的立场和观点。本文章仅供信息分享,不构成对任何人的任何投资建议。用户与作者之间的任何争议,与本平台无关。如网页中刊载的文章或图片涉及侵权,请提供相关的权利证明和身份证明发送邮件到support@aicoin.com,本平台相关工作人员将会进行核查。


