Master Discusses Hot Topics:
This week's focus is clear: on Tuesday, the suspension period for U.S. tariffs ends, and on Wednesday, the Federal Reserve's meeting minutes will be released. These two events, one related to foreign trade and the other to liquidity, are both potential triggers for sudden market changes, and the direction is likely to be counteracting.
Recently, some have been waiting to see 80,000 bitcoins crash the market, but what happened? Nothing at all. Those who shorted are probably stuck in place, so stop daydreaming. You can take a look at the inventory of bitcoins on the exchanges; it's quite clear.
In fact, since November last year, regardless of whether bitcoin rises or falls, the inventory on exchanges has been decreasing, reaching the lowest point in nearly five years. What does this indicate?
In simple terms, it means someone is quietly buying, taking their share, and no one wants to run. Under this consensus, unless there is a shocking systemic risk in the bitcoin circle, there really isn't anything that can cut bitcoin in half.
In this environment, good news keeps coming, and even "fake good news" is enough to pull up a big bullish candle. Bessenet just mentioned establishing a tariff partnership, and the market immediately reacted. Even before the U.S. stock market opened, bitcoin had already surged; how can you short in such an emotional atmosphere?
Moreover, the market is currently driven by emotions, not logic. Bitcoin has transitioned from a conflict between the U.S. and China to a resolution on tariffs; this plot twist is faster than palace intrigue, leaving no room for a breather. The inventory on exchanges is the only stabilizer in this drama and the most accurate barometer.
Returning to the market situation, currently, 110.6K is clearly being targeted to siphon liquidity, tricking the bulls and killing the bears before potentially continuing to rise. There is a temptation of a potential new high at 110.2K above, and liquidity pockets at 105K and 98K below.
But to be honest, to push it down, we need to wait until the main force has consumed enough at the top for a pullback to be possible. Right now, there is basically no strong resistance between 108.8K and 110K; it looks like it can be chased, but entering now could easily lead to high positions. If you want to chase, you should wait for a breakout above 110.2K and then confirm with a pullback; otherwise, it’s better to wait for it to fill the gap around 108.4K before considering entry.
In conclusion, the market has not yet completed its movement; unless negative news can break through 100K and drop below 96K, it does not count as structural damage. There was no major adjustment in July, and if Japan truly raises interest rates in August, then there may be a real downturn.
Master Looks at Trends:
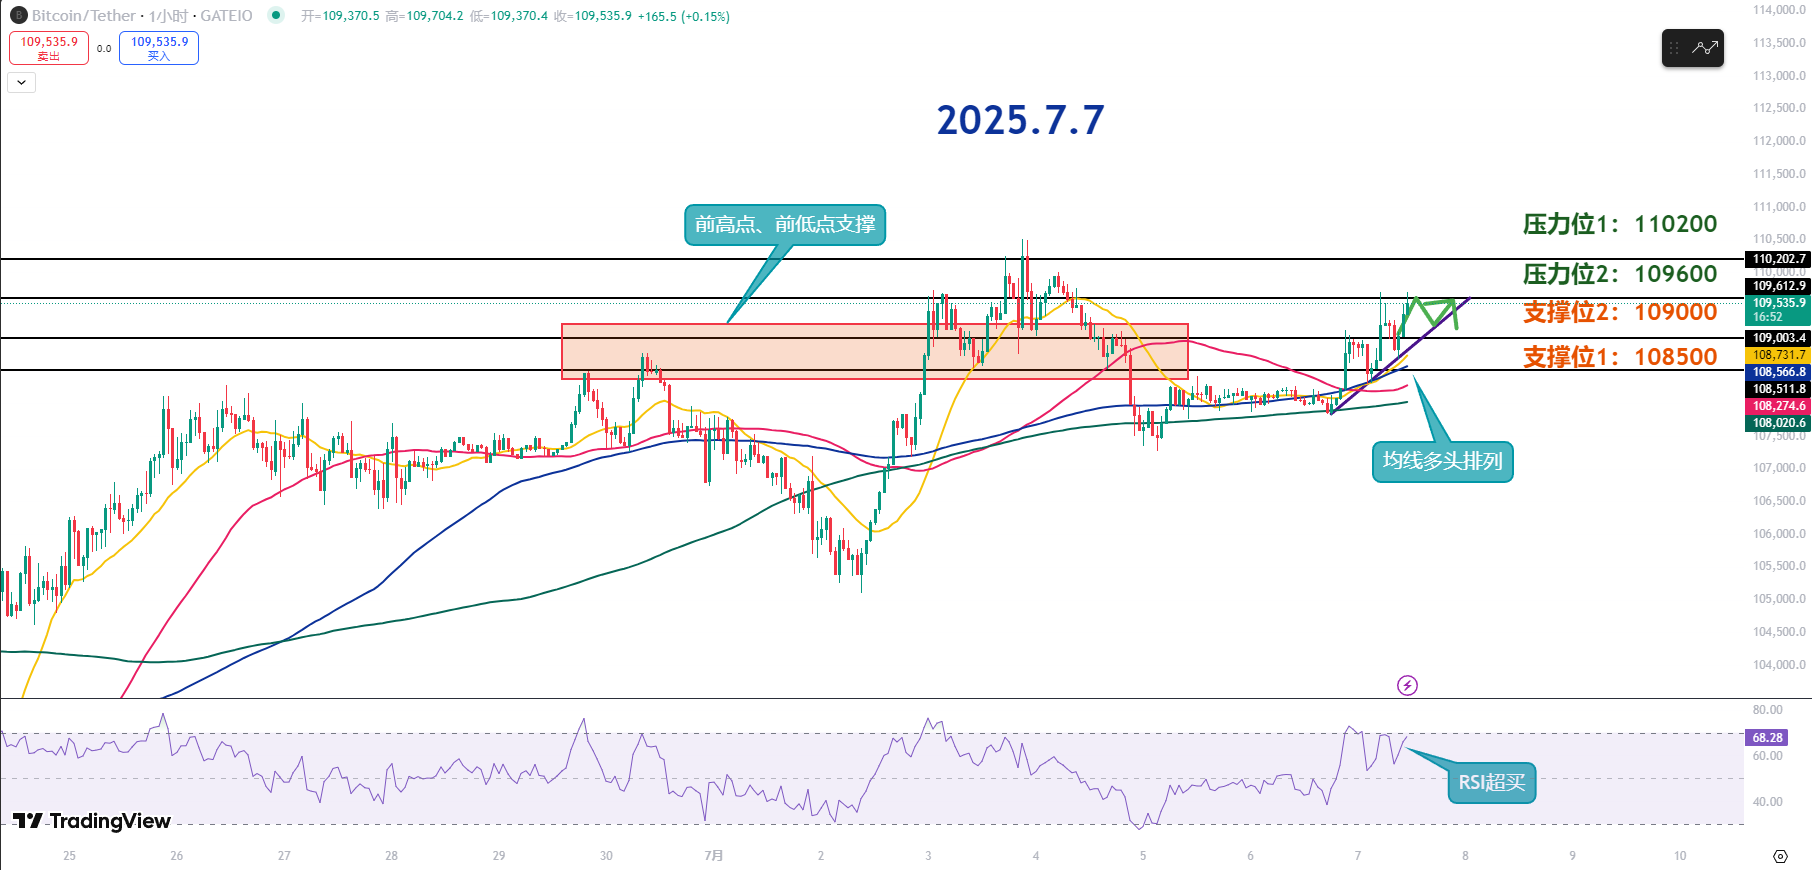
Resistance Levels Reference:
Second Resistance Level: 110200
First Resistance Level: 109600
Support Levels Reference:
Second Support Level: 109000
First Support Level: 108500
At the hourly level, the current market is in a reasonable pullback and upward structure, with the short-term upward trend line confirmed. The gap between the previous highs and lows, from 108.5K to 109K, has formed the current short-term support zone.
Currently, the price is fluctuating between 109K and 109.6K, showing a range-bound movement. Overall, the bias remains bullish, but blindly chasing the rise is not recommended; one should look for low-buy opportunities during pullbacks. The RSI has now entered the overbought zone, waiting for a pullback to choose the right moment for positioning.
The first resistance level at 109.6K serves as an important short-term resistance; if touched for the first time, a short-term pullback will occur. One can wait for a pullback and then enter low long opportunities based on the short-term trend line.
The second resistance level at 110.2K is a previous attempt to break through that failed; if this time it successfully breaks above, it is expected to further challenge the previous high and initiate a new round of increases.
The first support level at 109K is the previous high point at the beginning of this upward movement; if the price can effectively hold after a pullback, the short-term rebound structure will continue.
The second support level at 108.5K, if further adjusted to this level, also belongs to a reasonable pullback zone. Below, there are several moving averages (20MA, 60MA, 120MA, 200MA) as support for gradual accumulation, allowing for phased low-buy positioning.
Additionally, 110K is a key psychological resistance level; until it is effectively broken, the price will repeatedly experience pullbacks, rebounds, and retests.
Be cautious about chasing highs during the day.
7.7 Master’s Wave Strategy:
Long Entry Reference: Accumulate in the 108500-109000 range, Target: 109600-110200
Short Entry Reference: Short directly after breaking below 107800 and failing to retest 107800, Target: 106000
If you truly want to learn something from a blogger, you need to keep following them, rather than making hasty conclusions after just a few market observations. This market is filled with performers; today they screenshot long positions, tomorrow they summarize short positions, making it seem like they "always catch the top and bottom," but in reality, it’s all hindsight. A truly worthy blogger will have a trading logic that is consistent, coherent, and withstands scrutiny, rather than jumping in only when the market moves. Don’t be blinded by exaggerated data and out-of-context screenshots; long-term observation and deep understanding are necessary to discern who is a thinker and who is a dreamer!
This article is exclusively planned and published by Master Chen (WeChat public account: Coin God Master Chen). For more real-time investment strategies, solutions, spot trading, short, medium, and long-term contract trading techniques, operational skills, and knowledge about candlesticks, you can join Master Chen for learning and communication. A free experience group for fans has been opened, along with quality experience projects like community live broadcasts!

Warm reminder: This article is only written by Master Chen on the official public account (as shown above); other advertisements at the end of the article and in the comments section are unrelated to the author!! Please be cautious in distinguishing between true and false, thank you for reading.
免责声明:本文章仅代表作者个人观点,不代表本平台的立场和观点。本文章仅供信息分享,不构成对任何人的任何投资建议。用户与作者之间的任何争议,与本平台无关。如网页中刊载的文章或图片涉及侵权,请提供相关的权利证明和身份证明发送邮件到support@aicoin.com,本平台相关工作人员将会进行核查。


