Original Title: Moon or Doom: Will Bitcoin See Fireworks on July 4?
Original Author: Jose Antonio Lanz, Decrypt Analyst
Original Compilation: Bitpush
Can the price of Bitcoin stabilize above the $108,000 mark before the end of this week? This is the question posed to traders by the prediction platform Myriad. As the deadline approaches, traders are facing a critical decision moment.
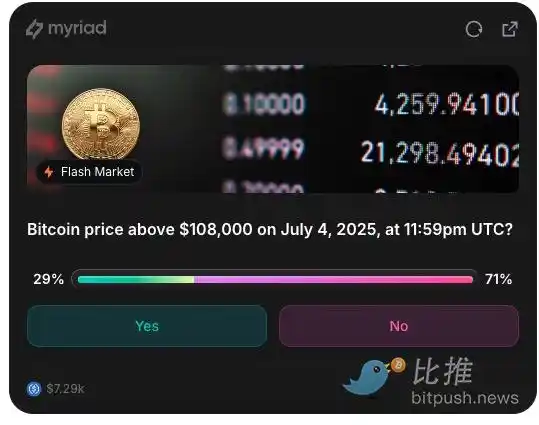
Just yesterday, when Bitcoin was trading around $107,640, it seemed likely to break through this level. At that time, only a 0.33% increase ($360) was needed to achieve the target, and the betting ratio on the Myriad platform was nearly even, with the bearish side holding a slight lead at 50.8%.
However, the situation took a sharp turn today. As Bitcoin fell back to the critical level of $106,000 (a price point to watch closely in July), the odds on the Myriad platform changed dramatically. Predictors now believe there is a 69% chance that Bitcoin will not break through $108,000 before July 4, suggesting that this week may end on a bearish note. So, what do the chart data reveal about Bitcoin's potential movements?
Bitcoin Price: Signals Revealed by the Chart
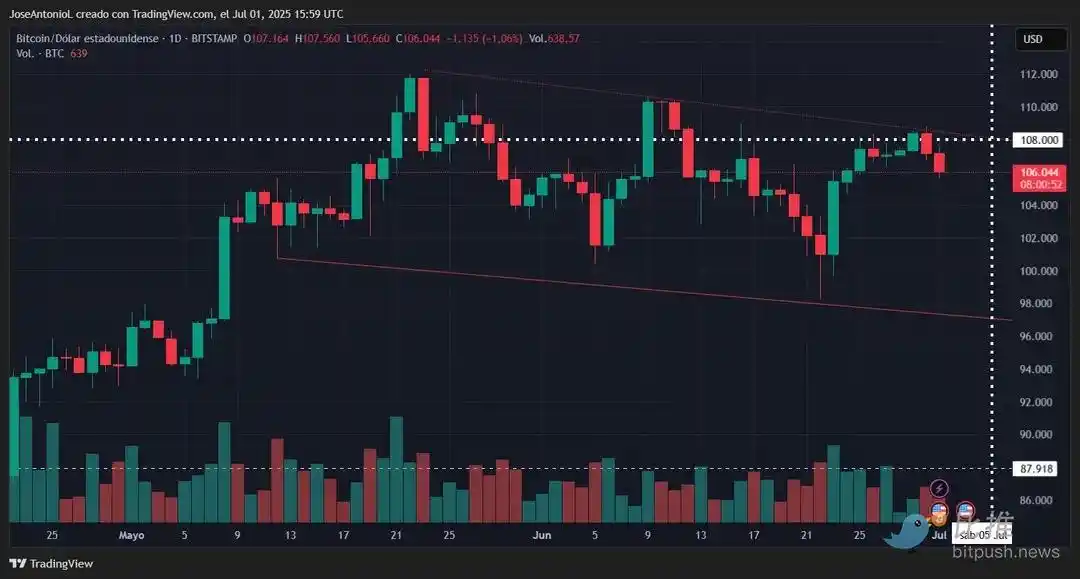
When Bitcoin hovers below the psychological level of $108,000, the core issue is not whether the price can reach that point, but whether it can close above it—there is a fundamental difference between the two. Analyzing the 4-hour candlestick chart reveals that since June 25, Bitcoin has only closed above $108,000 three times in 30 trading periods. More notably, since June 9, Bitcoin has not achieved a daily close above this level—historically, Bitcoin's daily closing price has exceeded this threshold only 8 times.
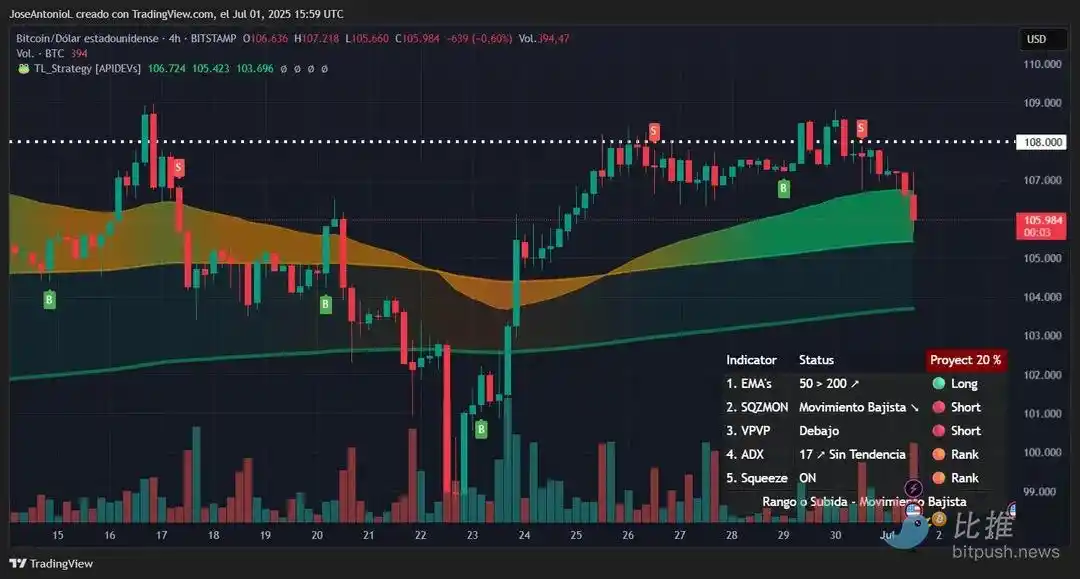
However, for day traders, technical analysis at the 4-hour level can provide key insights for this short-term prediction:
From a purely technical perspective, Bitcoin is facing a classic dilemma of being "within reach yet far away." The 4-hour chart shows that the price has repeatedly attempted to break through the $107,500-$108,000 range but has faced selling pressure. These failed breakout attempts have left significant upper shadows on the candlesticks, indicating that buyers' attempts to push prices higher have been consistently thwarted by sellers at resistance levels.
This proximity can be quite misleading. While a 2% increase may seem trivial in the cryptocurrency market, where daily volatility often reaches 3-5%, the repeated failure to break through this critical level suggests deeper market mechanisms at play. For traders holding positions, an effective breakthrough of this resistance would indicate that bulls have enough momentum to push prices to new highs in the short term.
The Average Directional Index (ADX) currently reads 17, well below the 25 threshold needed to confirm trend strength. This weak reading indicates that Bitcoin is in a non-trending state, which is particularly unfavorable when attempting to break through key resistance. A low ADX environment typically leads to price oscillating between support and resistance levels rather than achieving decisive breakouts.
Specifically regarding the current trend, Bitcoin has been oscillating between $107,000 and $108,000 since June 25: sometimes dipping below this level, with fewer breakout attempts, but always returning to the horizontal channel, confirming the judgment of a lack of clear trend in the short term and validating the accuracy of the ADX indicator.
The squeeze momentum indicator shows that the market is brewing bearish momentum, indicating that the downward trend is dominant in the shorter term. This bearish pressure directly contradicts the bullish momentum needed to break through $108,000. In short, traders currently seem more inclined to believe that the market will experience a bearish pullback rather than continue a long-term upward trend.
However, there is one technical indicator that still holds a glimmer of hope: the Exponential Moving Average (EMA). This indicator guides trading decisions by calculating the average price over a specific period. Continuing to observe the 4-hour chart, the 50-period EMA remains above the 200-period EMA, maintaining a bullish "golden cross" structure. This arrangement suggests that despite the weakening short-term momentum, the overall trend remains upward.
However, the price has fallen below the 50-period EMA, indicating short-term bearish pressure. Another valuable indicator is the visible range volume distribution. The current price is trading above the control point, which is typically a bullish signal. But since the price is also close to resistance and lacks momentum, the likelihood of a pullback (i.e., "mean reversion") is higher.
The volume distribution chart highlights the price areas with the most active trading—these areas often form natural support or resistance, as traders typically set their take-profit or stop-loss orders there. For example, after establishing a position at a certain price level, you might set a stop-loss at the same level to manage risk. Although the current price is within the buying range of most traders (slightly bullish), the lack of clear direction is insufficient to determine market sentiment.
Weekend Effect
A key factor often overlooked is that July 4 falls on a Friday, and the prediction deadline is at 23:59 UTC (which is already Saturday morning for most global markets). Weekend trading is typically characterized by reduced institutional participation, shrinking overall volume, and widening bid-ask spreads, with only the "die-hard" cryptocurrency traders remaining active, as this market never sleeps. This environment makes it more difficult to sustain a breakthrough at key resistance levels—due to a fundamental lack of buying power to absorb selling pressure.
Conclusion: Easy to Reach, Hard to Hold
Strictly based on chart analysis, the probability of Bitcoin reaching at least $108,000 before the July 4 deadline remains relatively high—after all, it requires less than a 2% increase. But to close above this level? Currently, the outlook seems bleak. The reasons are as follows:
· Historical Rejection Rate: The chart shows that there have been at least 4-5 recent attempts to break through this area that have ended in failure, forming a statistical precedent.
· Momentum Divergence: Although the price is close to its peak, momentum indicators (RSI, ADX) show weakening driving force—a typical top divergence pattern.
· Time Decay: As the deadline approaches and momentum wanes, each hour that passes without a breakthrough reduces the probability of success.
· Volume Requirements: Breaking through and holding a new price level requires sustained volume, while the weak ADX reading indicates insufficient buying power.
· Weekend Liquidity Drain: The deadline coincides with a critical moment of institutional capital withdrawal.
Of course, the above analysis is based on the premise that market conditions remain unchanged. But this is the cryptocurrency market, where anything is possible. When Bitcoin is just 0.33% away from the $108,000 target, even a single large order, a political statement, a "whale" movement, or social media sentiment could completely change the outcome. While the charts suggest that resistance may hold, the predictive power of traditional technical analysis is inevitably diminished in the face of such a small gap.
Key Price Levels:
· Immediate Resistance Level: $108,000 (predicted target)
· Key Support Level: $105,000 (psychological level)
· Next Resistance After Breakthrough: $110,000 (previous high area)
For participants in the prediction market, this technical pattern suggests a binary outcome leaning towards failure—similar to opening an overly leveraged long position. However, as the deadline approaches, external catalysts are likely to play a decisive role. It is advisable to closely monitor early signals of sustained breakthroughs, such as increasing volume and the ADX breaking above 20, while remaining vigilant for sudden news that could temporarily invalidate technical analysis.
免责声明:本文章仅代表作者个人观点,不代表本平台的立场和观点。本文章仅供信息分享,不构成对任何人的任何投资建议。用户与作者之间的任何争议,与本平台无关。如网页中刊载的文章或图片涉及侵权,请提供相关的权利证明和身份证明发送邮件到support@aicoin.com,本平台相关工作人员将会进行核查。


