Master Discusses Hot Topics:
Today, it is necessary to talk about the recent ETF, which continues to see net inflows lying flat. The data from the US market seems normal, but to be honest, the buying pressure on Bitcoin's spot market is quite low.
The market is stagnant, with prices hovering around 107K for almost ten days, unable to rise or fall. It hasn't deviated from the script; is it just dragging time to harvest patience?
So why did the ETF come? Wasn't it supposed to bring funds into the market? Now, the native funds in the crypto space are flowing into the ETF instead. What do you call this if not bloodsucking?
Americans used to see Bitcoin as a mysterious treasure, but now it has turned into this, with scammers everywhere and countless worthless coins. Previously, the crypto community was hopeful about continuous inflows from the US stock market, but what happened?
They came, played with the ETF, and then realized that the crypto space is like a gathering of scammers, turning around and leaving. This resulted in a high-level bloodletting, and it was all their own people being cut.
Isn't this ironic? Everyone thought the ETF was a good thing, but now looking back, it’s like poison. Money is flowing out of the crypto space, the ecosystem is inactive, and the spot market can't be pushed up… there are hardly any new catalysts for liquidation, so this market can only play short-term.
Looking at the monthly chart, Bitcoin previously retraced to 74K, which was a washout and accumulation. After that, it surged high and has been consolidating at high points.
In my opinion, as long as Bitcoin stabilizes above 109.5K, it is highly likely to continue rising, targeting a 30K point increase, which is not an exaggeration. Conversely, if it cannot break through 112K, then caution is warranted; this round of highs may be set here. I’ll give you the conclusion, but I still see more upside potential.
Why? Just look at the liquidation chart; there has hardly been any liquidation in the last 10 days. They tried to sweep the shorts, but as soon as they touched the edge, they got scared. When they tried to go long, they couldn't find a sufficiently dense liquidation area.
Do you understand what this means? It means that a long-awaited big volatility is very likely to happen next! Historical data shows that in such situations, there can be a 20% fluctuation, and most of the time, it is a strong upward movement.
In the current market, to put it bluntly, even the shorts are running out of ammunition, hoping for some bad news to save them. But the problem is, there isn't any significant negative news globally that could cause a crash, so where will the reinforcements come from? On the contrary, as long as there are no external disturbances, time will favor the bulls.
Right now, this is the rhythm of the bulls holding back their big moves, not asking for anything else, just hoping for some volatility. Even a piece of bad news would be good; after it crashes down, they can go long directly, at least there’s room for speculation! So now I’m waiting for the trend, waiting for a big wave, ready to jump in and weld the car door shut!
Master Looks at the Trend:
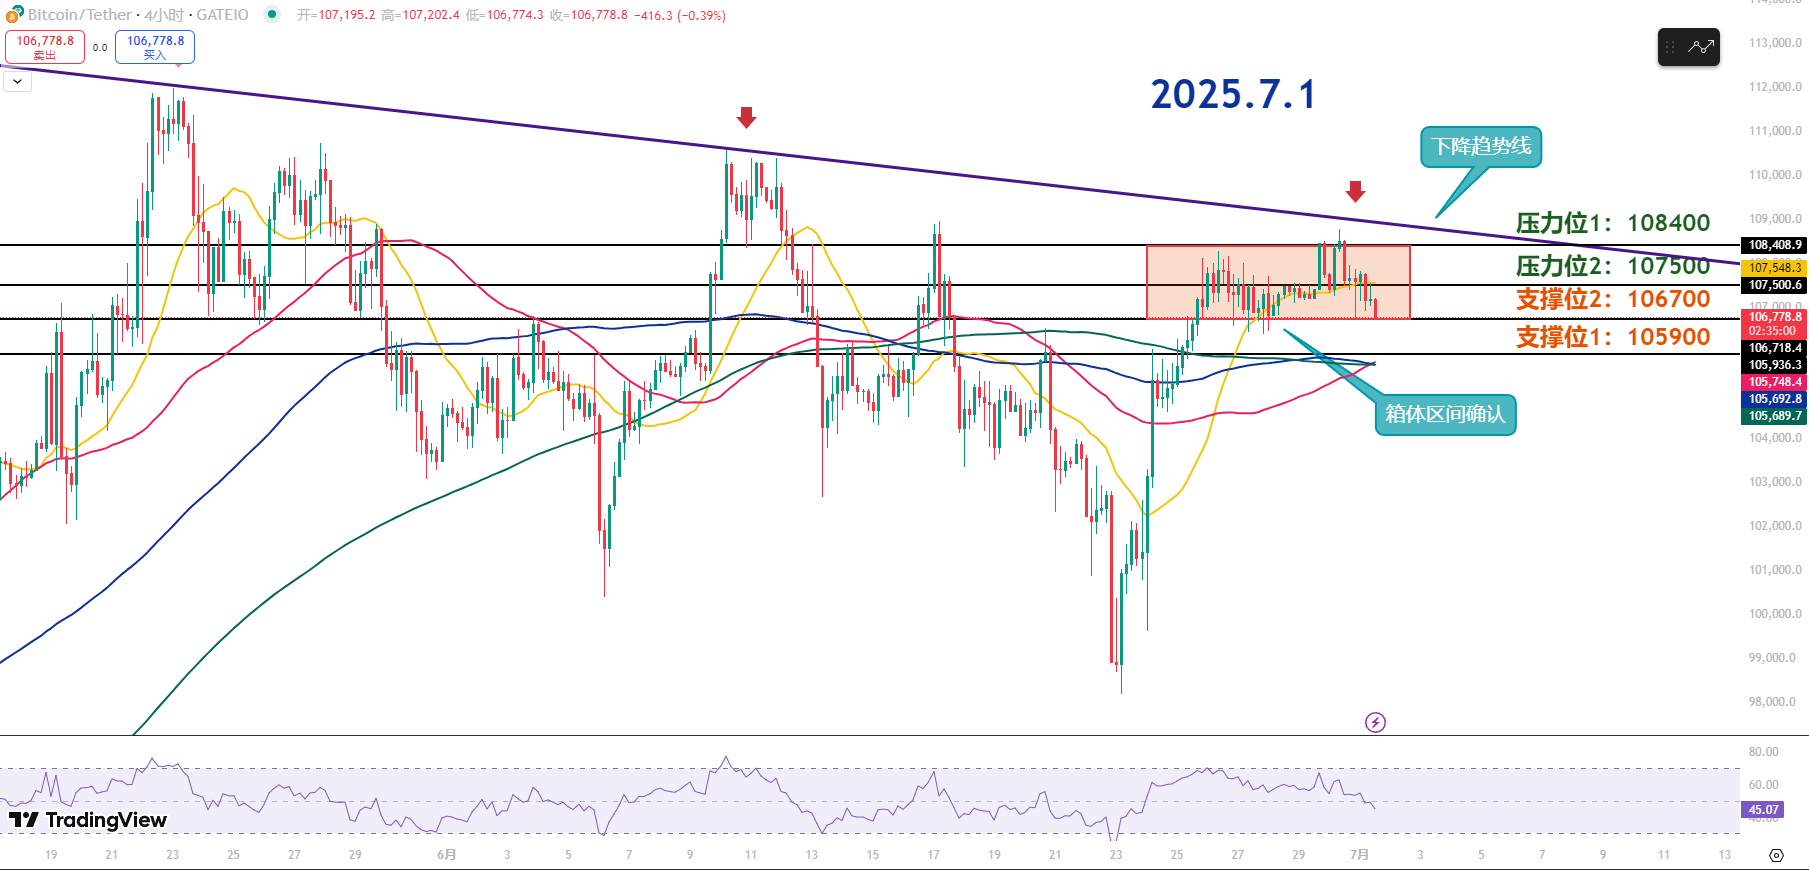
Resistance Levels Reference:
Second Resistance Level: 118400
First Resistance Level: 107500
Support Levels Reference:
Second Support Level: 106700
First Support Level: 105900
Currently, Bitcoin has still not effectively broken through the key downward trend line on the 4-hour chart. After the recent attempt to rise failed, the price has retraced.
The current price has fallen back into the previous range of fluctuations, with a focus on the range of 106.7K to 107.5K. Additionally, the RSI indicator continues to decline, indicating that there is still a risk of further retracement in the short term, approaching the oversold zone.
If the RSI shows a reversal signal and moves upward again, a short-term rebound may be expected. The key short-term support level is at 106.7K; if this level is broken, the retracement will accelerate.
If it can regain the first resistance at 107.5K, it will test the upper trend line again. If it successfully breaks the downward trend line and stabilizes in the 107.8K to 108K range, it can be seen as a trend reversal.
The current high points are gradually moving down, and without external positive stimuli, a significant rise is not optimistic. If it continues to fall, a phased low-buy strategy can be considered.
The first support at 106.7K is a key short-term support; once broken, attention should be paid to whether the price can quickly rebound. It is recommended to focus on the buying support in the range of 106.4K to 106.7K.
The maximum possible retracement space below can be seen around 106K, which is also where the 200-day and 120-day moving averages converge on the 4-hour chart.
Currently, it is in a stage of adjustment after a rise; if further retracement occurs, a very short-term low-buy layout can be made.
7.1 Master’s Wave Strategy:
Long Entry Reference: Buy in batches in the range of 105000-105900, Target: 107500-108400
Short Entry Reference: Sell in batches in the range of 108400-108800, Target: 107500-106700
If you truly want to learn something from a blogger, you need to keep following them, rather than making hasty conclusions after just a few market observations. This market is filled with performers; today they screenshot long positions, tomorrow they summarize short positions, making it seem like they "always catch the top and bottom," but in reality, it’s all hindsight. A truly worthy blogger will have a trading logic that is consistent, coherent, and withstands scrutiny, rather than jumping in only when the market moves. Don’t be blinded by flashy data and out-of-context screenshots; long-term observation and deep understanding are needed to discern who is a thinker and who is a dreamer!
This article is exclusively planned and published by Master Chen (WeChat public account: Coin God Master Chen). For more real-time investment strategies, solutions, spot trading, short, medium, and long-term contract trading techniques, operational skills, and knowledge about candlesticks, you can join Master Chen for learning and communication. A free experience group for fans has been opened, along with community live broadcasts and other quality experience projects!

Warm reminder: This article is only written by Master Chen on the official account (as shown above), and other advertisements at the end of the article and in the comments are unrelated to the author!! Please be cautious in distinguishing between true and false, thank you for reading.
免责声明:本文章仅代表作者个人观点,不代表本平台的立场和观点。本文章仅供信息分享,不构成对任何人的任何投资建议。用户与作者之间的任何争议,与本平台无关。如网页中刊载的文章或图片涉及侵权,请提供相关的权利证明和身份证明发送邮件到support@aicoin.com,本平台相关工作人员将会进行核查。


