This Week's Preview (6.30-7.6), Trump forecasts US-Iran talks; Non-farm payrolls to be announced early this week; BTC high-level fluctuations nearing a turning point window after two months!**
Table of Contents:
Large token unlock data for this week;
Overview of the crypto market, quick read on the weekly performance of popular coins/fund flows in sectors;
Bitcoin spot ETF dynamics;
BTC liquidation map data interpretation;
Key macro events this week and important forecasts and interpretations for the crypto market.
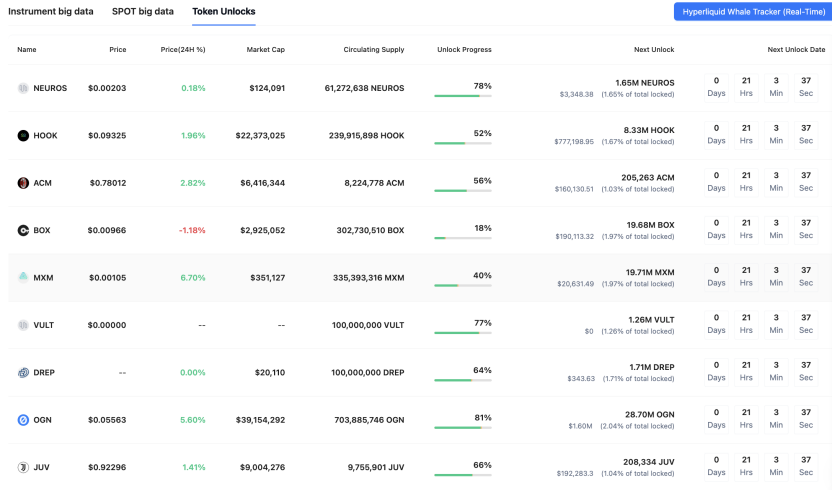
1. Large token unlock data for this week;
Coinank data shows that this week, tokens such as SUI, ENA, and DYDX will experience significant unlocks. The following are the UTC+8 times:
Sui (SUI) will unlock 44 million tokens at 8:00 on July 1, valued at approximately $127 million, accounting for 1.3% of the circulating supply;
Ethena (ENA) will unlock 40.63 million tokens at 15:00 on July 2, valued at approximately $11.29 million, accounting for 0.67% of the circulating supply;
dydx (DYDX) will unlock 4.17 million tokens at 8:00 on July 1, valued at approximately $2.25 million, accounting for 0.56% of the circulating supply;
EigenCloud (EIGEN) will unlock 1.29 million tokens at 23:00 on July 1, valued at approximately $1.57 million, accounting for 0.41% of the circulating supply.
We believe that the large unlock events for tokens such as SUI, ENA, DYDX, and EIGEN this week, while routine market operations, should be approached with caution regarding their potential impact. Token unlocks are typically seen as bearish factors, as early investors or team members may sell to cash out, increasing market supply and triggering short-term downward price pressure; especially in a high-volatility environment, such events can amplify market sentiment fluctuations, leading to liquidity tightening. However, the unlock ratios this time are generally low, with a maximum of 1.3% and a minimum of 0.41% of the circulating supply. Historical data shows that small unlocks have limited overall market impact, often buffered by project fundamentals or external factors.
As a leader in decentralized derivatives, DYDX has shown strong performance in its independent chain ecosystem, with a high staking rate and a revenue distribution mechanism shifting towards community token holders, which may enhance long-term confidence and partially offset unlock pressure. In contrast, while SUI is positioned as a high-performance public chain, the unlock value is relatively high (approximately $127 million), necessitating attention to market absorption capacity; ENA and EIGEN have smaller unlock scales, and their impact may be weaker. We recommend that investors prioritize examining project technological progress and ecosystem health rather than short-term events. In the current market environment, unlock events may trigger localized volatility, but systemic risks are controllable, and robust projects like DYDX are expected to demonstrate resilience.
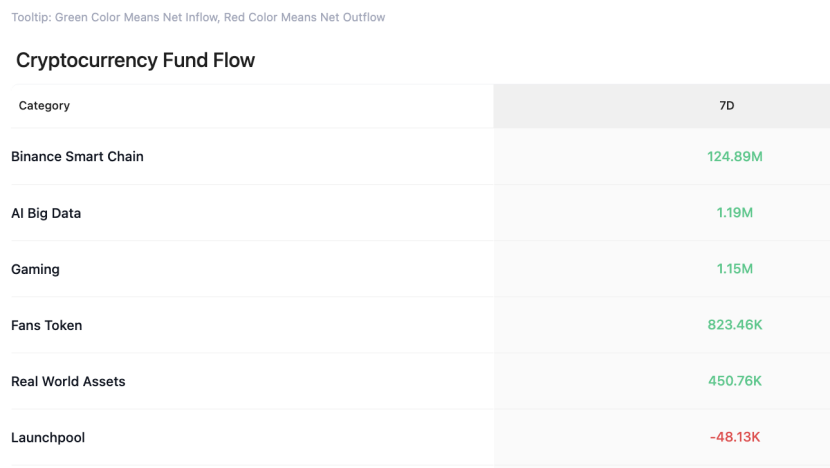
2. Overview of the crypto market, quick read on the weekly performance of popular coins/fund flows
CoinAnk data shows that in the past week, the crypto market, categorized by concept sectors, only saw net inflows in Binance Smart Chain, AI big data, gaming sectors, fan tokens, and RWA, while Launchpool experienced a small outflow.
In the past 7 days, the top gainers among coins (selected from the top 500 by market cap) include ESX, CTK, PENGU, MOVE, SEI, and MOG, which should continue to be prioritized for trading opportunities this week.
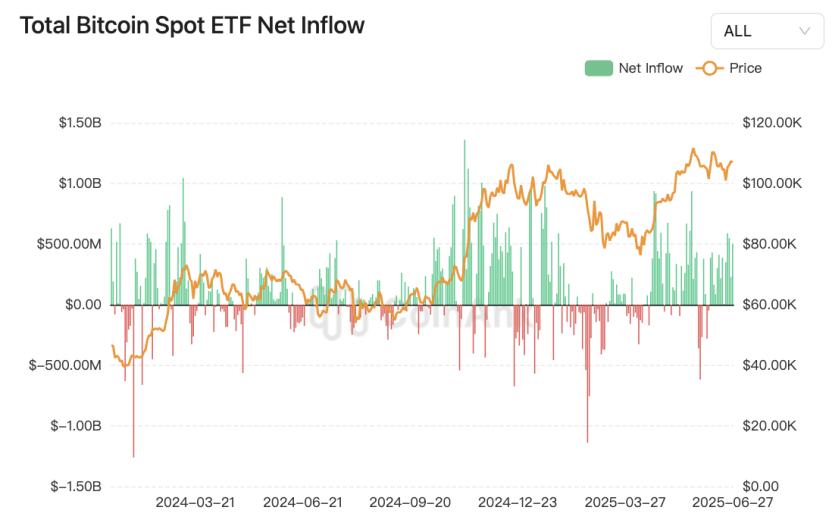
3. Bitcoin spot ETF fund dynamics.
CoinAnk data shows that last week, Bitcoin spot ETFs had a net inflow of $2.22 billion, marking three consecutive weeks of net inflows. The Bitcoin spot ETF with the highest net inflow last week was Blackrock's Bitcoin ETF IBIT, with a weekly net inflow of $1.31 billion, bringing the historical total net inflow for IBIT to $52.31 billion. The Bitcoin spot ETF with the highest net outflow last week was Grayscale's ETF GBTC, with a net outflow of $5.69 million, bringing the historical total net outflow for GBTC to $23.25 billion.
We believe this reflects a sustained increase in institutional investors' interest in Bitcoin, supporting Bitcoin's positioning as a speculative asset, with inflows primarily driven by expectations of high returns rather than actual payment uses. The overall net inflow indicates solid market confidence, which may boost Bitcoin demand and stabilize prices, while the outflow from GBTC highlights profit-taking behavior among some investors. For the crypto market, especially BTC, this reinforces its role as a diversified investment tool, potentially driving short-term price increases. Although the market is subject to fluctuations (for example, a net outflow of $2.61 billion was observed in February 2025), the ongoing trend of net inflows suggests that the Bitcoin market is becoming more efficient, with institutional participation accelerating this process. However, historical data warns of high volatility risks, and investors should pay attention to fund flows and changes in market sentiment.
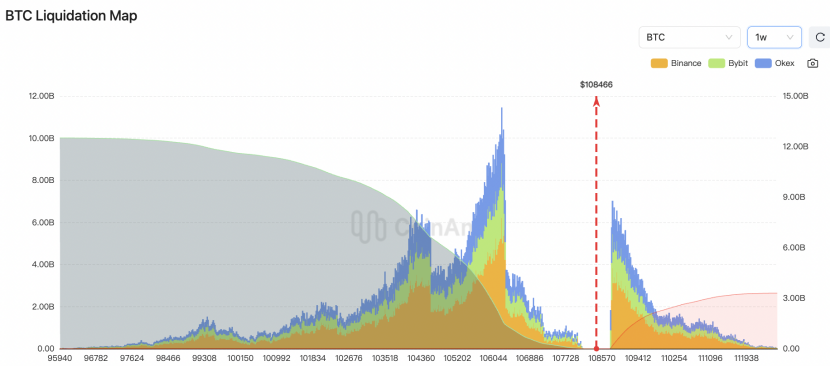
4. BTC liquidation map data.
CoinAnk liquidation map data shows that if BTC breaks through $112,000, creating a new historical high, the cumulative short liquidation intensity on mainstream CEXs will reach $3.27 billion. Conversely, if Bitcoin falls below $104,500, the cumulative long liquidation intensity on mainstream CEXs will reach $6.75 billion.
Considering that BTC has been fluctuating at high levels around $100,000 to $110,000 for nearly two months, it is approaching a turning point window.
We believe that liquidation intensity is not the actual amount to be liquidated but rather a measure of the potential severity of market liquidity shocks after price levels are reached, based on the density of adjacent liquidation clusters. Current data indicates that if BTC breaks through $112,000 to create a new historical high, the $3.27 billion short liquidation intensity may trigger a "short squeeze" effect—where a large number of shorts are forced to close their positions, accelerating buying pressure and creating a positive feedback loop that drives prices up, consistent with historical market behavior when breaking through key resistance levels. Conversely, if it falls below $104,500, the $6.75 billion long liquidation intensity exposes the vulnerability of highly leveraged long positions, potentially triggering a "long kill long" chain reaction, leading to panic selling and amplifying short-term downside risks, highlighting extreme market speculation at critical price levels. Overall, this threshold range reflects a deep standoff between bulls and bears, and investors should be cautious of market volatility triggered by liquidity waves, managing leverage appropriately to avoid cascading risks.
5. Key macro events this week and important forecasts and interpretations for the crypto market.
CoinAnk data shows:
On June 30, Monday, US June Chicago PMI; Binance wallet launches exclusive TGE for NodeOps (NODE);
On July 1, Tuesday, US June S&P Global Manufacturing PMI final value; US June ISM Manufacturing PMI, May JOLTs job openings, May construction spending month-on-month;
On July 2, Wednesday, US June ADP employment numbers;
On July 3, Thursday, US initial jobless claims for the week ending June 21, May trade balance; US June non-farm payroll report and June unemployment rate will be announced early;
On July 4, Friday, US June S&P Global Services PMI final value; US June ISM Non-Manufacturing PMI, May factory orders month-on-month; Musk: Grok 4 is expected to be released after July 4.
From June 30 to July 6, many Federal Reserve officials will speak; Trump forecasts US-Iran talks this week.
We believe that the June Chicago PMI and the July 1 ISM Manufacturing PMI form a leading indicator combination, and caution is warranted regarding signals of "temporary improvement" in manufacturing. If the data exceeds expectations, it may confirm a production recovery driven by supply chain repairs; if it falls below expectations, it will reinforce concerns about stagflation. The services PMI (July 4) requires particular attention, as historical data shows that unexpected contractions have led to significant market volatility, and the current services sector contributes significantly to inflation stickiness.
The structural contradictions in the labor market deepen: considering JOLTs job openings and ADP employment together: if job openings continue to exceed unemployment numbers (currently at a ratio of 1.2), it will highlight mismatches in the labor market. Special attention should be paid to the risk of occupational mismatches among highly educated groups, as well as the abnormality of "no vacancy recruitment" exceeding 16%. The early announcement of non-farm data may signal volatility risks, necessitating a focus on wage growth's impact on Federal Reserve policy.
Trump's forecast of US-Iran talks, combined with the intensive speeches from Federal Reserve officials, may amplify market sensitivity. Historical data indicates that political cycles can distort the interpretation of economic data, and if geopolitical conflicts drive up oil prices, it will intensify cost pressures in the services sector. Technological events (such as the release of Grok 4) may serve as a risk appetite adjustment valve, but caution is needed regarding liquidity siphoning effects.
The core contradiction lies in the scenario where manufacturing PMI strengthens but services PMI declines, combined with non-farm wage growth exceeding expectations, which may force the Federal Reserve to maintain a hawkish stance during the political cycle, exacerbating the "tightening-recession" expectation game. It is recommended to use a dynamic mismatch model to track cross-sector data divergences, being wary of the combination risk of "high vacancy rates + low turnover rates" in the job market.
In the short term (the data-intensive period will amplify volatility), if non-farm payrolls exceed 200,000 or ISM services PMI > 55, it may trigger "hawkish panic" causing BTC to test key support; conversely, if employment weakens (ADP < 150,000), it will boost expectations for interest rate cuts, pushing prices higher. Mid-term trends indicate that institutional entry still provides support, but tariff policies and geopolitical variables such as US-Iran talks may become new sources of disturbance. BTC may exhibit high volatility this week, and it is advisable to pay attention to market pricing changes regarding the Federal Reserve's September rate cut probabilities before and after the non-farm announcement, as this will be a key catalyst for directional choices.
免责声明:本文章仅代表作者个人观点,不代表本平台的立场和观点。本文章仅供信息分享,不构成对任何人的任何投资建议。用户与作者之间的任何争议,与本平台无关。如网页中刊载的文章或图片涉及侵权,请提供相关的权利证明和身份证明发送邮件到support@aicoin.com,本平台相关工作人员将会进行核查。