Cryptocurrency News
June 27 Hot Topics:
1. DWF Labs partner: Launching a crypto asset collateral lending service platform Nex meta
2. Bakkt submits a $1 billion fundraising plan, intending to invest part of the funds in Bitcoin and other digital assets
3. Reuters: The tokenized stock trading platform Dinari is the first to receive U.S. approval to offer tokenized stocks
4. World Liberty, associated with Trump, sold $100 million worth of WLFI tokens to a UAE fund
5. White House digital asset policy advisor: The U.S. is working on building strategic Bitcoin reserve infrastructure
Trading Insights
After years in the cryptocurrency space, I have summarized 5 short-term trading insights! Understand them to easily grasp market rhythms!
Consolidation Phase: Be patient for signals, don’t be reckless
When the price fluctuates at high or low levels, don’t rush to act! Consolidation at high levels often hides opportunities for new highs, while hovering at low levels may brew a new round of declines. Like a hunter, lie in wait until the market clarifies its direction before decisively striking.Sideways Phase: Keep your hands off, cash is king
The sideways period is a "disaster zone" for retail investors! 90% of ineffective trades occur during this time. Remember, not trading is the best strategy; patiently wait for the market to break the deadlock before entering gracefully.Rebound Prediction: See through the downward force, accurately catch the rebound
A decline is like a ball hitting the ground; the harder it falls, the stronger the rebound! By observing the speed and intensity of the decline, predict the strength of the rebound, and accurately grasp the upward point like a surfing expert.Positioning Strategy: Pyramid-style phased entry to manage risk
Trading experts understand "phased planting"! Using a pyramid positioning method, start with a small amount to test, then gradually increase, which can lower costs and diversify risks, solidifying the foundation of trading.End of Trend: Wait for reversal signals, don’t be a bag holder
After significant rises or falls, don’t rush to act! Don’t chase highs at elevated levels or bottom fish at low levels; patiently wait for clear trend reversal signals to seize the best exit opportunity.
Remember: Patience > Skill, Stability > Aggression!
LIFE IS LIKE
A JOURNEY ▲
Below are the real trading signals from the Big White Community this week. Congratulations to the friends who followed along; if your trades are not going well, you can come and test the waters.
Data is real, and each trade has a screenshot from the time it was sent.
**Search for the public account: *Big White Talks Coins*
BTC
Analysis
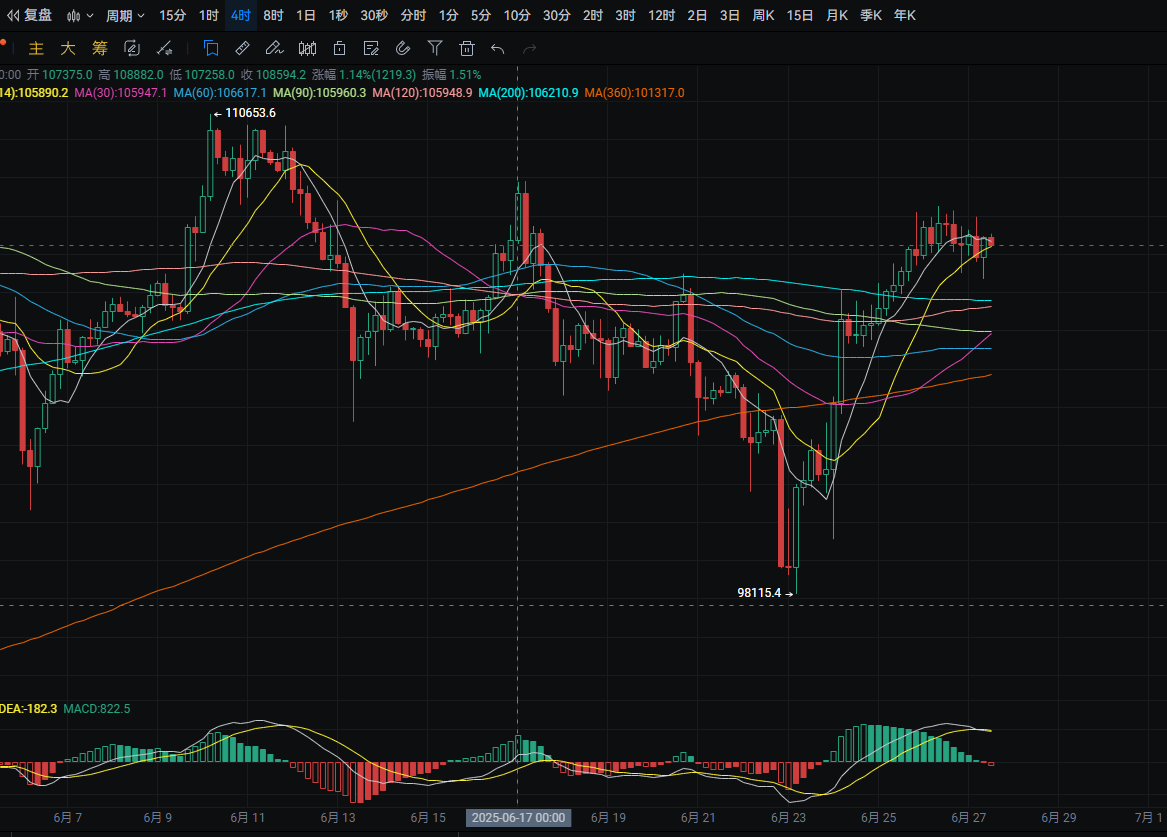
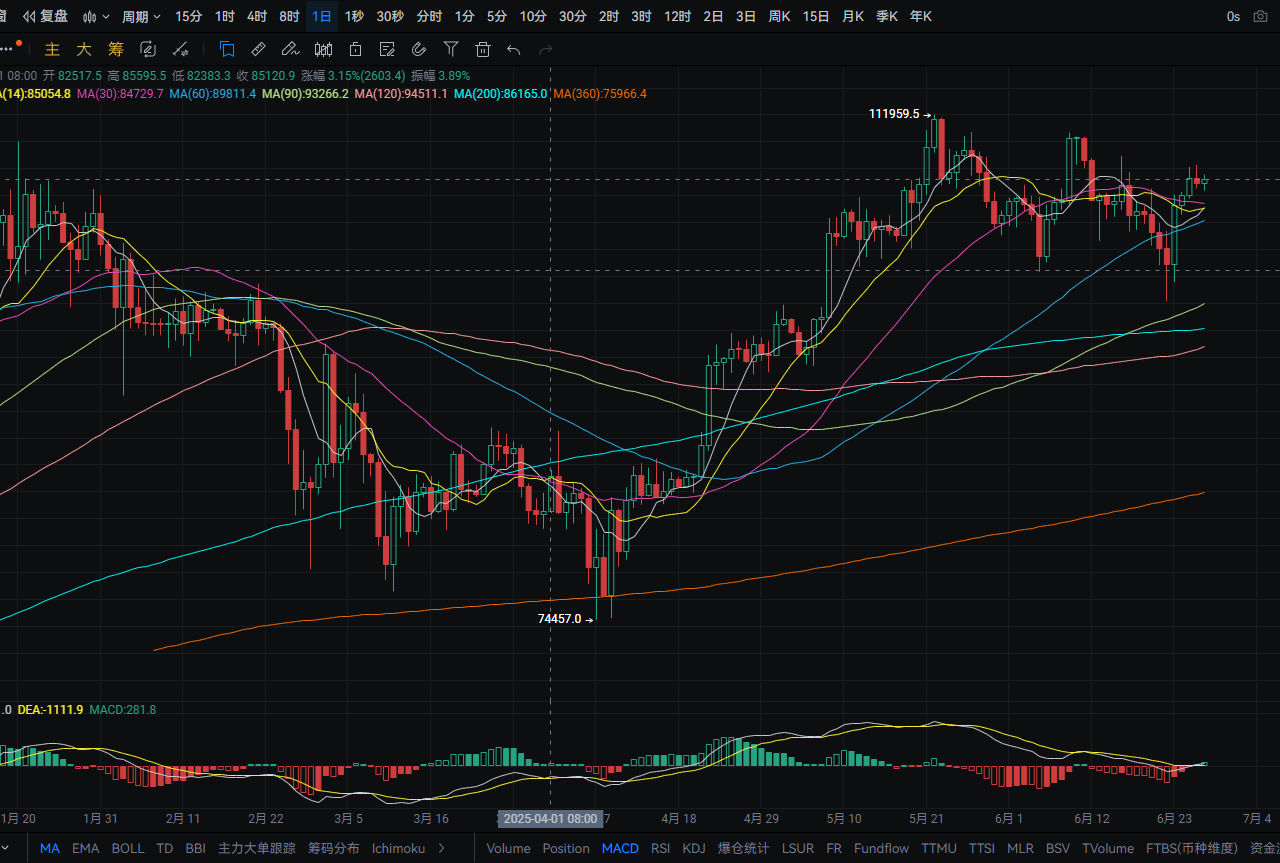
Bitcoin's daily line fell from a high of around 108250 to a low of around 106500 yesterday, closing around 106900. The support level is near MA14; if it breaks, it could drop to around 103000. A pullback can be used to enter long positions nearby. The resistance level is around 109000; if it breaks, it could rise to around 110700. A rebound to nearby levels can be used to enter short positions. The MACD shows increasing bullish momentum, forming a golden cross. The four-hour support level is around 106100; if it breaks, it could drop to near MA90. A pullback can be used to enter long positions nearby. The resistance level is around 107950; if it breaks, it could rise to around 109150. A rebound to nearby levels can be used to enter short positions. The MACD shows decreasing bullish momentum and has signs of forming a death cross.
ETH
Analysis
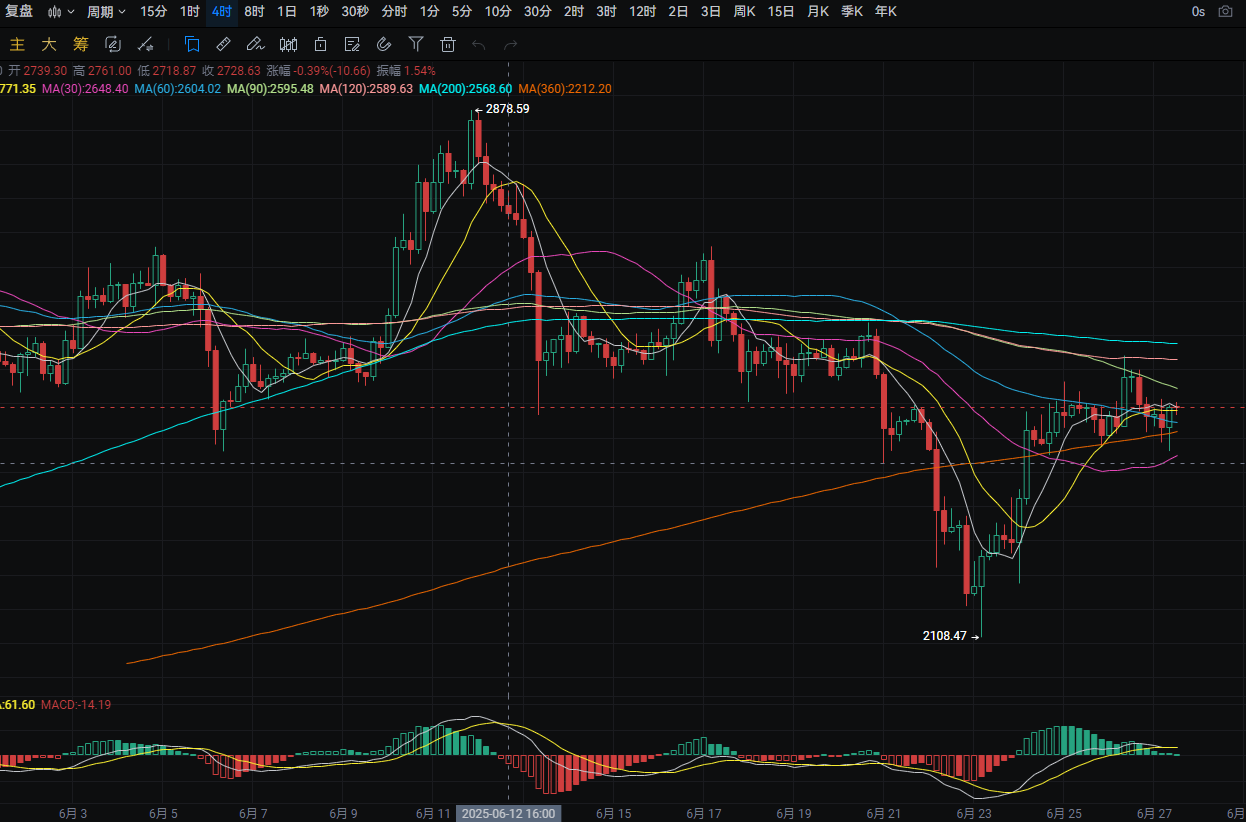
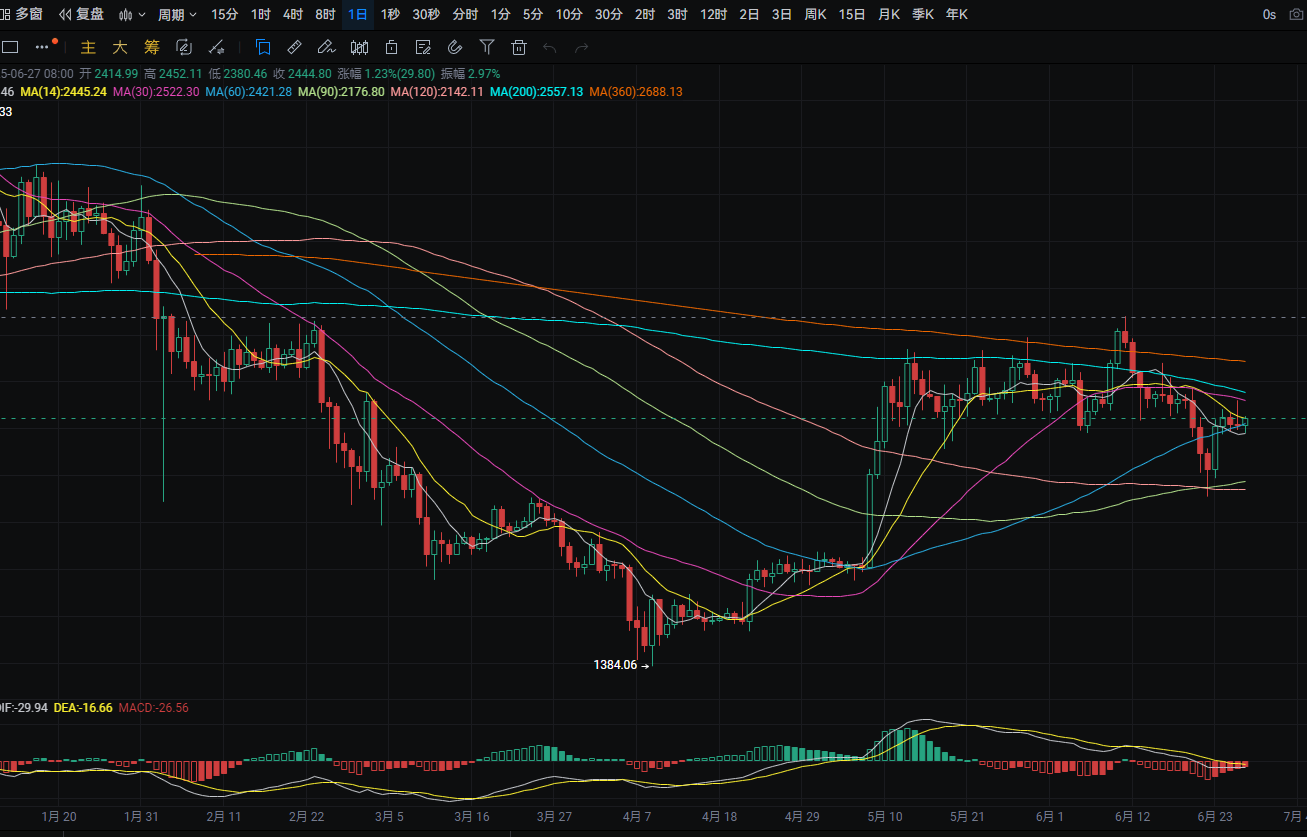
Ethereum's daily line fell from a high of around 2520 to a low of around 2395 yesterday, closing around 2415. The support level is around 2350; if it breaks, it could drop to near MA90. A pullback can be used to enter long positions nearby. The resistance level is around MA30; if it breaks, it could rise to around 2615. A rebound to nearby levels can be used to enter short positions. The MACD shows decreasing bearish momentum. The four-hour support level is around MA360; if it breaks, it could drop to near MA30. A pullback can be used to enter long positions nearby. The resistance level is around MA90; if it breaks, it could rise to around MA120. A rebound to nearby levels can be used to enter short positions. The MACD shows decreasing bullish momentum and has signs of forming a death cross.
Disclaimer: The above content is personal opinion and for reference only! It does not constitute specific operational advice and does not bear legal responsibility. Market conditions change rapidly, and the article has a certain lag; if you have any questions, feel free to consult.
免责声明:本文章仅代表作者个人观点,不代表本平台的立场和观点。本文章仅供信息分享,不构成对任何人的任何投资建议。用户与作者之间的任何争议,与本平台无关。如网页中刊载的文章或图片涉及侵权,请提供相关的权利证明和身份证明发送邮件到support@aicoin.com,本平台相关工作人员将会进行核查。


