After weeks of false starts and sideways grinding, XRP has finally displayed meaningful life on the chart, posting a strong rebound and possibly paving the way for a more widespread reversal. As of press time, XRP had risen by almost 5% for the day, surpassing local resistance and setting up a breakout above the 50 EMA and the 100 EMA, two crucial moving averages.
This newfound vigor follows a triple test of the 200 EMA, which remained a solid support level close to $2.10. The strength of each bounce has increased, indicating seller fatigue and rising buyer interest. Now that volume is increasing and the RSI is approaching bullish territory (it is currently at about 52), XRP is ready for an upward continuation if momentum continues.
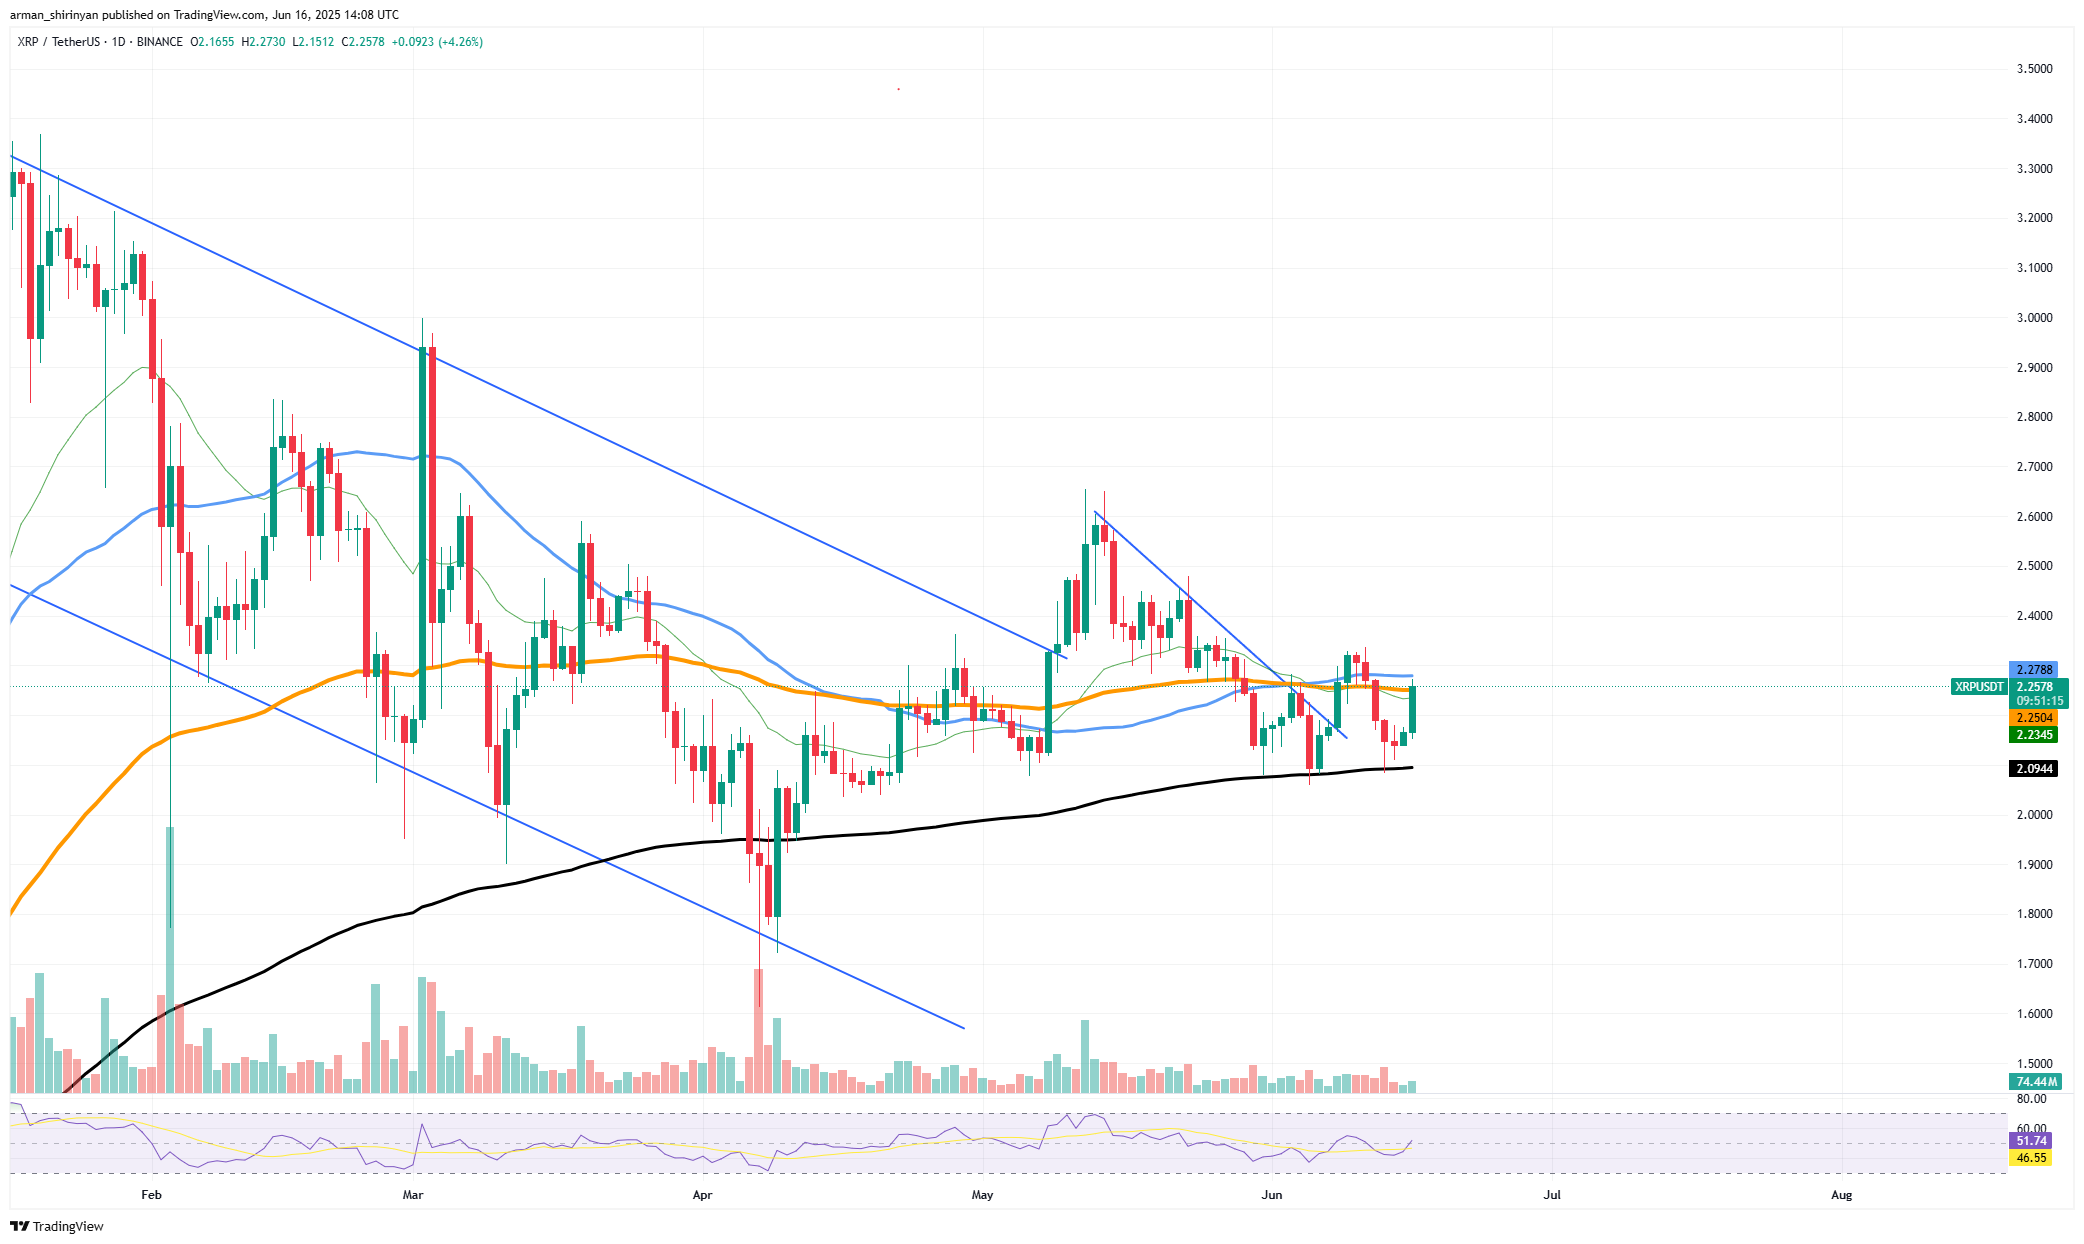
XRP/USDT Chart by TradingView
A close above the area where the 50 and 100 EMAs converge, which is situated squarely between $2.25 and $2.28, would be the most noteworthy technical milestone. A push toward the $2.50-$2.60 range, which is home to a cluster of previous rejection wicks, might be possible if that zone were decisively reclaimed. This would change the short- to medium-term structure to bullish.
HOT Stories Ripple and SEC Want to Keep Appeals on Hold XRP Comes Alive in Key Reversal, Bitcoin (BTC) Gaining Peak Momentum, Solana (SOL): Head and Shoulders? JPMD: JPMorgan Files Cryptocurrency Trademark XRP Holders Just Got the Crucial Date They’ve Been Waiting For
Additionally, the neckline of a larger ascending triangle that has been in place since April is a structurally significant area where this bounce occurs. If validated, that pattern points to XRP's long-term reversal thesis and may signal the start of a fresh upward trend, which bulls have been craving in the wake of Bitcoin's hegemony. Even though XRP is still in the woods, its pulse is more robust than it has been in weeks.
Bitcoin: Things heating up
Bitcoin is once again heating up, and it is showing indications that a move toward its all-time high (ATH) may be imminent if and only if it can overcome the final technical barrier, which is the descending trendline that has capped all of the recent highs. BTC is currently trading above $106,000, maintaining a strong hold above the 20 and 50-day key short-term EMAs and gaining steady momentum.
Since the last decline to $103,000, the price action has been volatile but bullish forming a string of higher lows. As a bullish indication that the underlying trend is still in favor of buyers, the 50 EMA keeps serving as dynamic support. Before entering overbought territory, the RSI has plenty of room to expand as it stays in the neutral zone (~53).
You Might Also Like

Mon, 06/16/2025 - 13:36 Bitcoin (BTC) Price Prediction for June 16 ByDenys Serhiichuk
Because of the obvious descending trendline that is just above the current price range, this is not yet a full-blown breakout. This line, which was taken from the peak in early June close to $112,000, has established a ceiling that Bitcoin has precisely adhered to. Until this trendline is decisively broken, the market might stay choppy, stalling at around $110,000. The structure, however, is leaning bullish.
The combination of rising support levels and consolidation below resistance creates a classic continuation pattern known as an ascending triangle. There is not much technically left to stop a retest of ATH territory and beyond if Bitcoin can break above $110,000 and hold. Although the tapering volume may cause some concern, a spike in trading activity as the price presses against the descending line could support the breakout scenario.
Is Solana ready?
Solana's chart is starting to resemble the classic head and shoulders (H&S) pattern, which is frequently linked to bearish breakdowns and trend reversals. This could be a warning to bullish traders. The structure is starting to become apparent even though the market has not confirmed the setup yet.
According to the chart, SOL reached its peak in late May at about $170 (the head) with two lower highs at about $160 forming the shoulders on either side. The $145-$147 range, which has served as support several times over the past month, seems to be the neckline's current range. If SOL breaks below that neckline with significant volume, we may witness a more severe short-term retracement down toward the $125-$130 range. The H&S pattern is typically a bearish reversal signal.
You Might Also Like

Sun, 06/15/2025 - 13:50 Solana (SOL) Key Support at Risk: Is $100 Next Stop? ByTomiwabold Olajide
The upside potential appears limited for the time being unless bulls can mount a strong surge, as SOL has had difficulty breaking above the 100 and 200 EMAs. They are currently at $157 and $161, respectively. It is not finalized, though. If buyers are able to invalidate the neckline breach and force SOL past $162, the entire formation may be scrapped because the right shoulder is still developing.
In that case, Solana would return to its bullish stance, targeting a retest of $170 and perhaps higher. Volume is still a crucial component that is lacking; thus far there has not been a clear volume spike that would indicate a breakout or a breakdown. The RSI is neutral with a slight bearish inclination hovering just below 50.
免责声明:本文章仅代表作者个人观点,不代表本平台的立场和观点。本文章仅供信息分享,不构成对任何人的任何投资建议。用户与作者之间的任何争议,与本平台无关。如网页中刊载的文章或图片涉及侵权,请提供相关的权利证明和身份证明发送邮件到support@aicoin.com,本平台相关工作人员将会进行核查。


