A simple life brings ease and happiness, simple desires bring peace and tranquility. Simple familial love brings warmth and happiness, simple friendship brings comfort and contentment. It is because of simplicity that we deeply understand the lightness of life. It is because of simplicity that we gain insight into the stillness of the soul. Simplicity is the beautiful form that life leaves for this world. We yearn for all things simple; simplicity is actually quite good!
The weekend is expected to show a generally oscillating trend, and according to our analysis of the market on Friday, there are no issues. The expected operation is to oscillate within the range of 103500-106500. During the weekend, operating within this range can also yield some profits. The weekend market is not very active, and there isn't much worth paying attention to. Today marks the beginning of a new week, and we need to maintain a higher level of attention to the market to respond to any potential changes in market trends.
Returning to the market, from the liquidity distribution chart, after a period of oscillation, there is currently a large accumulation of liquidity for both bears above and bulls below. From the perspective of liquidation intensity, if the market rises above 108000, it will complete the liquidation of the current bears, and if it falls to 102000, it will complete the liquidation of the current bulls. Combining the liquidation distribution, this week we will focus on the range of 102000-108000. If either side completes liquidation in the subsequent market, there will be a reversal after liquidation in the short term, meaning that after the liquidation of bears, there will also be a reversal to liquidate bulls, and vice versa.
On the technical front, the weekly chart has formed a doji star, and structurally, the weekly candlestick is in a continuous oscillating arrangement. However, it is important to note that the coin price is operating near the short-term moving average MA7, which will determine a short-term strength trend. Meanwhile, on the MACD, the top divergence at the weekly level is becoming increasingly apparent. In the short term, it seems difficult for the market to offset this top divergence through a strong rally, so we can only wait for the market to operate normally and fulfill the expected pullback from the top divergence. The RSI is still operating at a high level, indicating a potential for indicator pullback correction. The bearish expectation at the weekly level is quite clear in the market structure, and we need to pay attention to when the pullback expectation will arrive.
On the daily level, the market is oscillating back and forth, with a secondary high point above 110000. This provides a reference: if the market is to form a strong bullish trend, the secondary high point above 110000 must be broken; otherwise, if the subsequent oscillation pulls back, the head and shoulders pattern structure will lead to a significant pullback expectation. Additionally, we still agree with last week's viewpoint: we do not discuss entering a bear market above 93500, and we do not discuss a strong bull market until we break 120000. From the technical indicators, the daily MACD actually has a bullish expectation of a golden cross, but if the market oscillates for a longer period, the two lines of the MACD entangled at the zero axis will greatly affect the bullish energy, making it difficult to achieve bullish expectations.
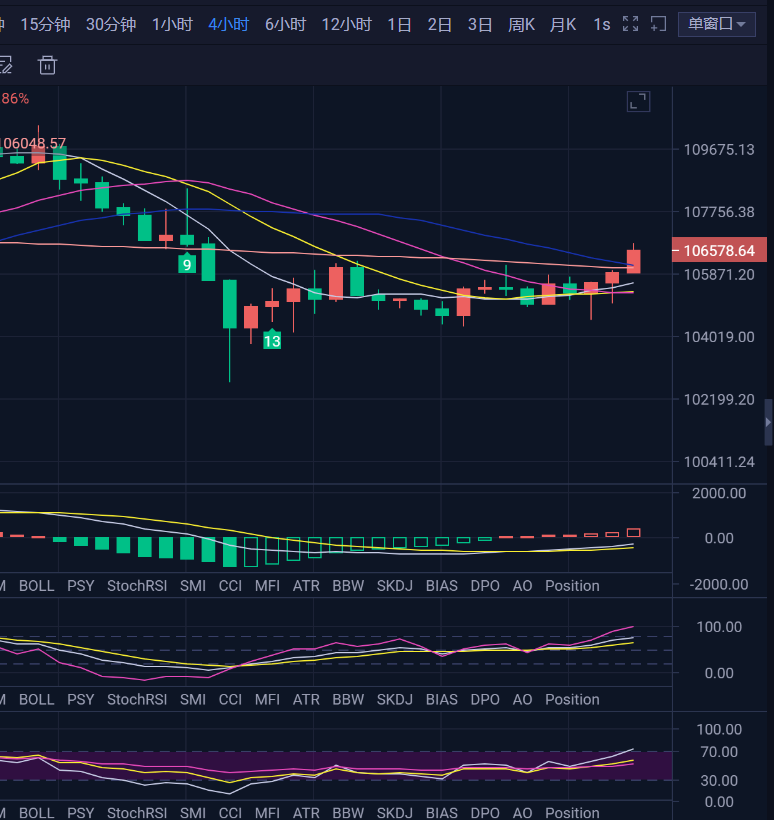
On the four-hour level, after oscillation, there are signs of upward movement, and it is in a bullish arrangement. However, the current bullish strength on the four-hour chart is not very strong, and the technical indicators maintain a bullish upward trend. Overall, combining the liquidation distribution and technical chart, for the upcoming market, we will first look for a rebound. If it can reach the bearish liquidation position at 108000, then performing a reversal operation would be very perfect.
For operations, considering a larger range, we will wait to short near 108000 and long near 102000. This operational expectation remains unchanged for this week. In the short term, there may still be some oscillation, and for ultra-short-term opportunities, we will see if there are any rapid market movements to operate in real-time.
Recently, Ethereum's volatility has actually been higher than Bitcoin's. The more this is the case, the greater our expectations for Ethereum's potential "doomsday chariot" market. Operations should still be conducted in line with Bitcoin's trend while also engaging in Ethereum operations. For shorting, consider participating near 2750, and for longing, consider near 2300.
【The above analysis and strategies are for reference only. Please bear the risks yourself. The article is subject to review and publication, and real-time market changes may lead to delayed information. Specific operations should be based on real-time strategies. Feel free to contact us for market discussions.】

免责声明:本文章仅代表作者个人观点,不代表本平台的立场和观点。本文章仅供信息分享,不构成对任何人的任何投资建议。用户与作者之间的任何争议,与本平台无关。如网页中刊载的文章或图片涉及侵权,请提供相关的权利证明和身份证明发送邮件到support@aicoin.com,本平台相关工作人员将会进行核查。