From May 27 to June 9, 2025, BTC fluctuated between 100,000 and 110,000 USDT, with relatively mild volatility; ETH, on the other hand, struggled to reach new highs and exhibited erratic movements, with a cautious attitude from investors. The amount of BTC held slightly decreased, while ETH remained at a high level, indicating a divergence in capital allocation; BTC's funding rate experienced significant fluctuations, reflecting an increase in short-term market disagreements. On June 5, a dispute between Musk and Trump triggered panic, causing both Tesla and Bitcoin to drop, with liquidations across the network approaching 1 billion dollars. In terms of quantitative strategies, the XRP trend breakout strategy achieved an annualized return of over 240%, demonstrating robust performance.
Introduction
This quantitative biweekly report (from May 27 to June 9, 2025) focuses on the market performance of Bitcoin and Ethereum, systematically analyzing key indicators such as long-short ratios, contract positions, and funding rates to quantitatively interpret the overall market situation. This issue's quantitative strategy module emphasizes the practical application of the "moving average trend breakout strategy" among the top ten cryptocurrency projects by market capitalization (excluding stablecoins), systematically explaining its strategy logic, signal determination mechanism, and execution process. Through parameter optimization and historical backtesting, the strategy has shown good stability and execution discipline in trend identification and risk control. Compared to simply holding BTC and ETH, this strategy performs better in terms of enhancing returns and controlling drawdowns, providing a practical reference framework for quantitative trading.
Summary
Market Overview
To systematically present the current capital behavior and trading structure changes in the cryptocurrency market, this report examines five key dimensions: the price volatility of Bitcoin and Ethereum, long-short trading ratio (LSR), contract positions, funding rates, and market liquidation data. These five indicators encompass price trends, capital sentiment, and risk conditions, providing a comprehensive reflection of the current market's trading intensity and structural characteristics. The following is an analysis of the latest changes in each indicator since May 27:
- Analysis of Price Volatility of Bitcoin (BTC) and Ethereum (ETH)
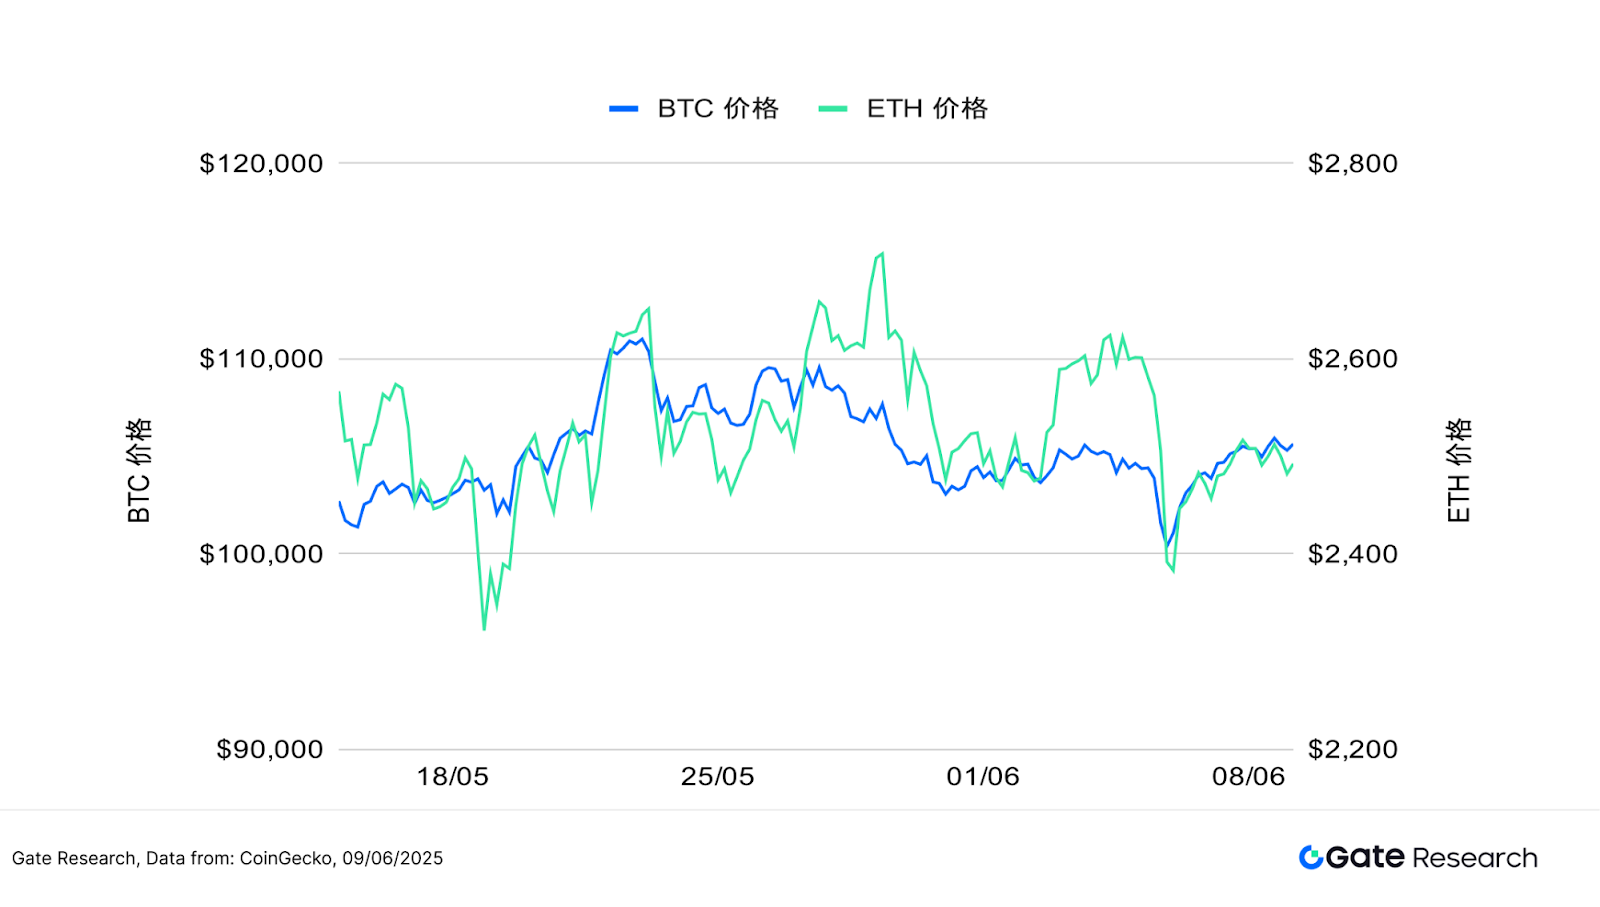
According to CoinGecko data, BTC has steadily fluctuated within the 100,000 to 110,000 USDT range over the past two weeks, with small fluctuations and a stable price structure, demonstrating strong resilience; in contrast, ETH has repeatedly surged to 2,600 USDT before quickly retreating, showing insufficient upward momentum and erratic movements, with a cautious capital attitude. Since successfully stabilizing above 105,000 USDT at the end of May, BTC has experienced some pullbacks but has not broken key support, maintaining an upward structure with good overall momentum continuity; conversely, ETH lacks volume support, facing selling pressure after surges, with a clear divergence in MACD momentum, intensifying short-term tug-of-war between bulls and bears.
The Federal Reserve released hawkish signals in the FOMC meeting minutes on May 28. Although it has paused interest rate hikes for the third consecutive time, officials are generally concerned about persistent inflation, with core PCE at 2.6%, and inflation may not gradually decline until 2027. At the same time, GDP growth expectations were lowered, and unemployment rates were raised, reflecting an increased risk of economic recession, with market expectations for short-term rate cuts significantly cooling.
Overall, BTC has garnered more capital favor, demonstrating greater resilience during structural adjustments; ETH, constrained by themes and insufficient momentum, shows relatively weak performance. It is recommended to continue monitoring the Federal Reserve's June interest rate meeting, the inflow of Bitcoin spot ETFs, and whether the Ethereum Layer 2 ecosystem can reactivate market enthusiasm.
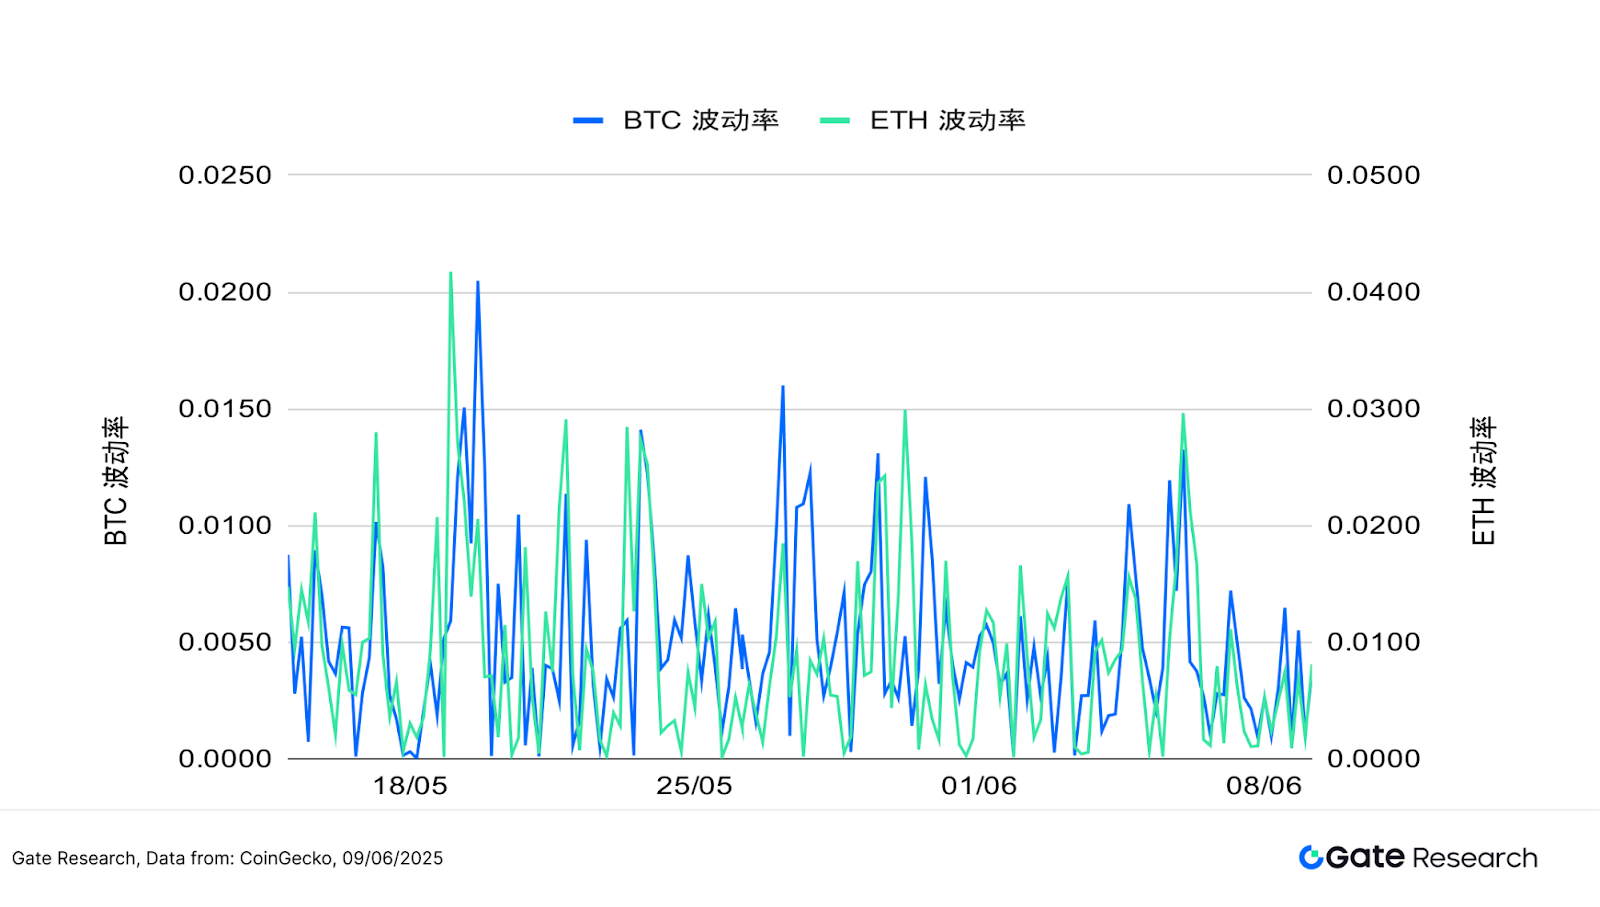
In terms of volatility, ETH's volatility is significantly higher than BTC's, indicating that its price is more susceptible to short-term capital movements and emotional influences. ETH has experienced severe fluctuations on multiple trading days, especially during local market rebounds and pullbacks, with volatility rapidly increasing, reflecting intense market competition and frequent capital inflows and outflows.
In contrast, BTC's volatility distribution is more balanced, lacking significant peaks, demonstrating stronger price stability and structural support. In a market lacking a clear trend, BTC's low volatility characteristic indicates more robust capital allocation, while ETH, due to a lack of sustained thematic support, experiences concentrated short-term fluctuations that are easily driven by news.
In the past two weeks, BTC and ETH have shown significant divergence. BTC has steadily fluctuated with mild volatility, demonstrating strong resilience and capital support; in contrast, ETH lacks sustained momentum, struggles to reach new highs, and exhibits erratic movements, with a cautious capital attitude. On the macro front, the Federal Reserve's meeting minutes are hawkish, suppressing market expectations for short-term easing and further reinforcing capital preference for core assets. In terms of volatility, ETH is significantly higher than BTC, reflecting its greater short-term susceptibility to emotional and news-driven influences, with market risk appetite leaning towards more stable allocations during structural adjustments. Overall, BTC demonstrates stronger resilience within the current range, and attention should still be paid to the marginal impact of policy direction and capital flow on market trends.
- Analysis of Long-Short Trading Size Ratio (LSR) of Bitcoin and Ethereum
The Long-Short Trading Size Ratio (LSR) is a key indicator measuring the trading volume of long and short positions in the market, typically used to assess market sentiment and trend strength. When LSR is greater than 1, it indicates that the volume of active buying (long positions) exceeds that of active selling (short positions), suggesting a market inclination towards bullish sentiment.
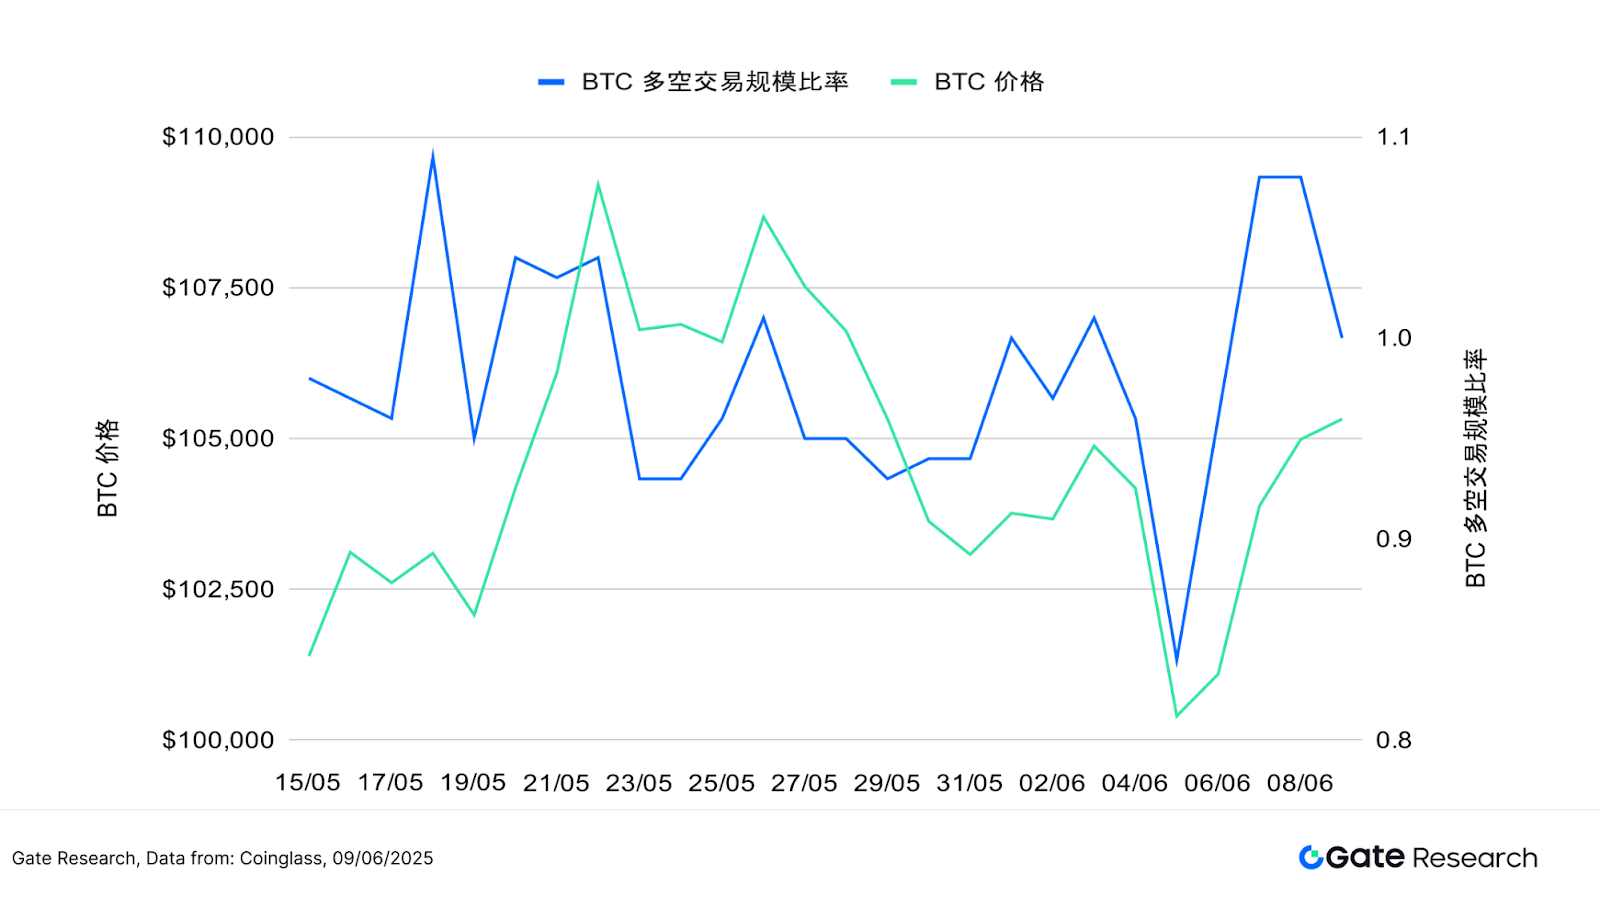
According to Coinglass data, the LSR of BTC and ETH has not synchronized with price movements, reflecting a lack of consensus on current price fluctuations and a neutral capital sentiment, accompanied by significant hedging behavior. For BTC, the price has retraced from its peak to around 102,000 USDT since the end of May; although there was a slight rebound in the short term after June 7, it remains in a corrective structure overall. Meanwhile, the LSR has not shown a significant decline, only retreating to around 0.85, and instead quickly rebounded during price corrections, even briefly rising to 1.1, indicating short covering or tentative long positions entering the market. However, this ratio has not formed a sustained trend, remaining in the 0.9 to 1.1 range, indicating a lack of clear directional consensus in the market and a neutral capital sentiment.
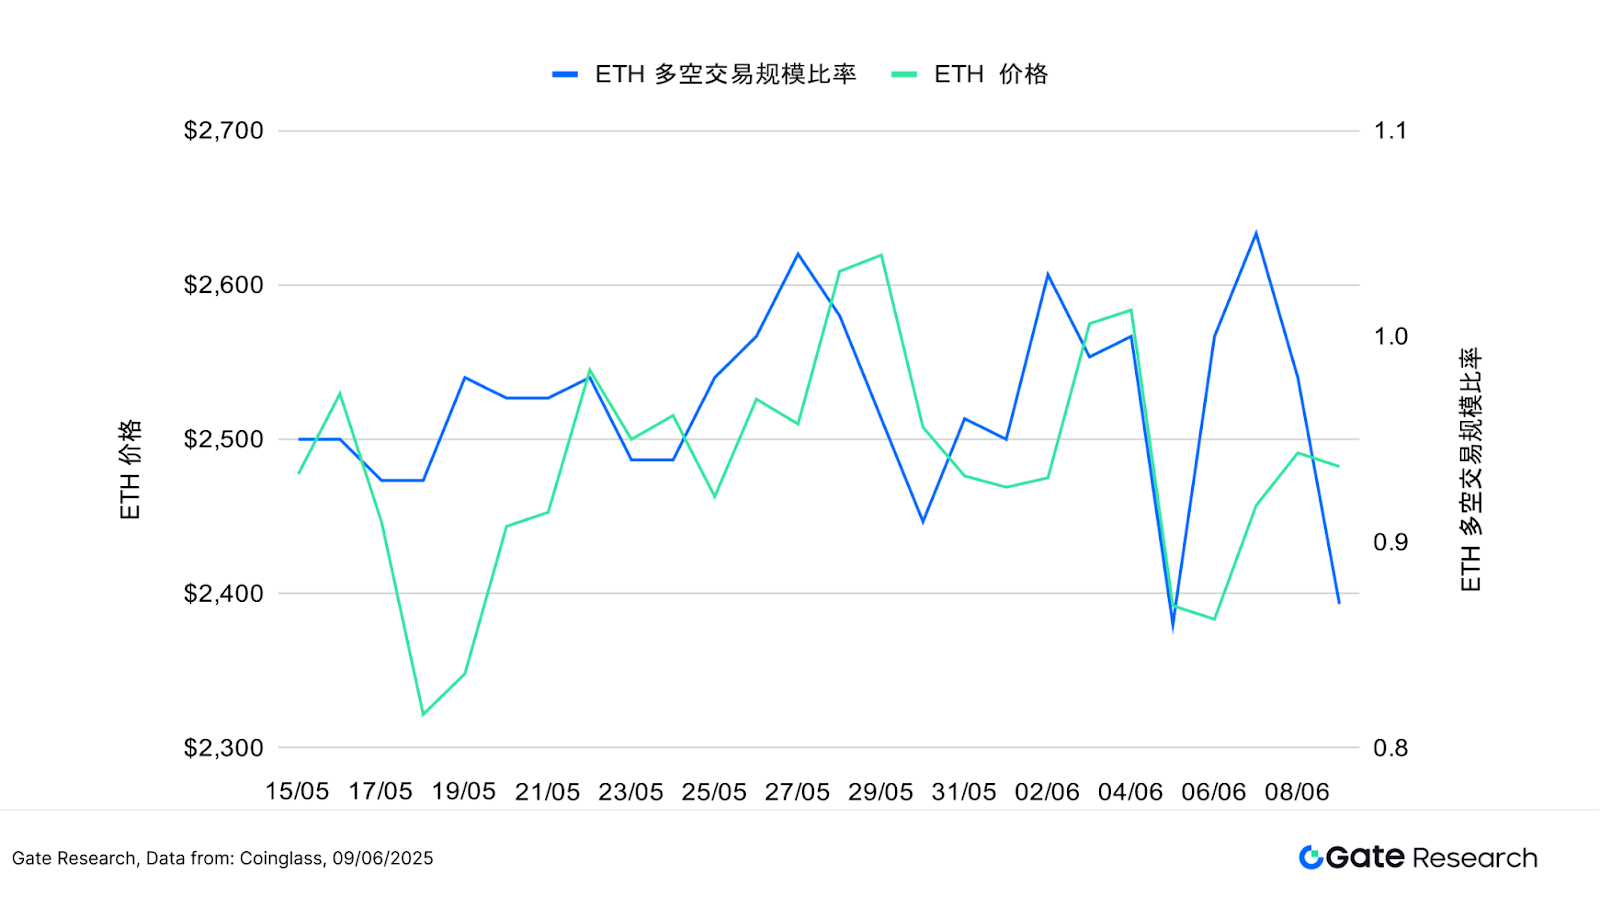
ETH's price retreated from a high of around 2,600 USDT in early June, testing 2,400 USDT before consolidating. The LSR also fluctuated significantly, repeatedly falling below 0.9, reflecting strong short pressure during the upward process. Even when prices rebounded, the LSR did not stabilize above 1, indicating insufficient bullish dominance and intensified market competition.
Overall, despite a short-term technical rebound in BTC and ETH, the long-short trading ratio has not formed a synchronized structural strengthening, indicating lingering doubts about the market's future direction. The fluctuations in LSR during this round of pullback are more likely to reflect short profit-taking or short-term capital repositioning rather than a clear trend reversal. If the LSR can consistently remain above 1, it may support prices in establishing a more sustained upward structure.
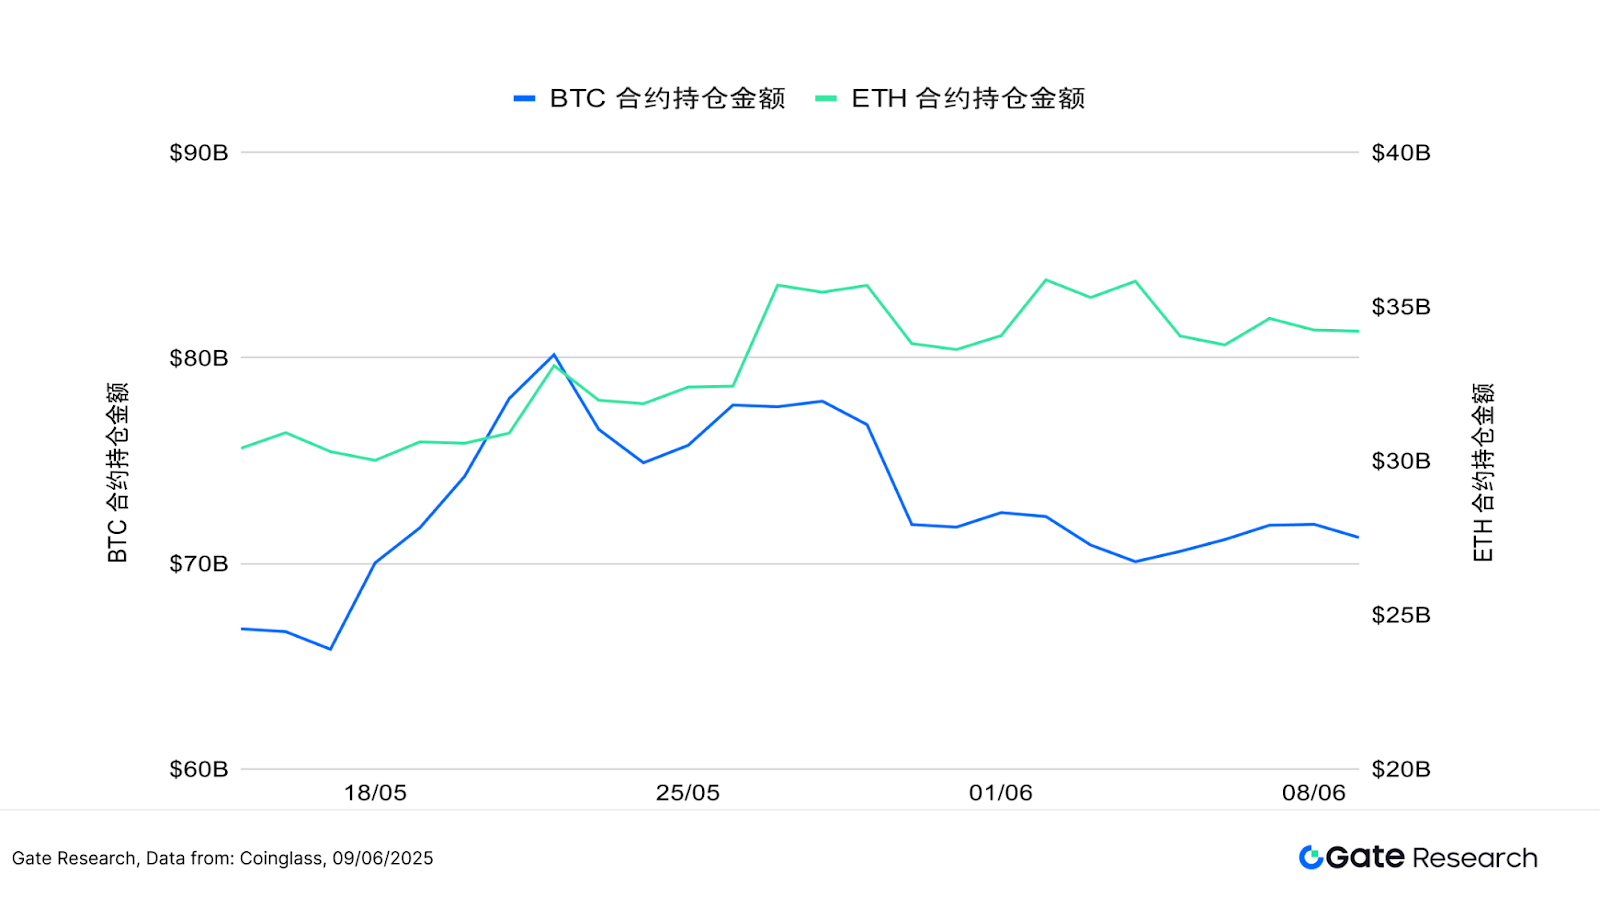
- Analysis of Contract Positions
According to Coinglass data, the trends in contract positions for BTC and ETH have diverged. BTC's contract positions gradually declined after reaching a peak of about 82 billion dollars around May 20, stabilizing in the range of 72 billion to 74 billion dollars over the past two weeks, reflecting a withdrawal of leveraged funds during the price correction phase and a cooling market enthusiasm. In contrast, ETH's contract positions have remained relatively high since mid to late May, oscillating around 35 billion dollars, indicating that despite significant price fluctuations, capital allocation in contracts remains relatively stable, with no signs of large-scale liquidation, and participation willingness remains at a medium to high level.
Overall, BTC's leverage structure has shown a clear cooling after the market correction at the end of May, while ETH demonstrates stronger position resilience. Although capital has not significantly withdrawn from the ETH market, combined with the persistently low LSR and erratic price movements, it is evident that market sentiment is cautious, primarily focused on short-term speculation, and a structural trend has yet to form. If the contract positions of BTC and ETH can synchronize and increase, it will be an important signal for the market to restart a trending situation.
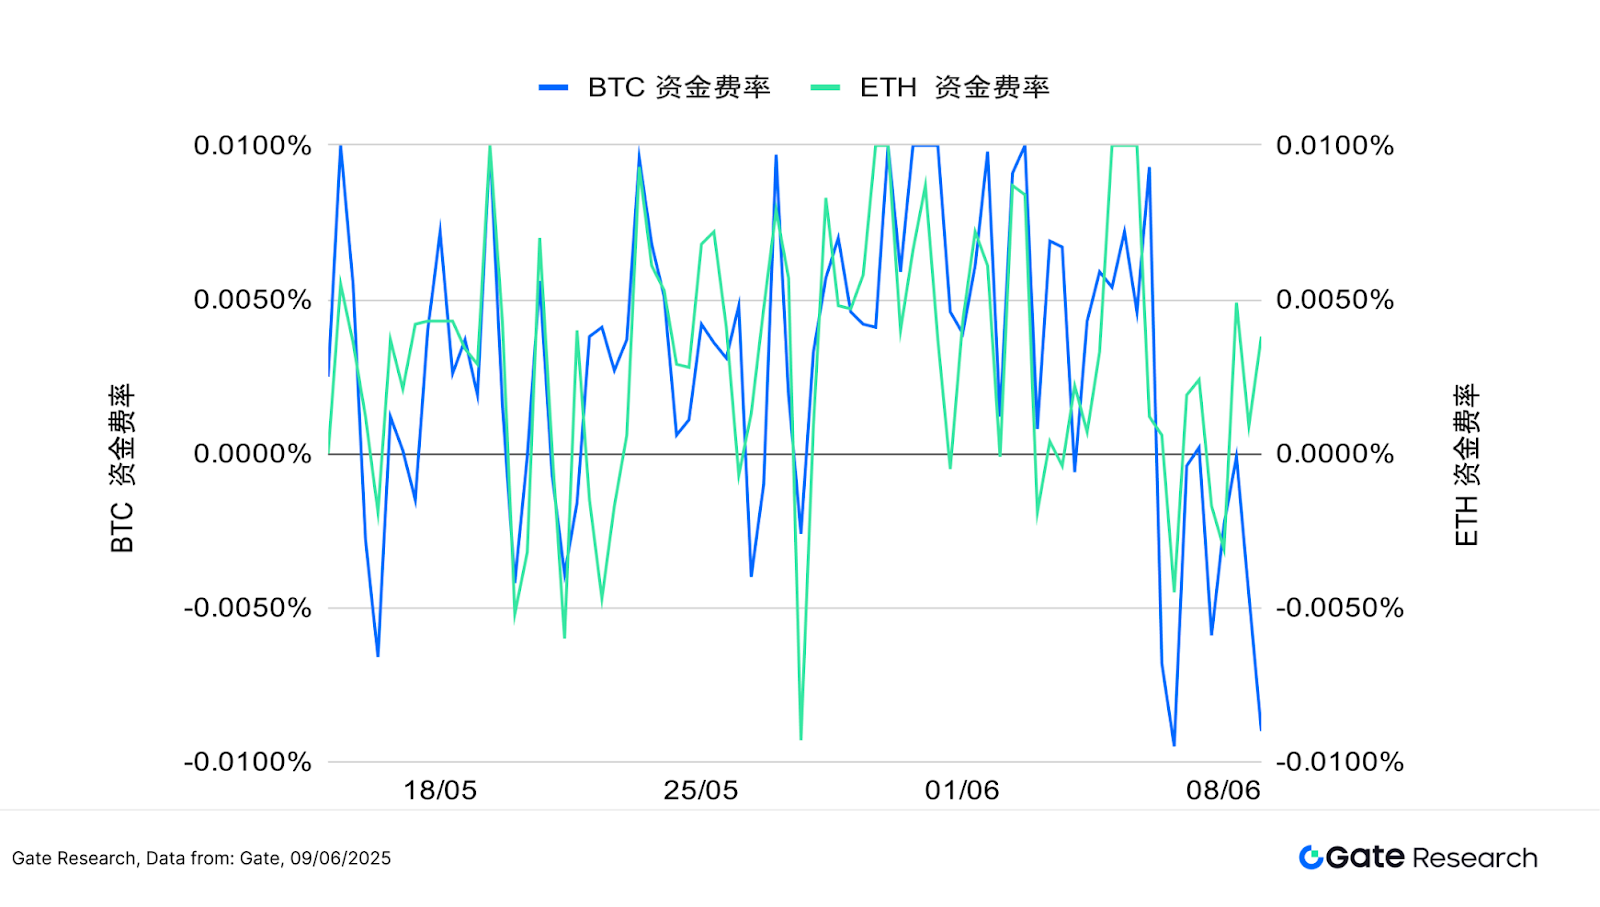
- Funding Rates
The funding rates for BTC and ETH have fluctuated slightly around 0%, frequently switching between positive and negative, reflecting a tug-of-war between bullish and bearish forces, with a cautious sentiment prevailing. In the past week, BTC's funding rate has fluctuated more dramatically, frequently switching between positive and negative 0.01%, indicating significant disagreement in the market regarding its short-term direction, with aggressive inflows and outflows of leveraged funds, and relatively weak structural stability. In contrast, while ETH's funding rate has also oscillated, the amplitude of fluctuations is slightly smaller, with a relatively convergent trend, reflecting a more cautious capital allocation and moderate leveraged sentiment.
Overall, although there have been positive funding rates on some trading days for BTC and ETH, indicating short-term attempts by bulls to enter the market, no sustained trend has formed. The current market still lacks clear directional expectations, with a restrained pace of capital accumulation, and the market is in a phase of oscillation and consolidation, with funding rates reflecting a neutral and cautious market sentiment.
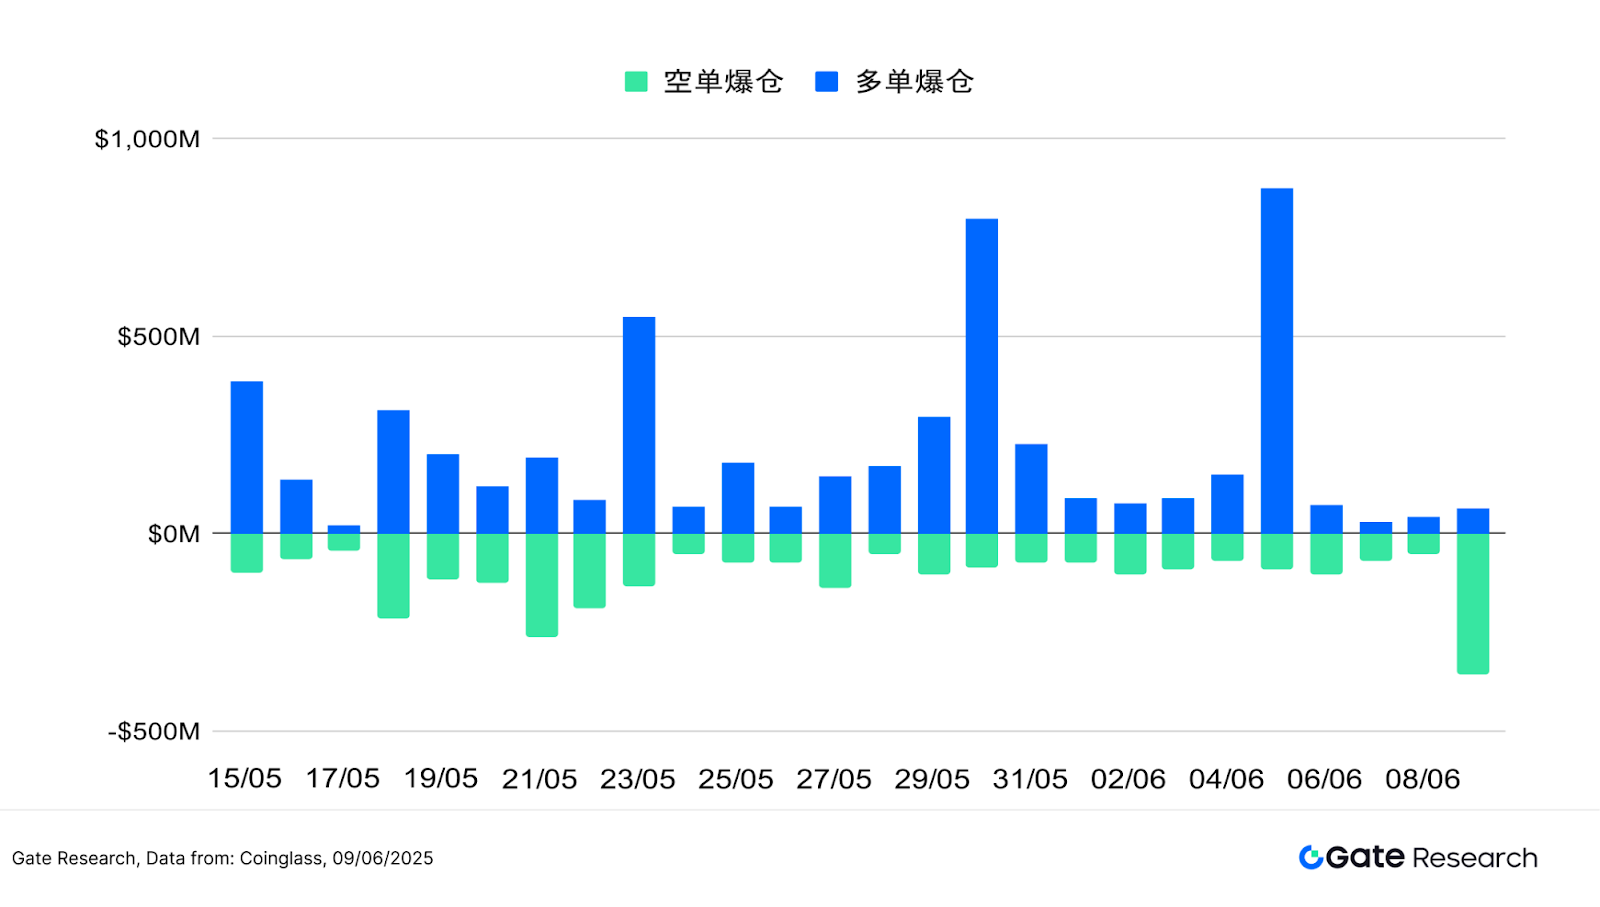
- Cryptocurrency Contract Liquidation Chart
According to Coinglass data, over the past two weeks, long liquidations have consistently exceeded short liquidations on most trading days, indicating a clear bullish sentiment during the high-level fluctuations, with capital generally inclined to increase positions during the upward movement. However, in the context of market corrections or intensified fluctuations, long positions frequently faced liquidation, with liquidation amounts repeatedly surpassing 500 million dollars, peaking at 875 million dollars on June 5. That evening, a heated dispute between Musk and Trump on social media triggered short-term panic in the market, causing both Tesla's stock price and Bitcoin to drop, exacerbating overall market volatility. This event led to a large number of long positions being liquidated, with the total liquidation amount across the network approaching 1 billion dollars within 24 hours, marking one of the largest liquidation peaks in the recent contract market.
In contrast, the scale of short liquidations has remained relatively low, although it has expanded during some short-term rebounds, it has not formed a sustained dominant pattern. June 9 was one of the few days when short liquidations exceeded long liquidations, primarily due to positive news from the US-China talks, with the White House hinting at easing export controls, which warmed market sentiment and triggered a price rebound, leading to concentrated short covering and triggering liquidations.
Overall, the current market liquidation structure presents a "long-dominated liquidation" pattern, reflecting a significant misjudgment of short-term market conditions under an environment of high leverage and high volatility, increasing the risks of chasing highs. Combining data from LSR and funding rates, although the current market has active trading support, it remains in a phase of structural divergence, lacking a clear unilateral trend, and caution is needed regarding the severe volatility and irrational drawdown risks brought about by liquidation magnification.
Quantitative Analysis - Moving Average Trend Breakout Strategy
(Disclaimer: All predictions in this article are based on historical data and market trends, and are for reference only. They should not be considered as investment advice or guarantees of future market trends. Investors should fully consider risks and make cautious decisions when making related investments.)
- Strategy Overview
The moving average trend breakout strategy is a medium to short-term trading strategy based on moving average crossovers and price volatility to determine trends. By combining Simple Moving Averages (SMA) and Exponential Moving Averages (EMA), it monitors changes in price direction, using short-term moving averages crossing above or below long-term moving averages as buy and sell signals. Additionally, the strategy incorporates dynamic stop-loss and take-profit mechanisms to lock in profits or limit losses, making it suitable for application in trending markets characterized by fluctuations.
- Core Parameter Settings
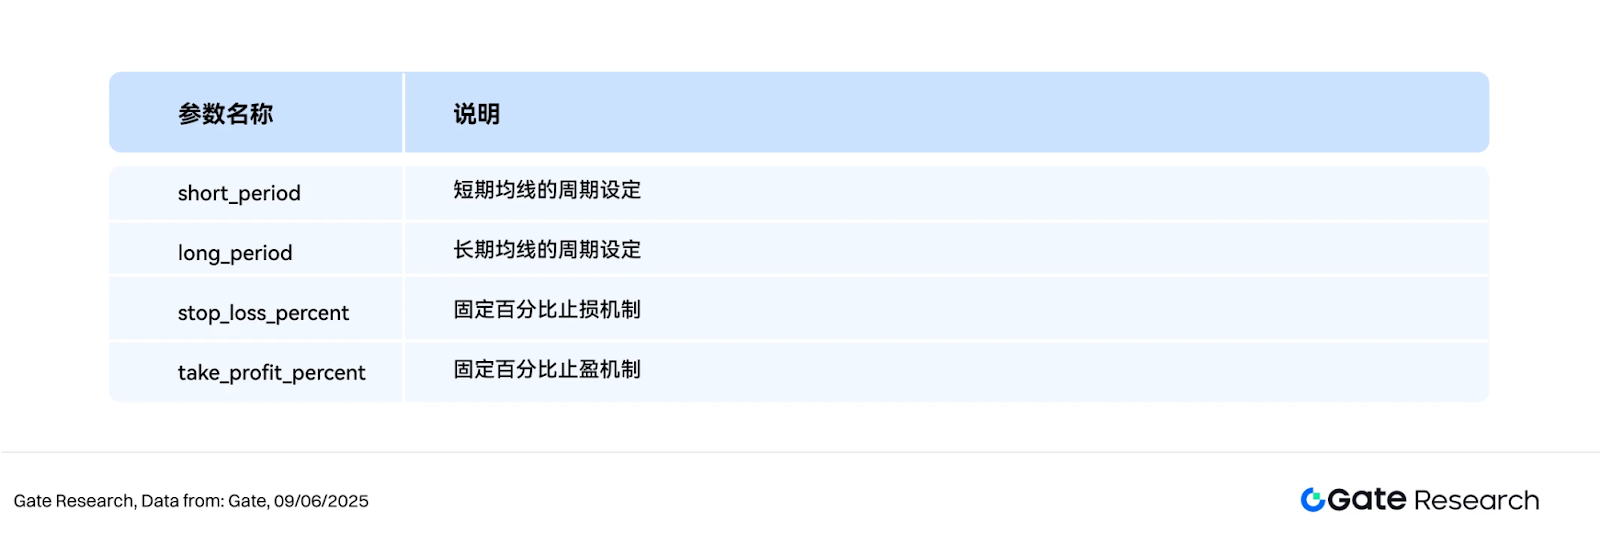
- Strategy Logic and Operation Mechanism
Entry Conditions
Exit Conditions:
Practical Example Chart
The following chart shows the XRP/USDT 4-hour candlestick chart at the most recent entry trigger on June 3, 2025. After a brief pullback, a technical reversal signal appeared in the early hours of June 3: the short-term moving average MA5 began to cross above the medium-term moving average MA10, the MACD fast line and slow line formed a golden cross, and trading volume increased simultaneously, indicating enhanced bullish momentum. The strategy triggered a buy at this position, successfully capturing a subsequent significant rebound, aligning with the entry logic of a trend-following bullish strategy.
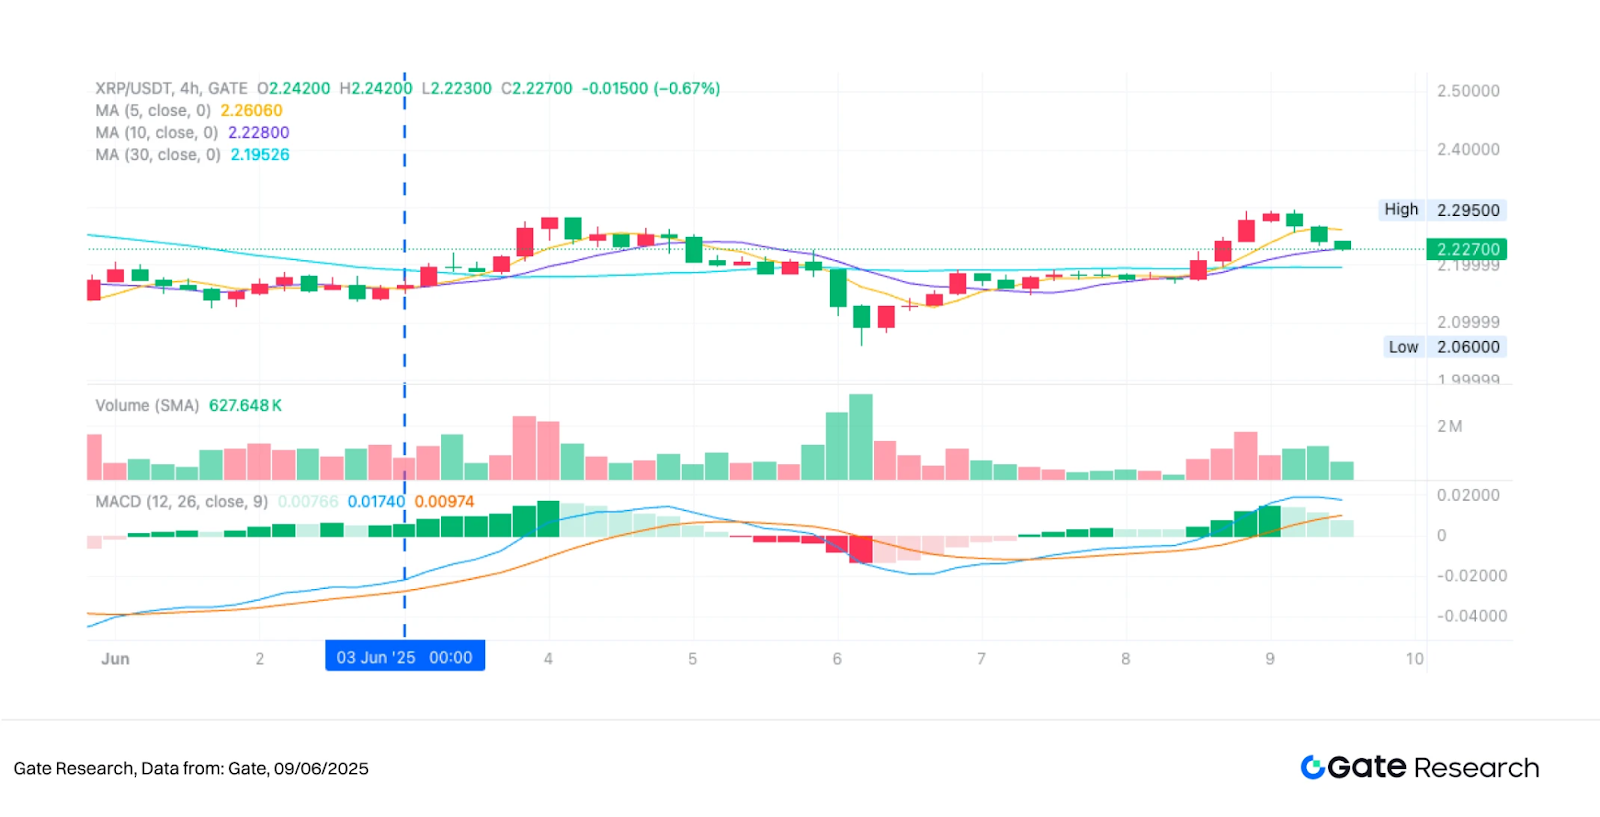
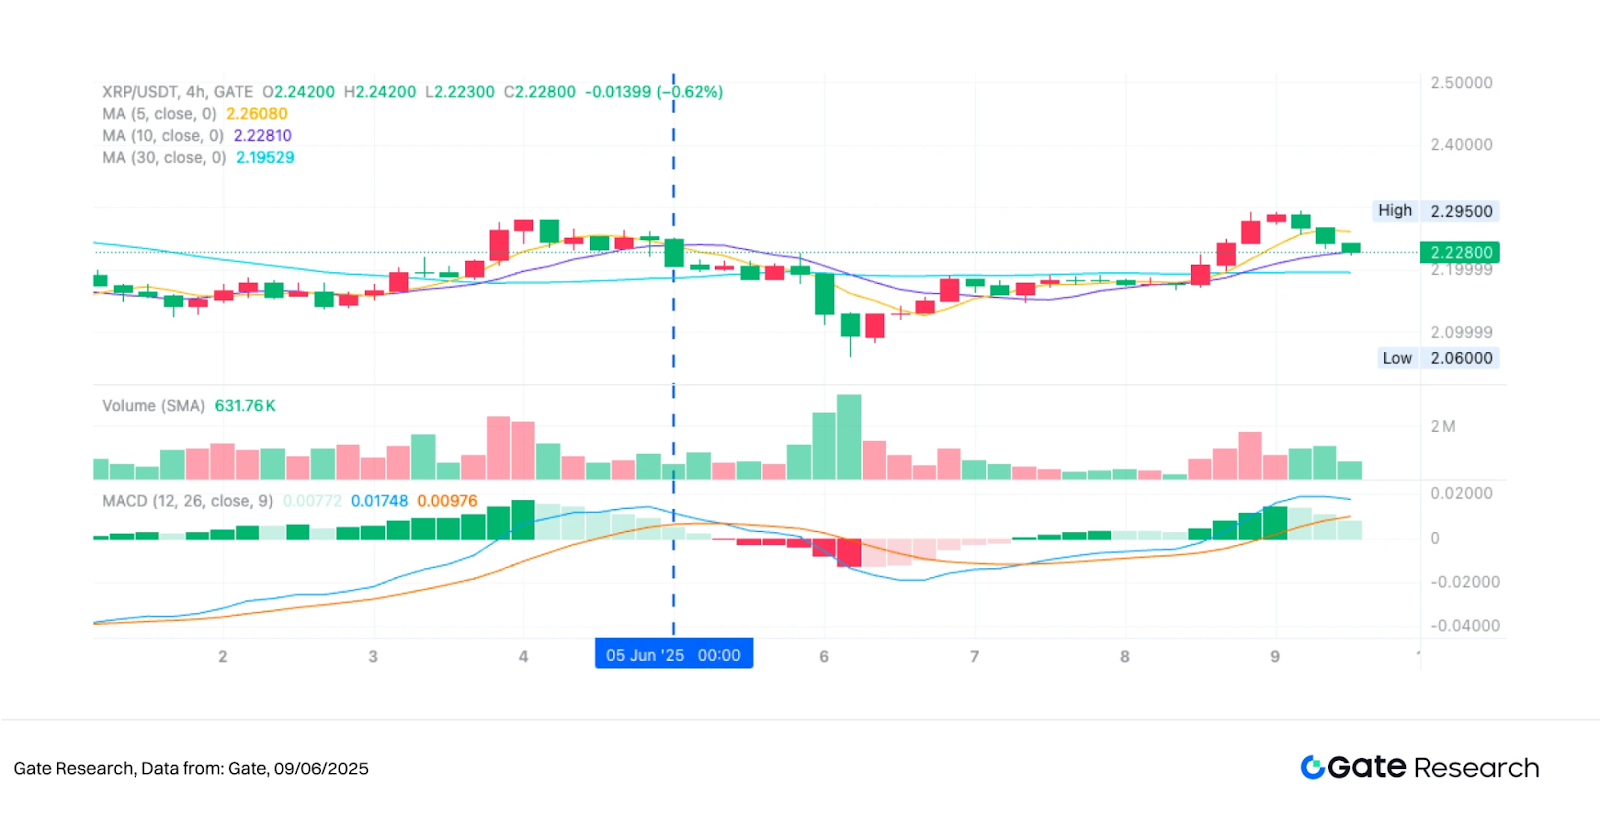
Through the above practical example, we visually demonstrate the entry and exit logic and dynamic risk control mechanism of the trend strategy during the price momentum change process. The strategy judges the trend direction based on the crossover of short-term and long-term moving averages, entering the market when the short-term moving average crosses above, capturing upward momentum; when the short-term moving average crosses below or momentum indicators weaken, it exits in a timely manner, effectively avoiding drawdown risks. While controlling profit and loss fluctuations, the strategy successfully locks in profits from major price swings. This case not only validates the operability and disciplined execution of the trend strategy in actual market conditions but also demonstrates its good ability to maintain profits and defensive characteristics in a highly volatile market environment, providing a reliable empirical basis for future parameter optimization and cross-asset applications.
- Practical Application Example
Parameter Backtesting Settings
To find the best parameter combinations, we conducted a systematic grid search over the following range:
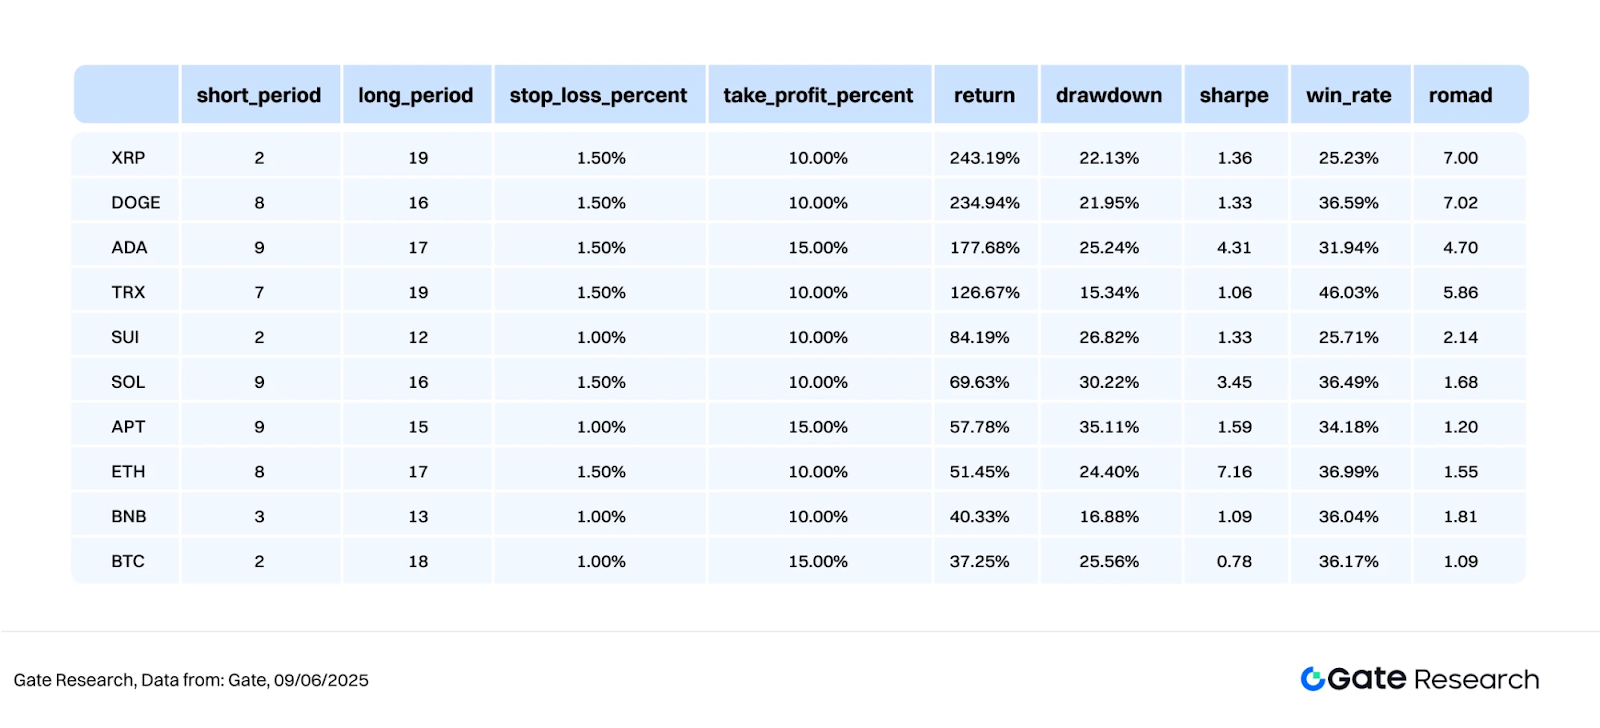
Taking the top ten cryptocurrency projects by market capitalization (excluding stablecoins) as an example, this article backtested the 4-hour candlestick data from May 2024 to June 2025, testing a total of 891 parameter combinations and selecting the ten with the best annualized return performance. Evaluation criteria include annualized return, Sharpe ratio, maximum drawdown, and ROMAD (return to maximum drawdown ratio), to comprehensively assess the strategy's stability and risk-adjusted performance in different market environments.
The strategy logic indicates that when the program detects a short-term moving average crossing above a long-term moving average, it is considered a trend initiation signal, and the strategy will immediately trigger a buy operation. This structure aims to capture the initial strengthening phase of the market by identifying price trend direction through moving average crossovers and controlling risk with a dynamic take-profit and stop-loss mechanism. If the subsequent short-term moving average crosses below the long-term moving average, or if the price reaches the preset stop-loss or take-profit ratio, the system will automatically execute an exit operation to achieve robust profit locking and risk control.
Taking XRP as an example, the settings used in this strategy are as follows:
This logic combines trend breakout signals with fixed proportion risk control rules, suitable for trading environments with clear market direction and well-defined wave structures, effectively controlling drawdowns while following trends, enhancing trading stability and overall return quality.
Performance and Results Analysis
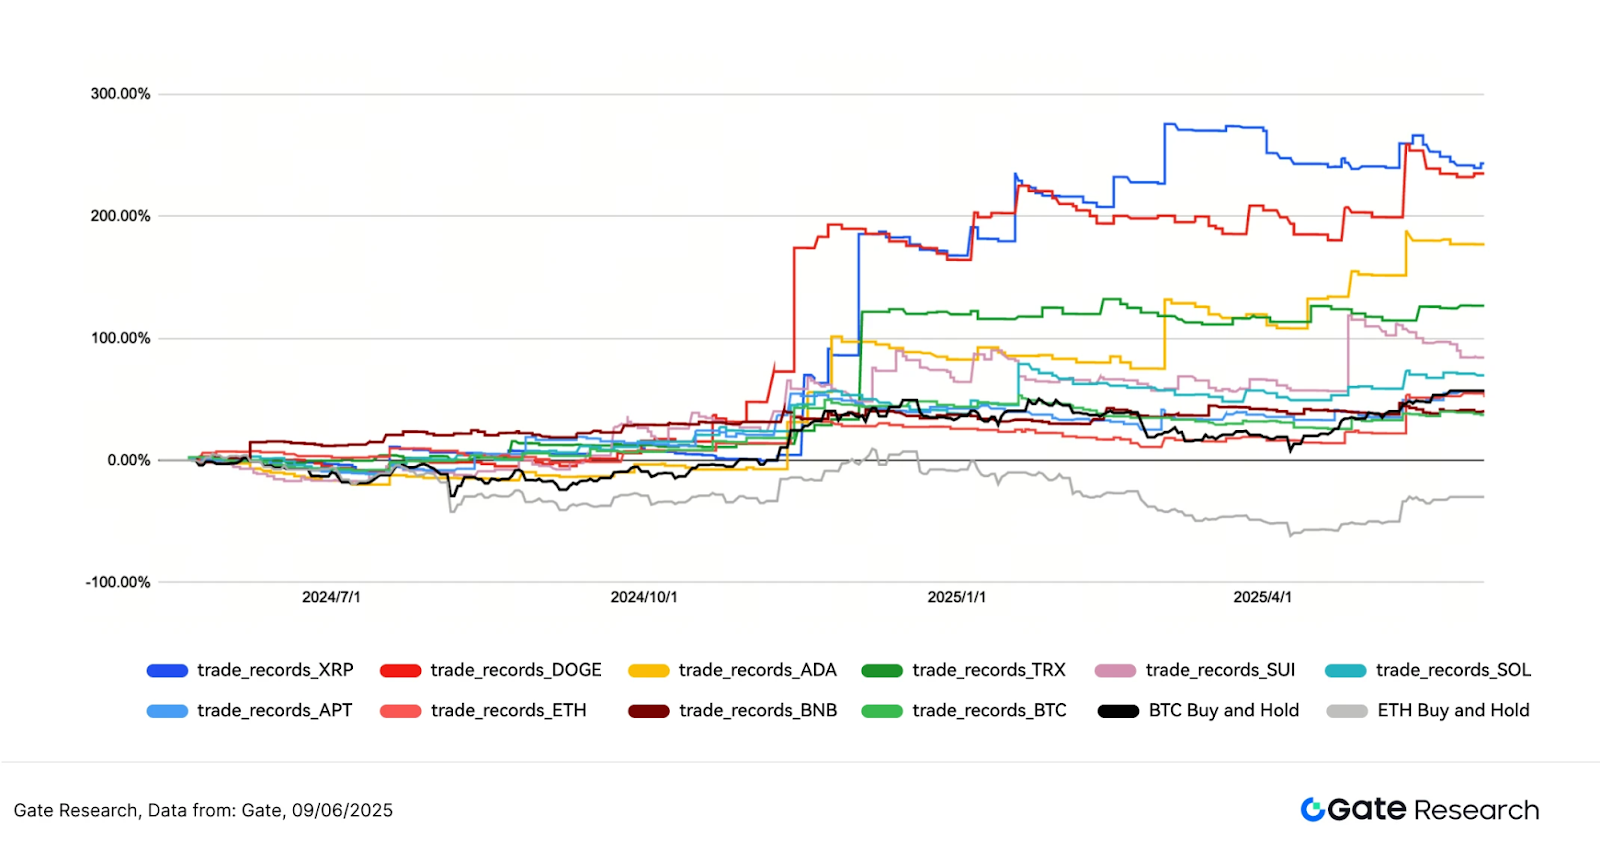
The backtesting period from May 2024 to June 2025 shows that the cumulative return performance of the trend strategy applied to the top ten cryptocurrency projects (excluding stablecoins) is overall robust, with most cryptocurrencies significantly outperforming the Buy and Hold strategy of BTC and ETH. Among them, XRP and DOGE performed particularly well, with cumulative returns reaching 243% and 234%, respectively. In contrast, the spot holding strategies for BTC and ETH have long been in a fluctuating or downward trend, with ETH even experiencing a drawdown of over 50%. The trend strategy effectively avoided downside risks and captured multiple swing opportunities, demonstrating excellent risk control and asset appreciation capabilities.
Overall, the trend strategy shows good adaptability across multiple cryptocurrencies, effectively controlling drawdowns during severe fluctuations while steadily accumulating returns. The current strategy combination achieves a good balance between returns and stability, making it valuable for practical deployment. In the future, dynamic Bollinger parameters, volume factors, or volatility screening mechanisms can be further introduced to optimize the strategy's performance in different market environments and expand it into a multi-asset and multi-period quantitative trading framework to enhance overall adaptability and trading efficiency.
- Trading Strategy Summary
The moving average trend breakout strategy demonstrates robust risk control capabilities and good return performance across multiple mainstream crypto assets through moving average crossovers as the core entry and exit logic, combined with dynamic stop-loss and take-profit mechanisms. The strategy effectively captures multiple rounds of medium to short-term trend movements during the backtesting period, particularly excelling in fluctuating and reversing market conditions, significantly outperforming traditional Buy and Hold strategies.
From the multi-cryptocurrency backtesting results, the strategy combinations for projects such as XRP, DOGE, and ADA have achieved impressive results, with the highest cumulative returns exceeding 240%, effectively avoiding deep drawdown risks encountered during spot holdings like ETH, validating the strategy's applicability and robustness in practice.
It is worth noting that although the overall win rate of most strategies is below 50%, through good risk-reward ratio (profit-loss ratio) design, even with a lower win rate, it can still achieve positive returns overall, reflecting the strategy's effectiveness in profit-loss control and position management.
Overall, this strategy achieves a good balance in controlling drawdowns, enhancing return efficiency, and improving capital utilization, making it suitable for deployment in high-volatility market environments. Future enhancements could include the introduction of Bollinger Bands, volume filtering, volatility screening, and other technical factors to optimize signal quality and improve performance within a multi-period and multi-asset framework, laying the foundation for establishing a robust quantitative trading system.
Conclusion
From May 27 to June 9, 2025, the cryptocurrency market was overall in a phase of high volatility and structural adjustments, with BTC and ETH repeatedly switching between high-level fluctuations and range corrections, and overall market sentiment remained cautious. Although contract positions remained high and capital continued to flow in, the long-short ratio (LSR) and funding rates did not show a clear unilateral tendency, indicating that major capital remains focused on hedging and short-term trading, with high leverage and high liquidation risks coexisting. During this period, long liquidation events occurred frequently, especially on June 5, when the heated exchange between Musk and Trump on social media triggered panic in the market, leading to simultaneous declines in Tesla and Bitcoin, with nearly 1 billion dollars in liquidations across the network within 24 hours, highlighting the current market's lack of stable confidence in high positions and a significant increase in leverage usage risks.
In this context, this quantitative analysis focuses on the "moving average trend breakout strategy," validating its adaptability and practicality in different market conditions. The strategy identifies trend initiation through short-term moving averages crossing above long-term moving averages and controls risks with a fixed proportion of take-profit and stop-loss mechanisms. Backtesting results show that the strategy performs outstandingly in cryptocurrencies such as XRP, DOGE, and ADA, with cumulative returns exceeding 240% and good drawdown control capabilities.
It is noteworthy that although the overall win rate of the strategy is low (below 50%), relying on a high profit-loss ratio and a clear disciplined exit mechanism, it can still achieve long-term positive returns, reflecting the strategy's effectiveness in capital management and risk control. The current strategy achieves a good balance between returns, stability, and execution simplicity, making it suitable for real-world deployment. However, in actual operations, it may still be affected by market fluctuations, extreme conditions, or signal failures, so it is recommended to combine other quantitative factors and risk control mechanisms to enhance the strategy's stability and adaptability, and to make rational judgments and cautious responses.
References:
Related: The Financial Stability Board (FSB) warns that cryptocurrencies are approaching a "critical point," deepening ties with traditional finance.
Original article: “Ethereum (ETH) Struggles to Maintain Momentum, Trend Breakout Strategy Yields Over 240%”
免责声明:本文章仅代表作者个人观点,不代表本平台的立场和观点。本文章仅供信息分享,不构成对任何人的任何投资建议。用户与作者之间的任何争议,与本平台无关。如网页中刊载的文章或图片涉及侵权,请提供相关的权利证明和身份证明发送邮件到support@aicoin.com,本平台相关工作人员将会进行核查。


