I. Introduction
As the largest cryptocurrency by market capitalization, Bitcoin's price fluctuations have always attracted significant market attention. April and October are referred to as the "golden window period" for Bitcoin. So, does Bitcoin's price trend really exhibit a clear seasonal pattern? Are certain months more prone to increases or decreases? If such patterns exist, what are the underlying reasons? More importantly, can these historical patterns provide guidance for future investment decisions?
In fact, Bitcoin has over a decade of trading history since its inception, and a wealth of data indicates that its price performance does exhibit significant monthly patterns and seasonal characteristics. For example, certain months of the year (such as October and November) tend to see price increases, while others (like September) usually perform poorly. These patterns may seem coincidental, but they are underpinned by complex market cycles and macroeconomic factors.
This study will delve into the price performance characteristics of Bitcoin across different months over the years, analyze the market logic and possible reasons behind these patterns in conjunction with the macroeconomic context, and provide an analysis and forecast for the second half of 2025, helping investors better understand Bitcoin's seasonal price trends and make more informed investment decisions.
II. Analysis of Bitcoin's Historical Monthly Performance Patterns
By statistically analyzing Bitcoin's historical price performance from 2013 to 2024 for each month, we find that Bitcoin's price does indeed exhibit significant monthly seasonal patterns. The performance differences across months are notable, with some months clearly favoring price increases while others are more prone to declines.
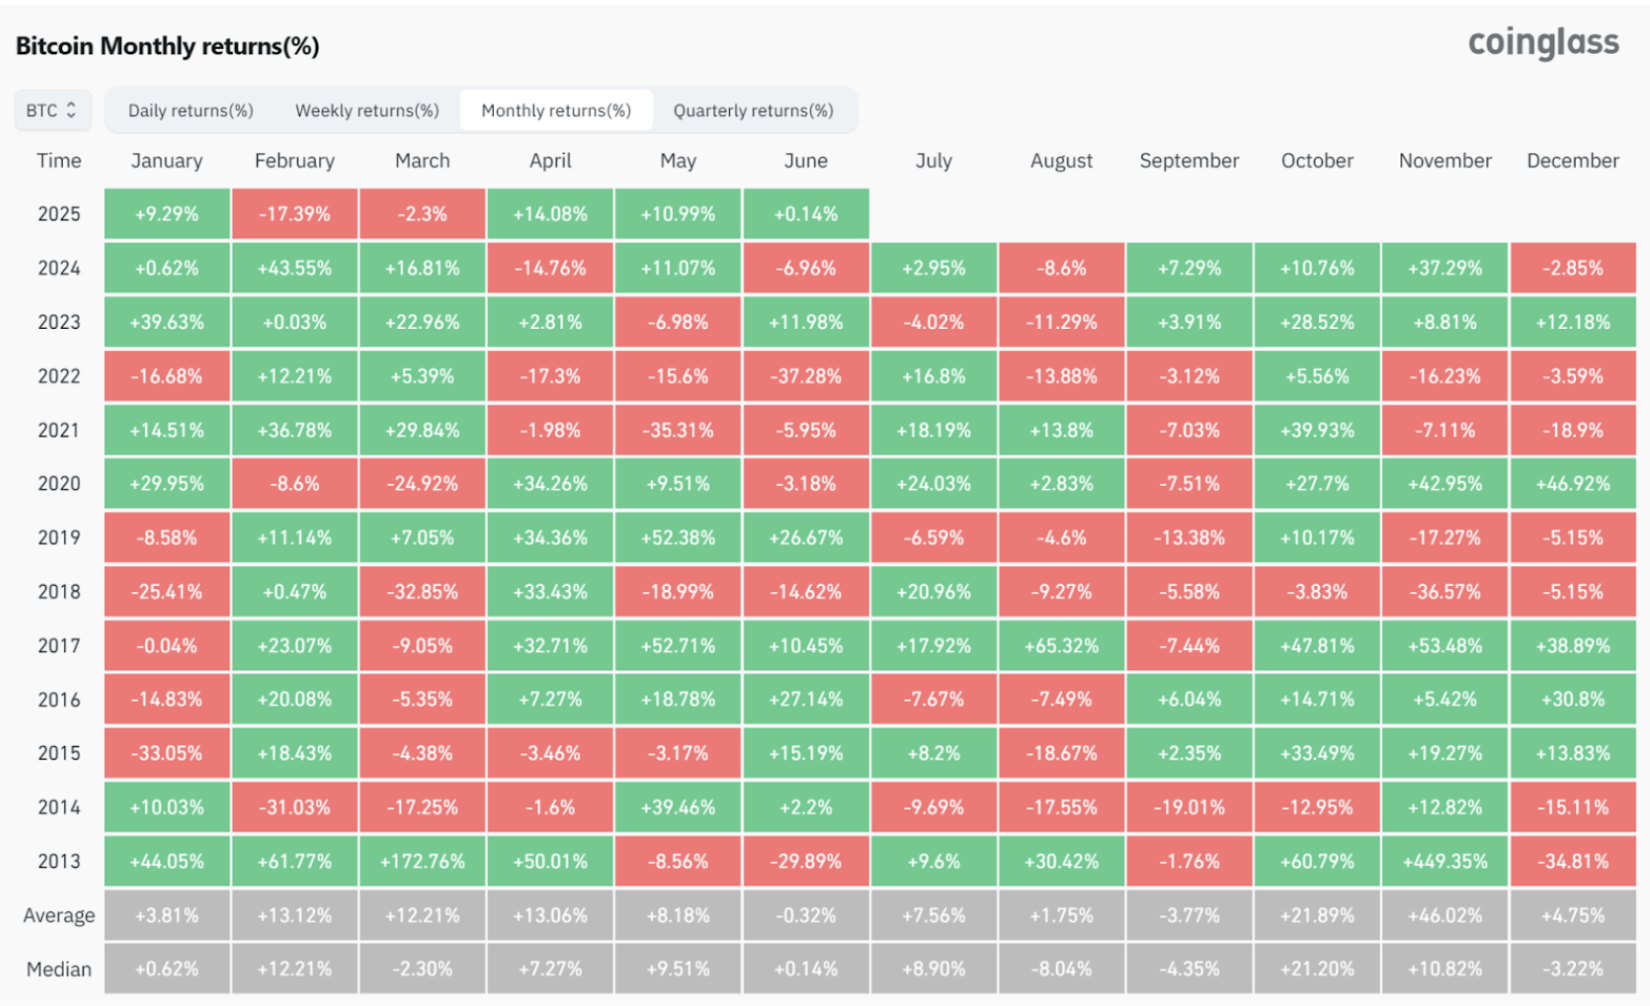
Source: https://www.coinglass.com/today
1. Strongest Performing Months: February, October, November
From historical data, Bitcoin typically performs exceptionally well in February, October, and November:
February often sees significant price increases. Data shows that since 2013, February has experienced several substantial increases, such as a 43.55% rise in 2024, a 36.78% rise in 2021, and a 61.77% rise in 2013. On average, February's price increase reaches 13.12%, reflecting a stable strong characteristic.
October is also a notably favorable month, with a high overall probability of price increases, and a historical average increase of 21.89%, demonstrating stable and reliable performance. Notably, October 2013 saw a 60.79% increase, October 2017 a 47.81% increase, and October 2020 a 27.7% increase, all significantly higher than most other months of the year.
November is the month with the most significant price increases throughout the year, with the highest historical average increase. For example, November 2020 saw a 42.95% increase, November 2021 a 39.93% increase, and November 2025 a 37.29% increase. Especially during bull markets (like in 2020), November's strong performance is particularly notable.
2. Weaker Performing Months: January, August, September
In contrast, the months where Bitcoin's price performance has historically been weaker are concentrated in January, August, and September:
January has historically performed poorly, often experiencing significant declines, such as a 33.05% drop in January 2015, a 25.41% drop in January 2018, and a 16.68% drop in January 2022, with a low average monthly increase of only 3.81%. Although there were increases in 2020 and 2023, the overall risk remains high.
August is similarly weak, frequently showing negative returns, with an average monthly increase of 1.75%. For instance, August 2022 saw a 13.88% drop, August 2024 an 8.6% drop, and August 2014 a 17.55% drop, indicating an overall negative market sentiment.
September is particularly noteworthy, often referred to as the "September Curse," with an average monthly decline of -3.77%, significantly weaker than other months. For example, September 2019 saw a 13.38% drop, September 2022 a 3.12% drop, and September 2014 a 19.01% drop, showing generally poor performance.
3. Months with High Volatility: April, May, July
Some months, while generally favorable, exhibit extreme volatility:
April generally performs well, with a historical average increase of 13.06%. For example, April 2013 saw a 50.01% increase, April 2020 a 34.26% increase, and April 2018 a 33.43% increase, but it has also experienced significant declines, such as a 14.76% drop in 2024 and a 17.3% drop in 2022, indicating high volatility.
May is known as the "devil's month" in the market, characterized by frequent extreme fluctuations. For instance, May 2017 saw a 52.71% increase, May 2019 a 52.38% increase, but in 2021 it plummeted by 35.31%, and in 2022 it fell again by 15.6%. This extreme volatility often makes it difficult for investors to grasp market rhythms, although the average monthly increase is 8.18%, the volatility risk is notably high.
July generally shows positive performance, with an average monthly increase of 7.56%, but historically has seen many instances of both significant increases and decreases. For example, July 2020 saw a 24.03% increase, July 2021 an 18.19% increase, and July 2017 a 17.92% increase, but with considerable volatility, requiring investors to manage risks effectively. Notably, in recent years, if June experiences a significant decline, July often sees a substantial rebound.
4. Transitional Months: March, June, December
March and June show relatively neutral performance, with March having an average increase of 12.21% and June close to zero (-0.32%), generally falling into months where direction is hard to determine, but March is slightly stronger than June. June often serves as a transitional month for market shifts.
December shows relatively stable performance, with a historical average increase of 4.75%, influenced by year-end fund settlements and holiday effects, often resulting in high-level fluctuations or moderate increases.
In summary, we can roughly outline Bitcoin's seasonal price characteristics based on the above historical performance patterns: the beginning of each year (January) tends to show weak performance, spring (February, April) often sees good price increases, summer months show mixed performance (with July outperforming June and August), and early autumn's September frequently becomes the year's low point, followed by a high probability of price increases in the fourth quarter (October-December). While this pattern may vary in different years, the overall trend is quite clear. It is important to note that although historical patterns are significant, changes in the specific market environment and macroeconomic conditions each year may also lead to certain differences.
III. Analysis of the Reasons Behind Bitcoin's Monthly Performance Patterns
The phenomenon of Bitcoin's monthly seasonal trends is not coincidental but is driven by multiple market logics and cyclical factors. Behind this, there are both the cyclical patterns inherent to the cryptocurrency market and influences from the macroeconomic environment.
1. Market Cycles and Capital Flow Impact
Bitcoin's historical "four-year cycle" has a significant impact on its seasonality. Bitcoin undergoes a halving approximately every four years, which typically triggers a bull market in the following 1-2 years. Driven by this cycle, many historical bull market peaks have occurred in the fourth quarter. For example, the historical highs of 2013 and 2017 occurred in November-December, and the bull market peak in 2021 was also in November. This leads to statistically significant average increases in Q4, especially in October and November, as multiple bull market phases concentrate at the year's end. Conversely, bear markets following bull market peaks often begin at the end of the year or the beginning of the next, dragging down the performance in the following months, making January one of the months with a negative average return rate.
2. Macroeconomic and Traditional Market Seasonal Effects
The macroeconomic environment and seasonal effects from traditional markets also permeate the cryptocurrency market. Many investors reference the rhythms of traditional financial markets, such as the risk-averse tendency of "Sell in May." This is reflected in Bitcoin: after May each year, capital tends to tighten or risk-averse sentiment rises, leading to weak performance in May-June, while in the second half of the year, especially in autumn, capital re-enters the market. Additionally, the fiscal year cycles and tax cycles of major economies like the U.S. may also influence cryptocurrency investor behavior. For instance, the tax reporting season in April may cause U.S. investors to withdraw funds from the market for tax payments, which is considered one reason for Bitcoin's selling pressure in March-April. After the tax deadline, market pressure eases, and late April often sees a price rebound, aligning with the historical trend of overall price increases in April.
3. Macroeconomic Data Releases and Policy Cycles
The seasonality of the macro environment (such as mid-year interest rate policy shifts, year-end fund settlements, etc.) often overlaps with Bitcoin's seasonal price patterns, amplifying the price fluctuations in certain months. The Federal Reserve's meetings and interest rate decisions typically occur in specific months each year (such as March, June, September, December), impacting global risk assets. As a high-volatility asset, Bitcoin also experiences short-term fluctuations during these time windows. Historical data shows that if the Federal Reserve tightens monetary policy in the first half of the year, it often corresponds to poor performance for Bitcoin in the spring-summer transition; conversely, once a loosening cycle begins or market expectations shift towards easing, Bitcoin tends to strengthen gradually. The strength of the U.S. dollar index is inversely related to Bitcoin's price. When the dollar weakens, Bitcoin's price typically rises a few months later. For example, after the Federal Reserve's significant monetary easing in 2020, the dollar index plummeted, leading to explosive price increases for Bitcoin in the second half of 2020 and into 2021; conversely, when the dollar index surged to a 20-year high in 2022, Bitcoin entered a prolonged bear market. By 2024-2025, as inflation rates decline from high levels and the Federal Reserve's interest rate hike process concludes at the end of 2023, the macro liquidity environment has significantly improved compared to before. The market generally anticipates that the Federal Reserve will shift to a rate-cutting cycle in 2024-2025, providing more favorable external conditions for Bitcoin.
4. Investor Psychology and Market Participation
At the end of each year and the beginning of the new year, market participation and trading volumes often decline or change, which may lead to profit-taking or consolidation at year-end, as well as weak performance at the beginning of the year. However, in spring and the fourth quarter, significant meetings, such as the Federal Reserve's FOMC meetings concluding, and the allocation of funds for the new year, tend to enhance market risk appetite, making it easier for Bitcoin's price to rise. Particularly, the fourth quarter is often filled with "year-end performance pushes" and holiday effects, with many investors hoping to capitalize on year-end trends, which also boosts Bitcoin's performance in the final months of the year.
In summary, Bitcoin's monthly performance patterns result from the interplay of internal market cycles and external macro cycles: the halving-driven alternation of bull and bear markets determines the overall bullish or bearish tone for a given year, while the macro environment and investment rhythms influence when capital enters the market and when sentiment peaks. In most years, these factors collectively shape the seasonal patterns we observe statistically. However, specific circumstances each year may deviate from the average trajectory due to policy regulations, black swan events, and other unforeseen occurrences.
IV. Macroeconomic Environment and Market Background for 2025
The global macroeconomic environment is currently at a turning point characterized by multiple intertwined variables. The U.S. economy is experiencing a slowdown in growth, inflation is stabilizing but remains sticky, and a shift in monetary policy from tightening to easing is brewing. Meanwhile, geopolitical tensions, rising international trade barriers, and the restructuring of global manufacturing chains are continuously elevating systemic risks, affecting capital flows and investor risk appetite. The performance of traditional asset markets and the cryptocurrency market is also showing a divergence, with institutions leading and retail investors becoming more conservative.
1. U.S. Macro Policy: Cautious Easing and New Trade Frictions
In the first half of 2025, the momentum of U.S. economic growth continues to weaken. The annualized growth rate of real GDP in the first quarter was only +0.3%, and the unemployment rate rose to 4.2% in April. Overall inflation is on a downward trend, and the Federal Reserve is maintaining a cautious balance between inflation and employment. Since December 2024, the Federal Reserve has kept the federal funds rate stable at 4.25%-4.50%, and as of June 2025, has not officially initiated any rate cuts. Although the market generally expects the Federal Reserve to make its first rate cut in the third quarter, the FOMC statements have repeatedly emphasized the need to see "more concrete evidence of economic weakness and a decline in core inflation." This has led to ongoing market speculation regarding policy expectations.
In May 2025, the White House announced significant tariffs on key technology products made in China, such as electric vehicles, batteries, and semiconductors, raising the average tariff to 60%-100%, reigniting trade frictions between the U.S. and China. China quickly retaliated by proposing additional tariffs on U.S. imports of chips and agricultural products. This shift in trade policy amid "re-globalization" directly impacts the stability of global supply chains and raises concerns in capital markets about a resurgence of inflation in the future.
2. Global Security Situation: Escalating Conflicts Drive Risk Aversion
The global security situation in 2025 has not improved significantly and has even seen new risks escalate:
The conflict in Ukraine has dragged into its third year, and despite reduced aid from Europe and the U.S., the front lines remain in a stalemate;
Tensions in the Middle East have escalated, with conflicts between Israel and Lebanon intensifying, and concerns over Iran's nuclear issues reigniting market worries;
The situation in East Asia remains unstable, with multiple countries conducting military exercises in the South China Sea and the Taiwan Strait, increasing the risk of supply chain disruptions.
These uncertainties have heightened investors' concerns about "systemic black swans." From April to June, gold prices surged past $3,000, reaching a historic high, while U.S. Treasury bonds and assets like Bitcoin experienced simultaneous capital inflows, reflecting a strengthening of broad risk aversion in the market.
3. Traditional Market Risk Appetite: Shifting from Growth Pursuit to Structural Defense
U.S. stocks continue to exhibit a structural bull market, but the gains are notably concentrated in "super tech stocks" and the artificial intelligence sector. The S&P 500 index rose approximately 6.2% in the first half of the year, but small-cap companies performed weakly. The Nasdaq index relies on five major tech stocks for its upward movement, showing early signs of valuation bubbles.
In the bond market, institutional allocations have once again favored long-term U.S. Treasuries, with a flattening yield curve indicating that the market still anticipates a future rate-cutting cycle. High-yield bonds and emerging market bonds have seen capital outflows.
In terms of overall capital flows, retail investors are becoming more conservative, preferring low-volatility ETFs and short-duration bonds; institutional funds are showing a new trend of "overweighting gold and increasing allocations to Bitcoin."
4. Cryptocurrency Market Structure: Continued Institutional Inflow, Regulatory Uncertainties
Despite the uncertainties in the global economy, Bitcoin demonstrated strong resilience in the first half of 2025. After breaking through the historical high of $110,000 in May, the price entered a consolidation range, maintaining between $103,000 and $105,000 as of June, with narrowing volatility but strong bottom support.
The main driving factor is the continued net inflow of funds into U.S. spot Bitcoin ETFs. As of June, the assets managed by Bitcoin ETFs from institutions like BlackRock, Fidelity, and ARK have surpassed $130 billion. Institutional perceptions of Bitcoin have shifted from "speculative asset" to a role as "digital gold + hedging tool."
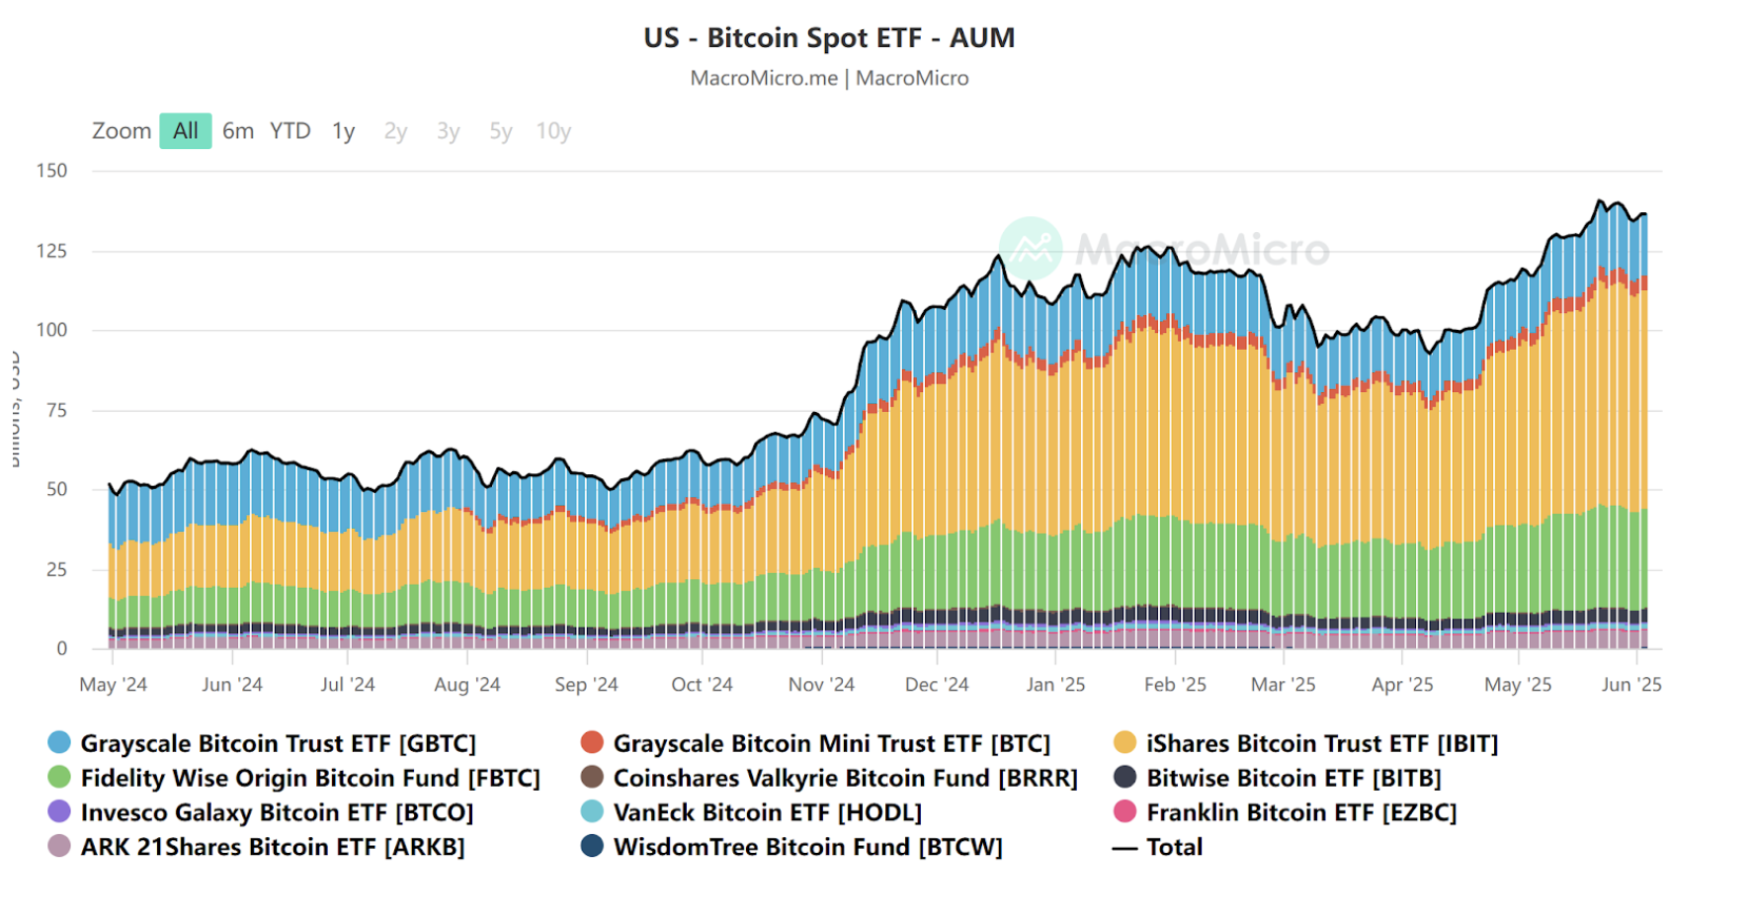
Source: https://en.macromicro.me/collections/3785/crypto/122014/us-bitcoin-spot-et-faum
On-chain data further confirms the changes in market structure: the proportion of long-term Bitcoin holders has reached a historic high, while the number of short-term active addresses and on-chain transaction counts has decreased by over 20% year-on-year. The popularity of meme coins and altcoins has significantly declined, and the entire market has entered a mature phase characterized by "dominance of main assets and cooling of thematic speculation."
On the regulatory front, the U.S. SEC is still coordinating policies around stablecoin regulation and the classification of DeFi, which is expected to become a key topic before the end of the year. This series of factors is prompting the core liquidity of the cryptocurrency market to gradually transition from "retail speculative hot money" to "institutional long-term allocation funds," giving Bitcoin a stronger ability to withstand cyclical pressures.
V. Outlook and Summary for Bitcoin's Performance from June to December 2025
Combining the historical data patterns and the current macroeconomic environment, we attempt to forecast Bitcoin's monthly performance in the second half of 2025, based on historical statistical trends and incorporating current realities such as economic cycles, Federal Reserve policy directions, and market sentiment, hoping to provide a reference perspective for investors' risk management.
June: Historically balanced between bulls and bears. The Federal Reserve remains inactive, with rate cut expectations delayed; Bitcoin is likely to hover around $100,000 to $110,000, with narrowing fluctuations, suggesting a wait-and-see approach rather than chasing prices.
July: Historical probability of an increase is about 70%. If June's consolidation is sufficient and the FOMC meeting releases dovish signals, the first rate cut may be initiated, and funds are expected to push prices higher. A "low open, high close" scenario is anticipated, with monthly gains potentially reaching double digits.
August: Traditionally a "summer slump." Institutions are on vacation, trading volumes shrink, and technical pullback pressures emerge, compounded by the absence of significant macro events; the market is expected to fluctuate weakly, with a focus on maintaining previous support levels.
September: The "September Curse" still needs to be guarded against. End-of-quarter rebalancing plus a second rate meeting, if the rate cut is less than expected, could trigger a 10-15% deep adjustment; if key moving averages are breached, leverage should be strictly controlled.
October: "Uptober" is likely to repeat. If rate cuts have been initiated in the third quarter, their liquidity effects will amplify in the fourth quarter; 18 months after the last halving, history often enters the main bullish phase of the market. Attention should be paid to rising volume and price along with a recovery in on-chain activity, with considerable monthly gains expected.
November: Historically the strongest month and a potential turning point. If market sentiment is catalyzed to an extreme in October, November may see a rapid peak, challenging the $180,000 to $200,000 range with significant volatility.
December: The performance will depend on November. If November peaks, December may see a cooling off and profit-taking; if November is moderate, December may continue a slow bull trend. With holiday liquidity decreasing, trading volumes may be light, amplifying volatility, and the year-end closing price is likely to remain more than double that of the beginning of the year.
Summary: Based on Bitcoin's historical seasonal patterns and the macro background of 2025, we expect Bitcoin to continue to rise amidst twists and turns in the second half of 2025. There may be fluctuations and adjustments from June to September, but strong increases are anticipated from October to December, potentially setting new historical records. However, it is important to note that the cryptocurrency market is highly volatile and uncertain, and black swan events could disrupt existing patterns at any time. Therefore, while seizing opportunities in the "big trend," it is crucial to implement effective risk management and strategic responses. "History does not repeat itself simply, but it rhymes with similar endings." As we approach the second half of 2025, whether Bitcoin can once again validate historical experiences remains to be seen!
About Us
Hotcoin Research, as the core research and investment center of the Hotcoin ecosystem, focuses on providing professional in-depth analysis and forward-looking insights for global cryptocurrency investors. We have built a "trend analysis + value discovery + real-time tracking" integrated service system, offering in-depth analysis of cryptocurrency industry trends, multi-dimensional assessments of potential projects, and around-the-clock monitoring of market fluctuations. Combined with our weekly live strategy sessions of "Hotcoin Selection" and daily news updates from "Blockchain Today," we provide precise market interpretations and practical strategies for investors at different levels. Leveraging cutting-edge data analysis models and industry resource networks, we continuously empower novice investors to establish cognitive frameworks and assist professional institutions in capturing alpha returns, collectively seizing value growth opportunities in the Web3 era.
Risk Warning
The cryptocurrency market is highly volatile, and investing carries risks. We strongly recommend that investors fully understand these risks and invest within a strict risk management framework to ensure the safety of their funds.
Website: https://lite.hotcoingex.cc/r/Hotcoinresearch
免责声明:本文章仅代表作者个人观点,不代表本平台的立场和观点。本文章仅供信息分享,不构成对任何人的任何投资建议。用户与作者之间的任何争议,与本平台无关。如网页中刊载的文章或图片涉及侵权,请提供相关的权利证明和身份证明发送邮件到support@aicoin.com,本平台相关工作人员将会进行核查。