Cryptocurrency News
May 30 Hot Topics:
1. SOL Strategies increased its holdings by 26,478 SOL, now holding a total of 420,355 SOL.
2. Paris Saint-Germain Football Club announced the allocation of Bitcoin reserves and plans to invest in Bitcoin startup projects.
3. Federal Reserve's Daly: If the labor market remains strong and inflation decreases, two rate cuts this year are reasonable.
4. Republican members of the U.S. House of Representatives officially proposed the "Digital Asset Market Clarification Act."
5. SEC clarifies its stance on the regulation of staking agreements, stating that some PoS activities do not constitute securities transactions.
Trading Insights
After years in the cryptocurrency space, I have summarized 8 trading techniques that combine "volume" which will definitely help you!
- Low Volume at Bottom - Signal of Accumulation
- Principle: In the bottom area, volume decreases while price remains stable, selling pressure is weak, and chips are locked in strongly, indicating that the main force is quietly accumulating.
- Application: Pay attention to not rush in; wait for a volume increase before entering.
- High Volume at Top - Alert for Distribution
- Principle: At high levels, volume increases while price stagnates, a large amount of chips are sold off, and the main force uses high volume to distribute.
- Application: Holders should be cautious and consider reducing positions or exiting.
- Incremental Rise - Password for Continuation
- Principle: During an uptrend, volume increases, new funds flow in, the bulls are strong, and the stock price has upward momentum.
- Application: Operate in the direction of the trend; if the pullback volume does not decrease, you can add to your position or hold.
- Decreasing Volume on Downtrend - Bottom Formation in Progress
- Principle: During a downtrend, volume decreases, selling willingness is weak, bears are exhausted, approaching the bottom.
- Application: Do not blindly cut losses; wait for confirmation signals of the bottom before making decisions.
- Sharp Drop, Slow Rise - Opportunity to Go Long at Support
- Principle: After a sharp drop, a slow rise occurs, panic selling subsides, and the bulls recover; if the support level holds, you can go long.
- Application: Set stop-loss at the support level, buy on dips, and target previous highs.
- Sharp Rise, Slow Drop - Timing to Short at Resistance
- Principle: After a sharp rise, a slow drop occurs, bulls are exhausted, and if the resistance level is met, it can be shorted.
- Application: Set stop-loss at the resistance level, sell on highs, and target the lower support level.
- Volume Increase on Uptrend - Warning for Pullback
- Principle: After a significant increase in volume, profit-taking and liquidation pressure is high, and the price needs to pull back to digest.
- Application: Appropriately reduce positions to lock in profits, and wait for a pullback before re-entering.
- Volume Increase on Downtrend - Rebound in Sight
- Principle: A panic sell-off with increased volume leads to emotional release, and after the bears are exhausted, a rebound is likely.
- Application: Aggressive traders can wait for stop-loss signals, take light positions to bet on a rebound, and set proper stop-losses.
LIFE IS LIKE
A JOURNEY ▲
Below are the real trading signals from the Big White Community this week. Congratulations to the friends who followed along. If your trades are not going well, you can come and test the waters.
Data is real, and each trade has a screenshot from the time it was issued.
**Search for the public account: *Big White Talks About Coins*
BTC
Analysis
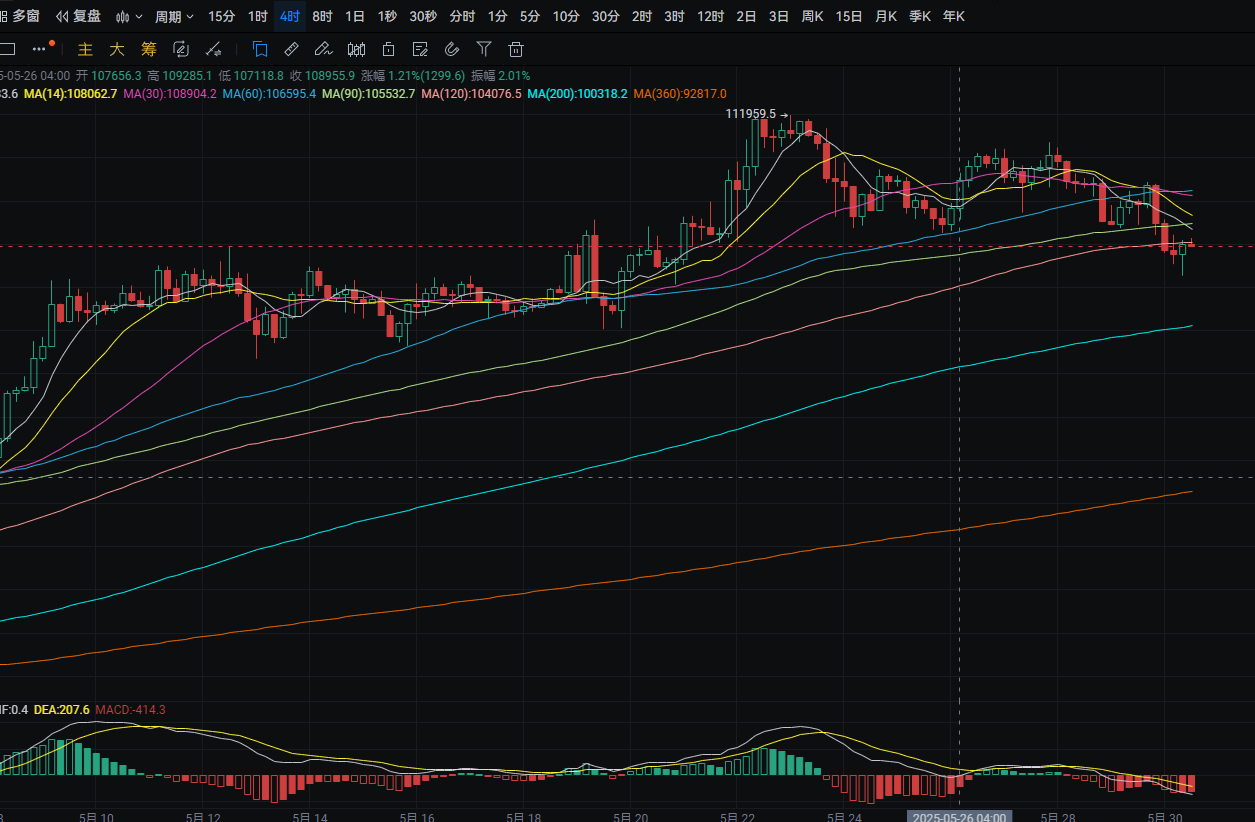
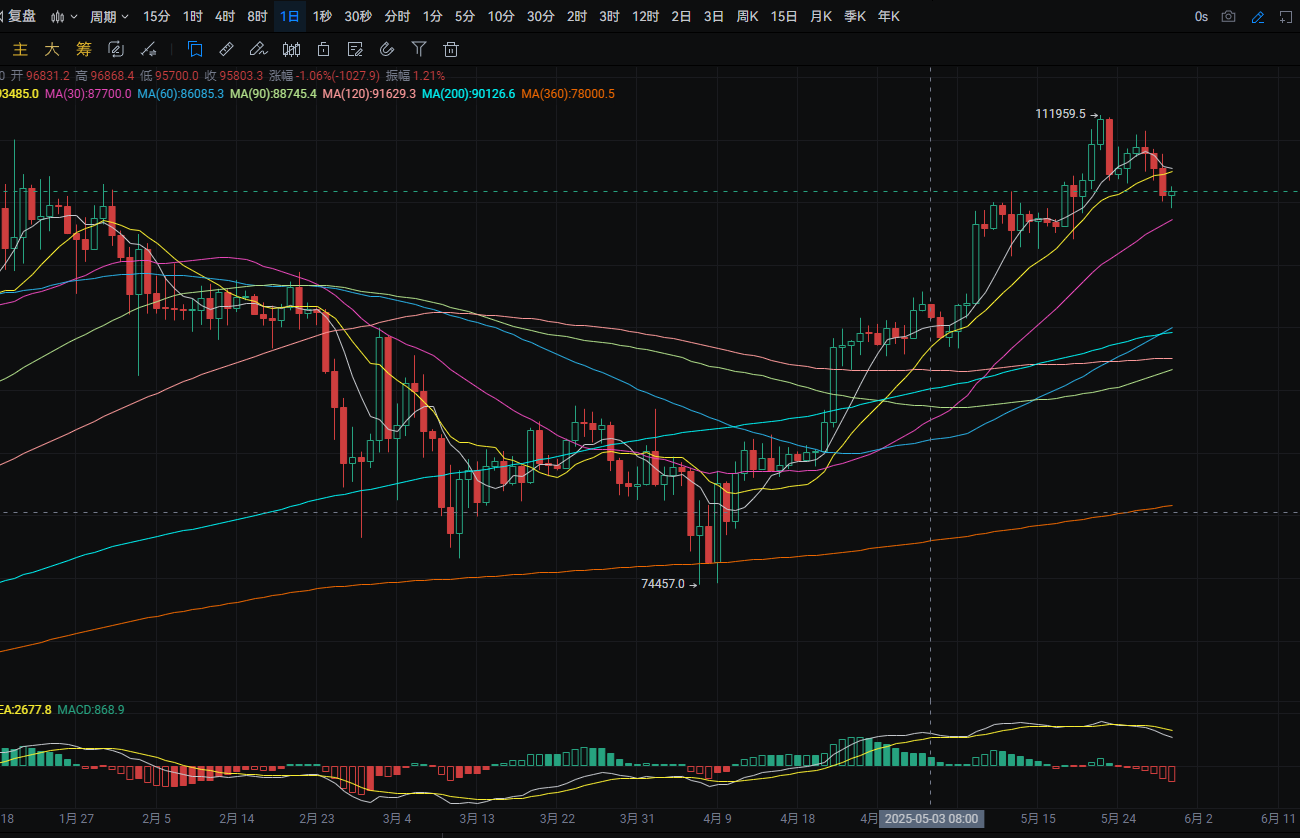
Bitcoin's daily line dropped from a high of around 108,850 to a low of around 105,050 yesterday, closing around 105,600. The support level is around 105,000; if it breaks, it can be seen near MA30. A pullback can be used to buy near this level. The resistance level is around MA14; if it breaks, it can be seen near 108,950. MACD shows increasing bearish momentum. The four-hour support level is around 105,100; if it breaks, it can be seen near 104,050. A pullback can be used to buy near this level. The resistance level is around MA90; if it breaks, it can be seen near MA30. MACD shows decreasing bearish momentum.
ETH
Analysis
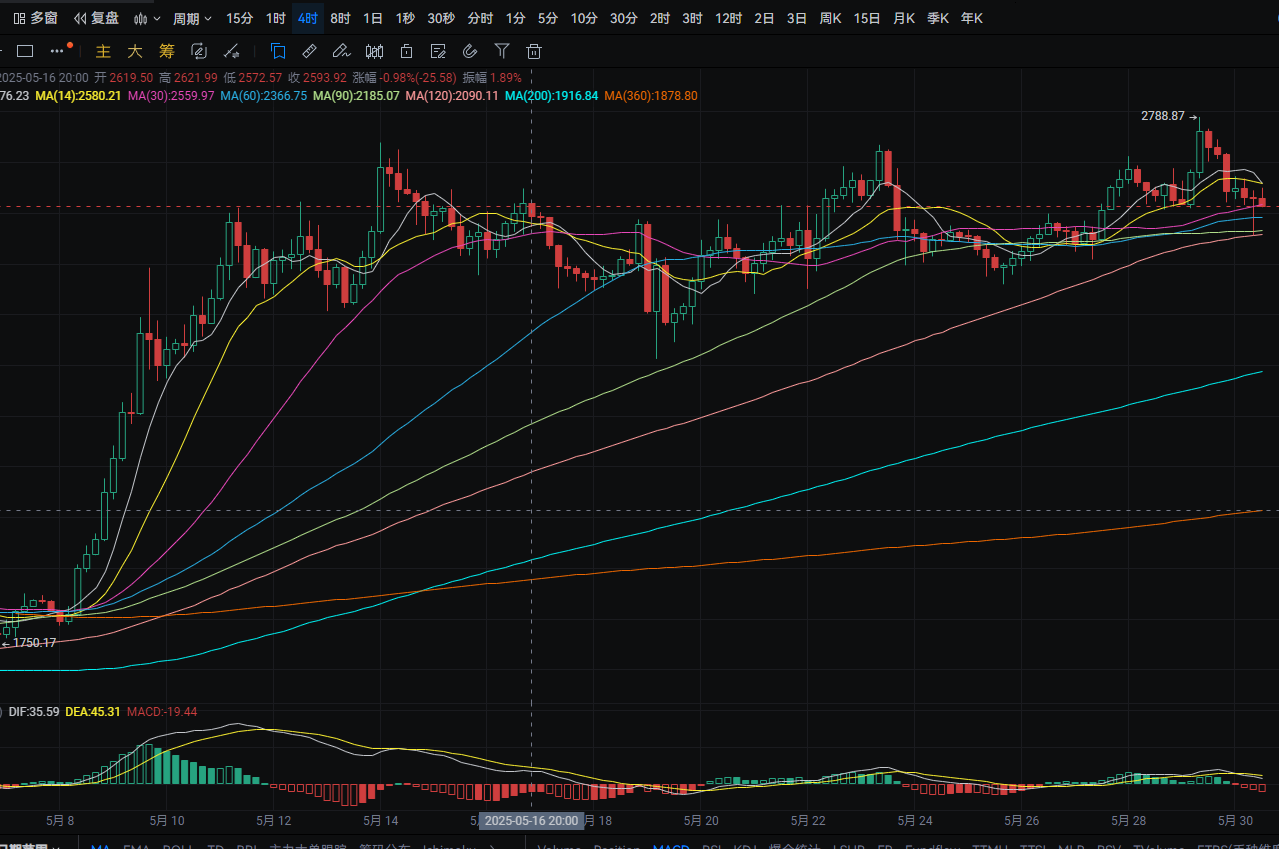
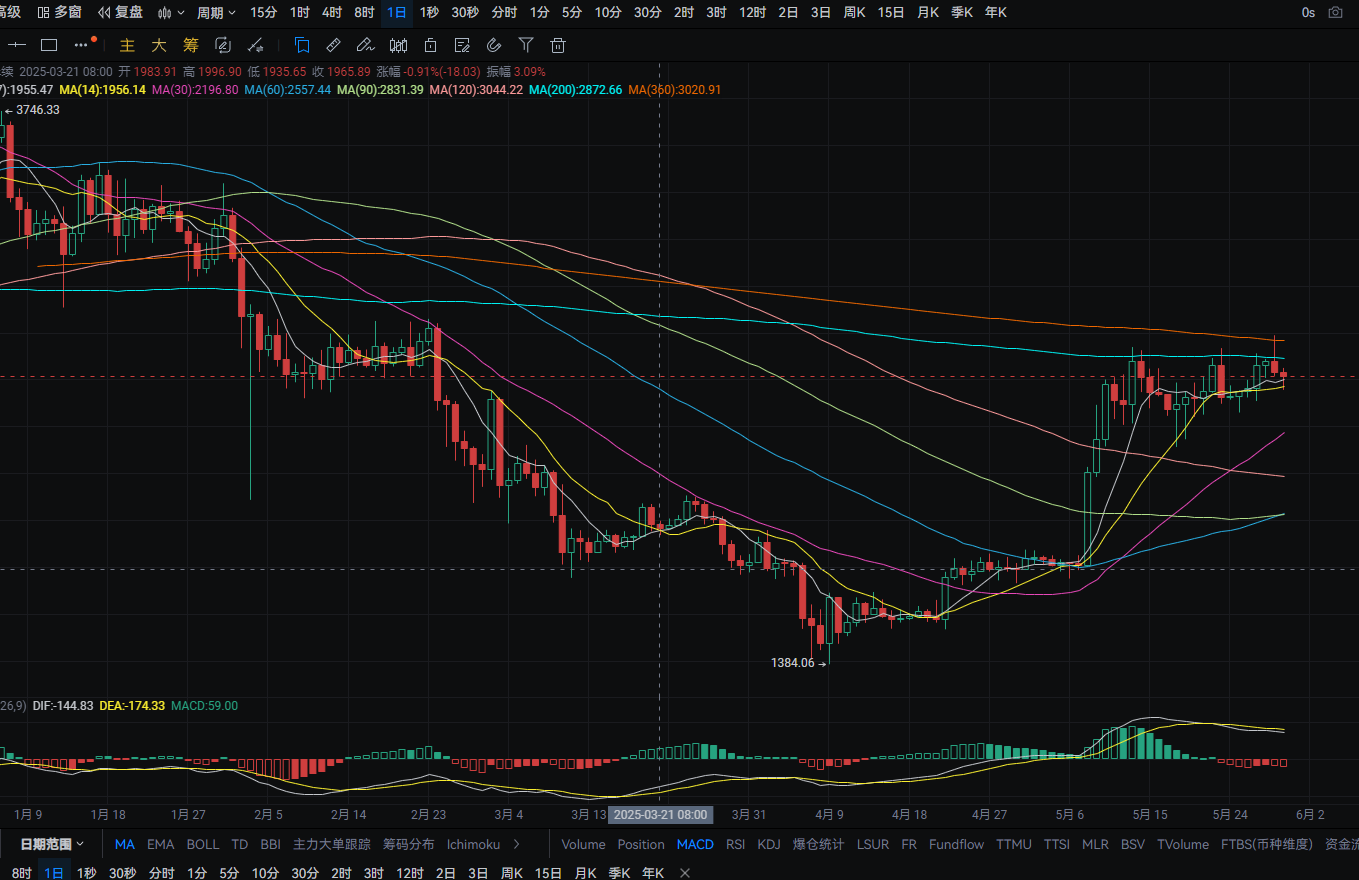
Ethereum's daily line dropped from a high of around 2,790 to a low of around 2,615 yesterday, closing around 2,630. The support level is around MA14; if it breaks, it can be seen near 2,510. A pullback can be used to buy near this level. The resistance level is around MA200; if it breaks, it can be seen near 2,730. A rebound to this level can be used to short. MACD shows increasing bearish momentum. The four-hour support level is around MA60; if it breaks, it can be seen near MA120. A pullback can be used to buy near this level. The resistance level is around MA14; if it breaks, it can be seen near 2,690. MACD shows increasing bearish momentum, forming a death cross.
Disclaimer: The above content is personal opinion and for reference only! It does not constitute specific operational advice and does not bear legal responsibility. Market conditions change rapidly, and the article has a certain lag. If you have any questions, feel free to consult.
免责声明:本文章仅代表作者个人观点,不代表本平台的立场和观点。本文章仅供信息分享,不构成对任何人的任何投资建议。用户与作者之间的任何争议,与本平台无关。如网页中刊载的文章或图片涉及侵权,请提供相关的权利证明和身份证明发送邮件到support@aicoin.com,本平台相关工作人员将会进行核查。


