Crypto News
May 29 Hot Topics:
1. U.S. Vice President Vance: About 50 million Americans hold BTC, and it will soon rise to 100 million.
2. The U.S. International Trade Court blocks Trump's "Liberation Day" tariffs, ruling that imposing comprehensive tariffs exceeds authority.
3. Circle freezes addresses involved in the Libra scandal, locking up 57.65 million USDC.
4. Telegram founder: Telegram has reached a partnership with xAI and received $300 million in cash and equity from xAI.
5. James Wynn has fully reversed the $85.29 million profit earned through contracts and is now starting to incur losses on the principal.
Trading Insights
During trading, how can we determine the trend direction and entry timing through different time frames?
- Core Principle: Big Cycle Steers, Small Cycle Rows
Big Cycle: Strategic Beacon The big cycle, such as daily and weekly charts, serves as the strategic framework for trading. It clearly informs investors: ① Trend Direction: Determines whether the market or individual coins are in an uptrend, downtrend, or consolidation phase, addressing the question of "can we trade?" For example, if the weekly chart shows an upward trend, it indicates an overall upward movement, making long positions more reasonable. ② Key Positions: Highlights important support and resistance levels, answering "where is important." These positions significantly impact price movements and are crucial references for trading decisions.
Small Cycle: Tactical Blade The small cycle, like 4-hour and 15-minute charts, is a tactical tool for trading. It focuses on: ① Entry Timing: Accurately capturing suitable entry points, addressing the question of "when to trade." For instance, after confirming an upward trend in the big cycle, one can use the small cycle to find the end of a pullback and the timing to enter again. ② Risk Control: Helps determine stop-loss positions, answering "how to stop loss." Based on the volatility characteristics and key positions of the small cycle, reasonable stop-loss settings can control trading risks.
- The Interaction Secrets of Big and Small Cycles
- Suppression Effect: When the small cycle reaches a high point in the big cycle, the big cycle will suppress the small cycle. At this time, the upward momentum of the small cycle may be restrained, and prices may experience a pullback or stagnation.
- Guiding Effect: If the small cycle successfully breaks through the key high point of the big cycle, the small cycle will guide the big cycle. This may indicate an acceleration or reversal of the trend, serving as an important trading signal.
- Pullback Support: In an upward trend of the big cycle, when the small cycle pulls back to the support level of the big cycle's low point, if it can gain effective support, it is likely to continue the upward trend, allowing investors to remain bullish and consider adding positions or holding.
- Healthy Upward Characteristics: A healthy upward trend will show continuous new highs and higher lows across both big and small cycles. This reflects that bullish forces continue to dominate, and the trend has strong continuity.
LIFE IS LIKE
A JOURNEY ▲
Below are the real trading signals from the Big White Community this week. Congratulations to the friends who followed along. If your trades are not going well, you can come and test the waters.
Data is real, and each trade has a screenshot from the time it was issued.
**Search for the public account: *Big White Talks Coins*
BTC
Analysis
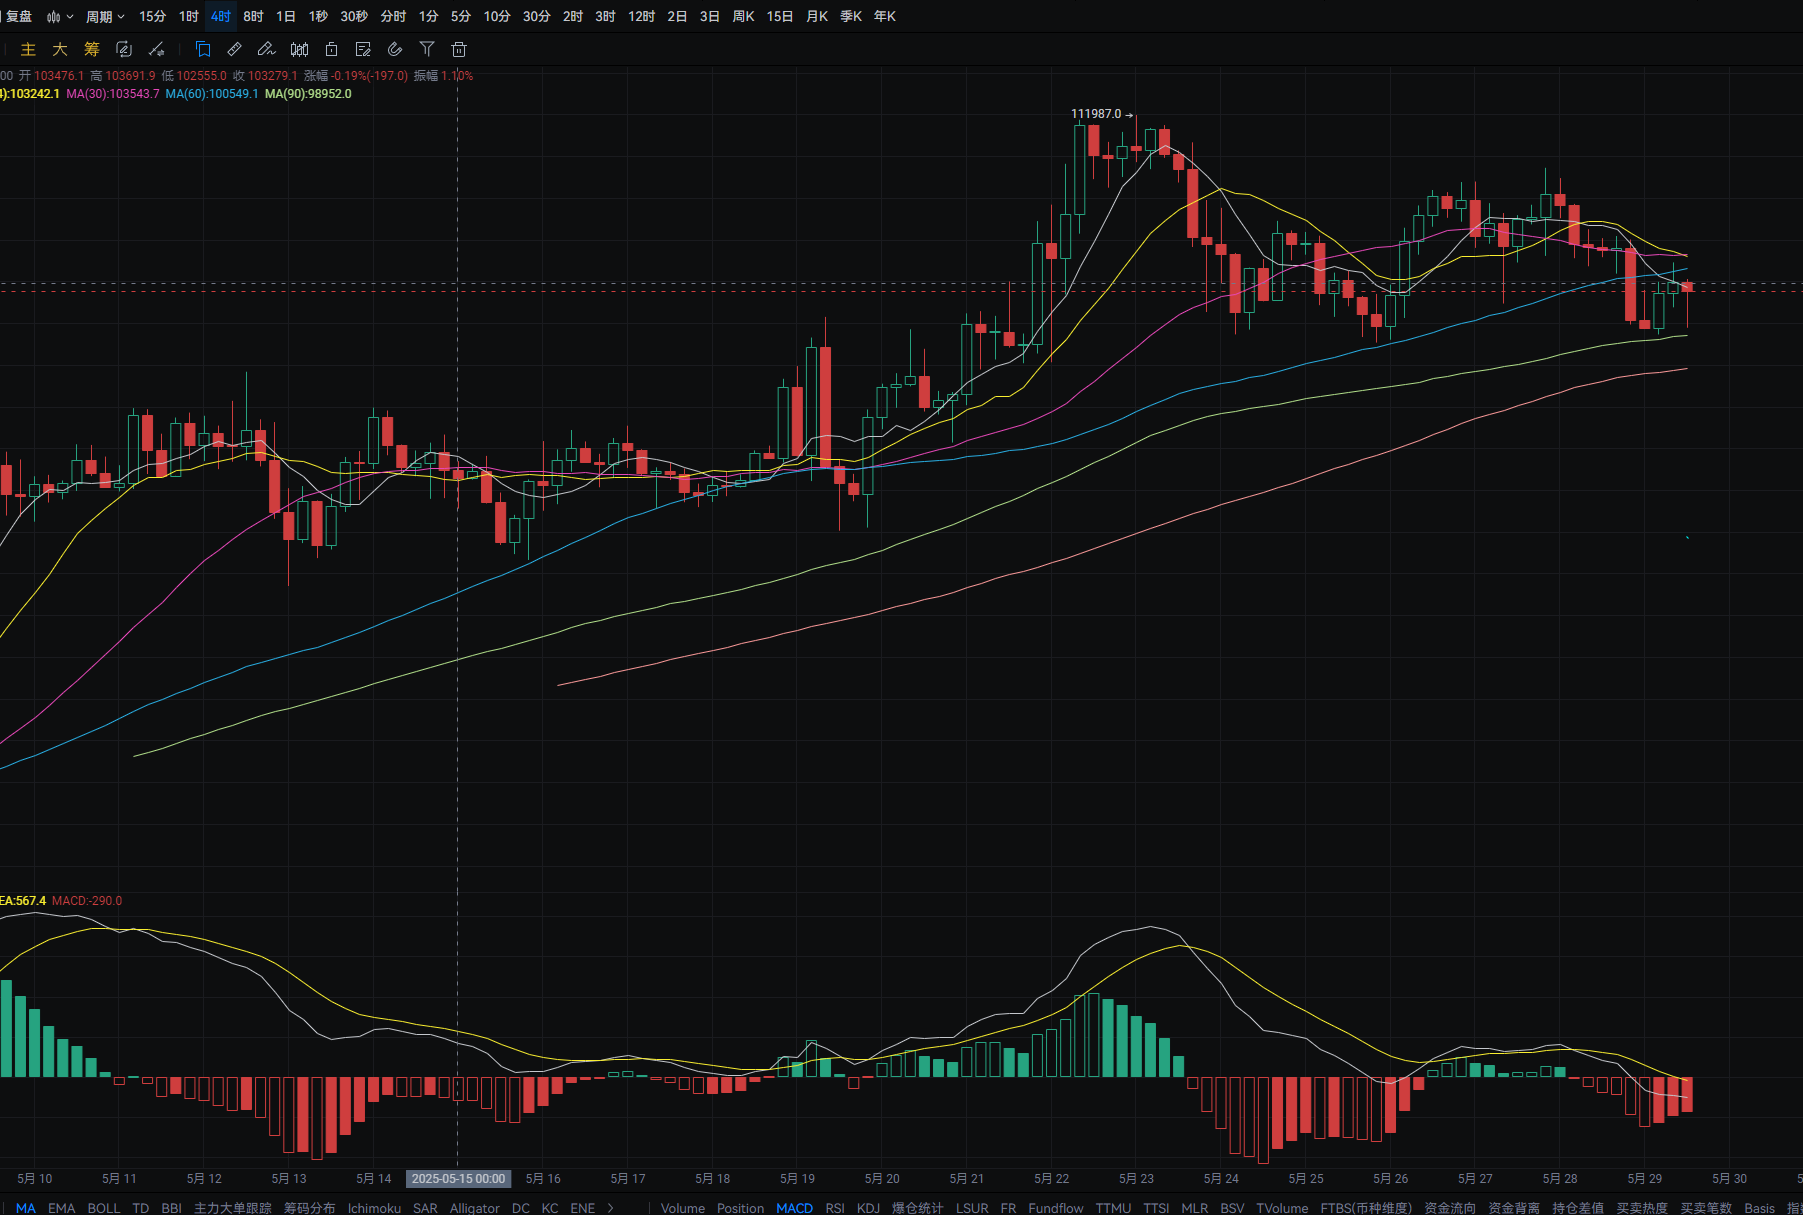
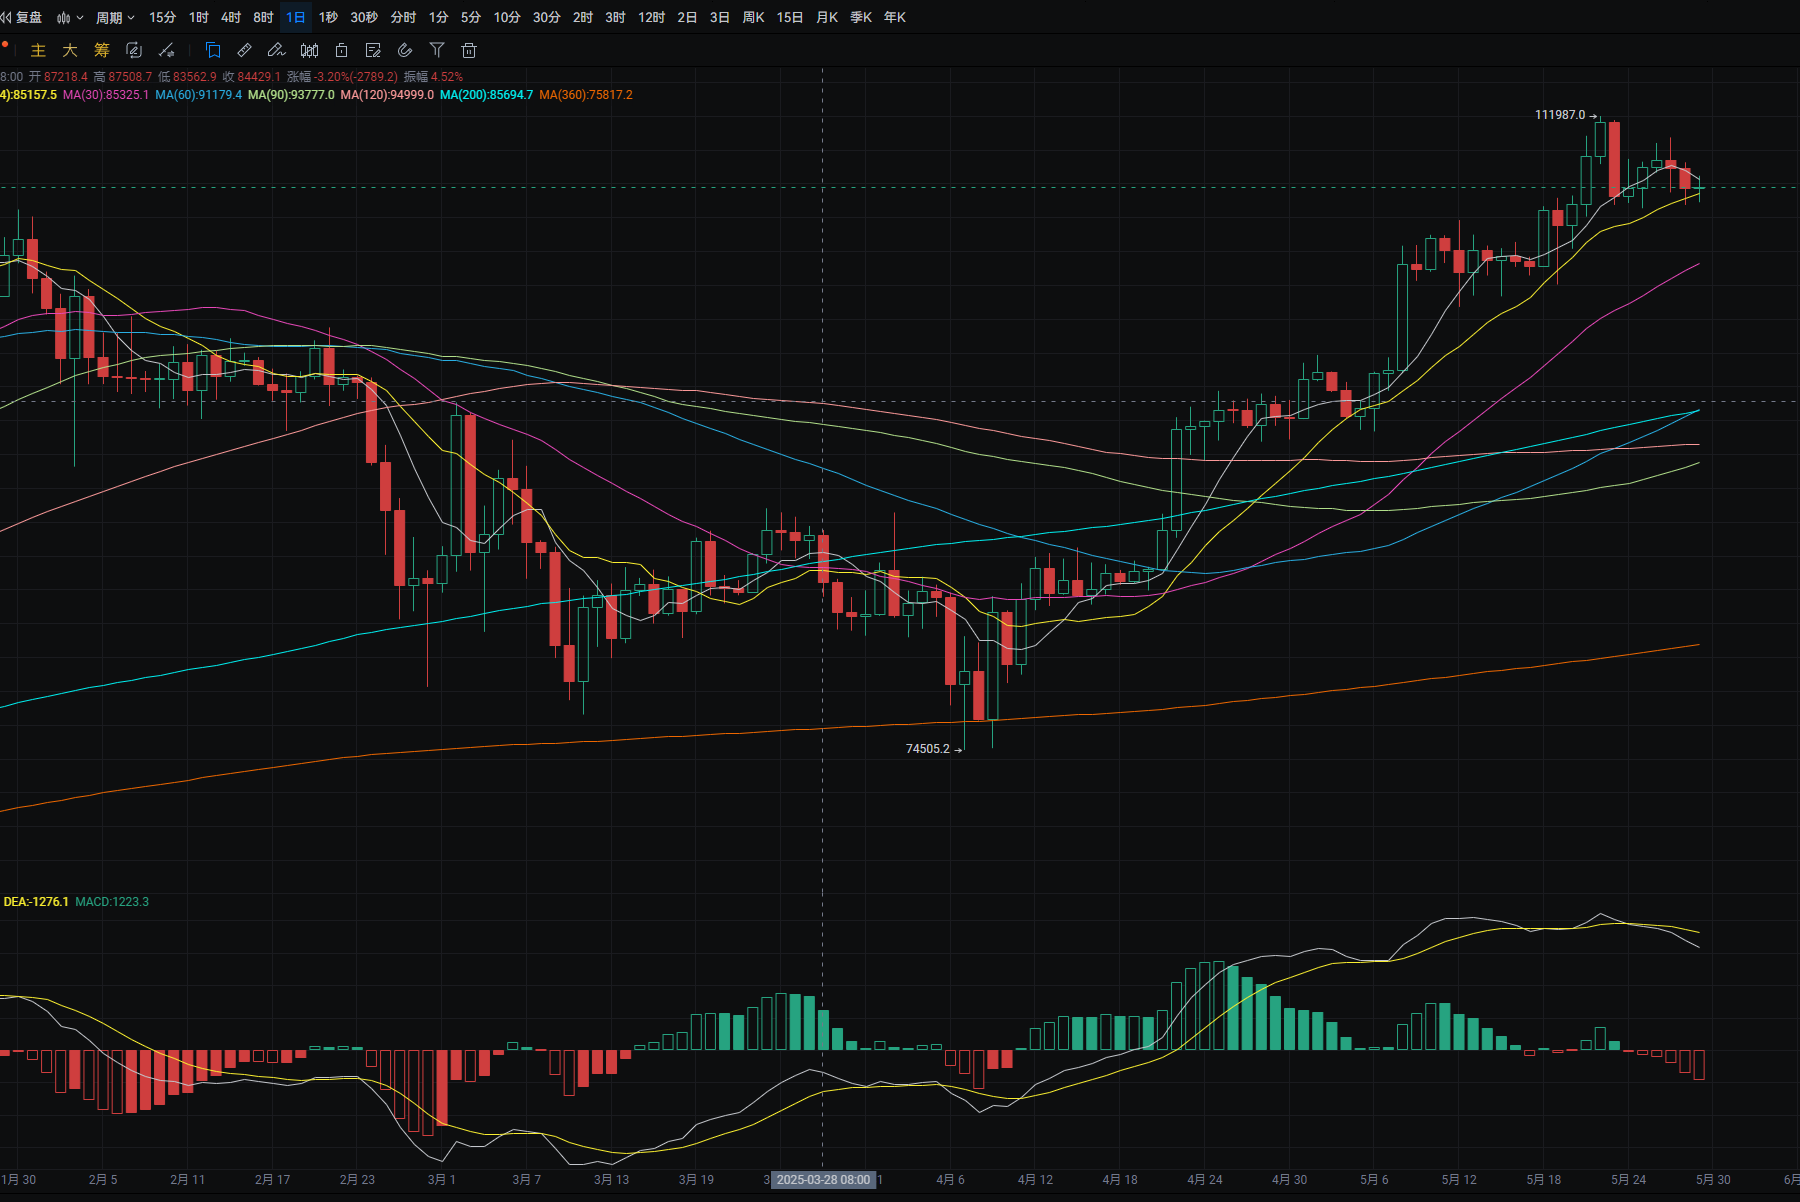
The daily BTC chart fell from a high of around 109,250 to a low of around 106,750 yesterday, closing around 107,700. The support level is around 106,100; if it breaks, it could drop to around 105,100. A pullback can be used to enter long positions nearby. The resistance level is around 109,500; if it breaks, it could rise to around 111,650. MACD shows increasing bearish momentum. The four-hour support level is near MA90; if it breaks, it could drop to MA120. A pullback can be used to enter long positions nearby. The resistance level is near MA30; if it breaks, it could rise to around 110,000. MACD shows decreasing bearish momentum. Short-term entries can be made around 106,100-105,100 for long positions, with a rebound target around 108,300.
ETH
Analysis
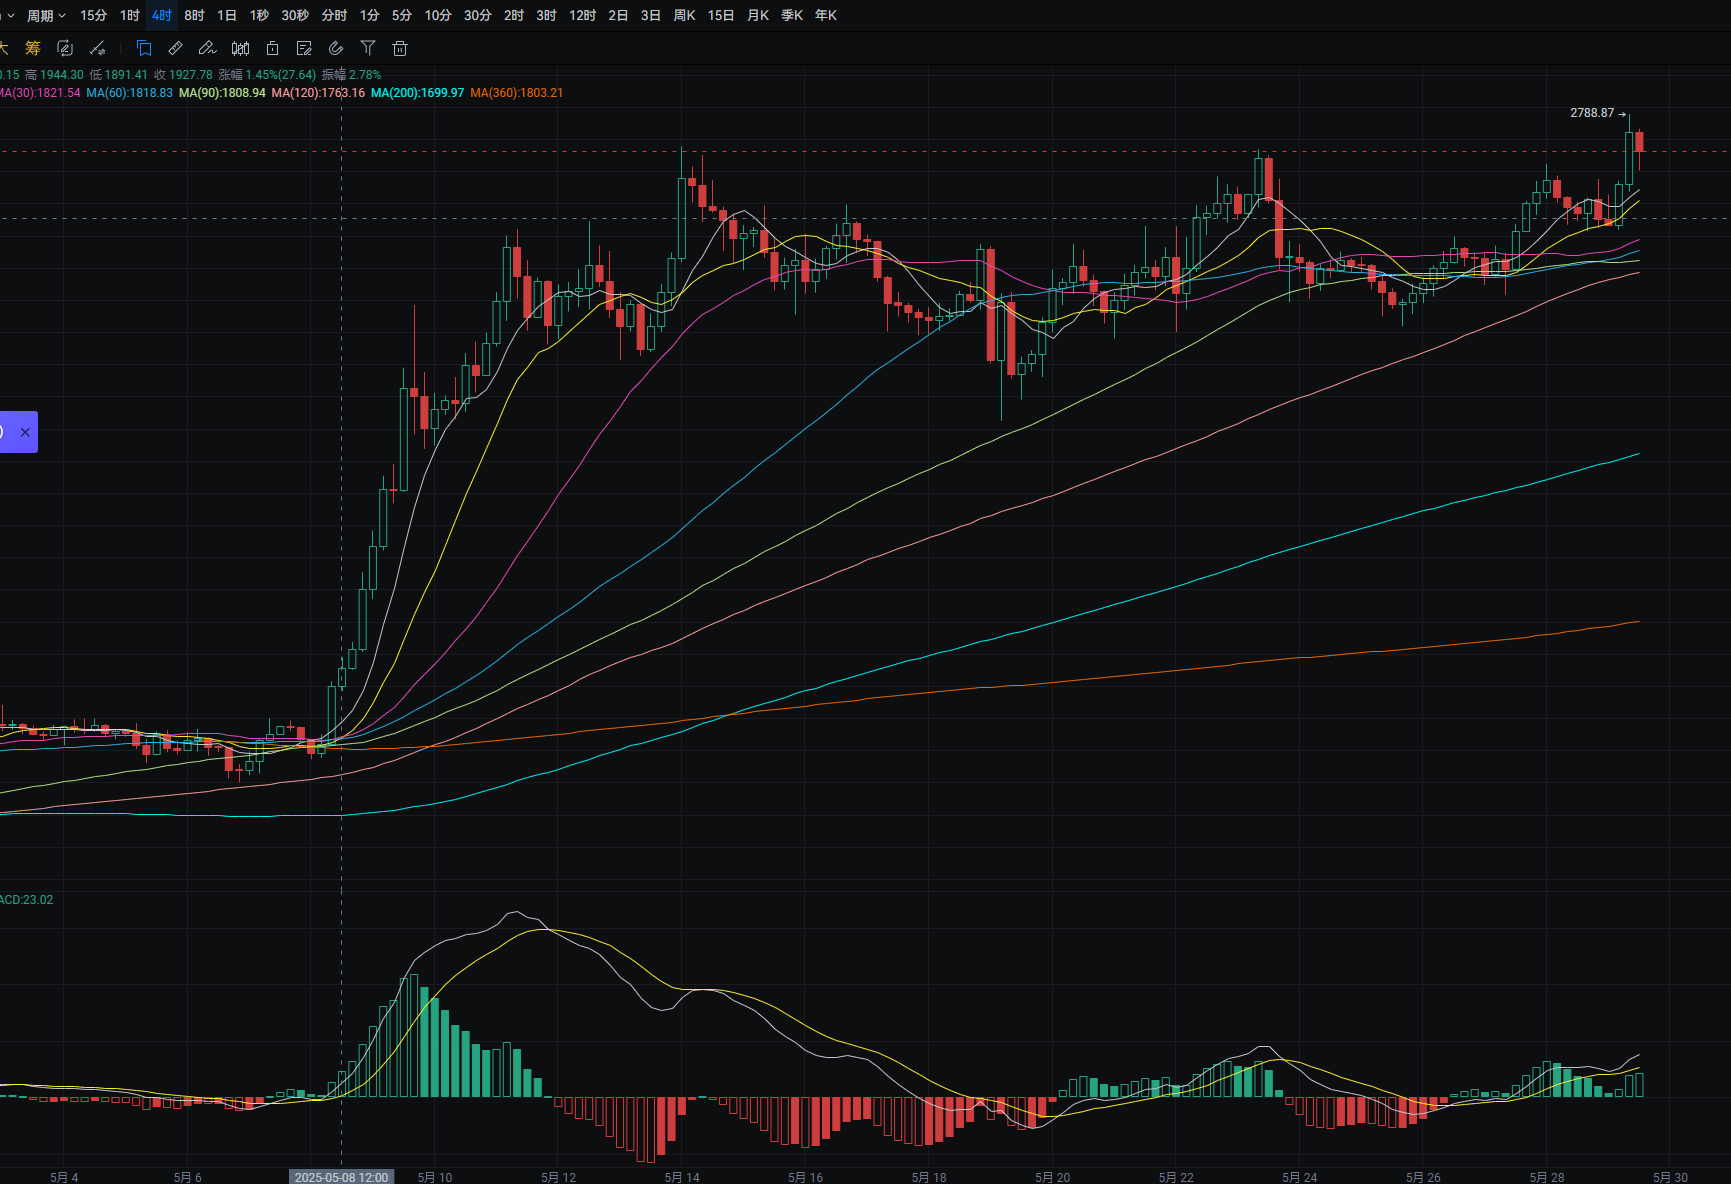
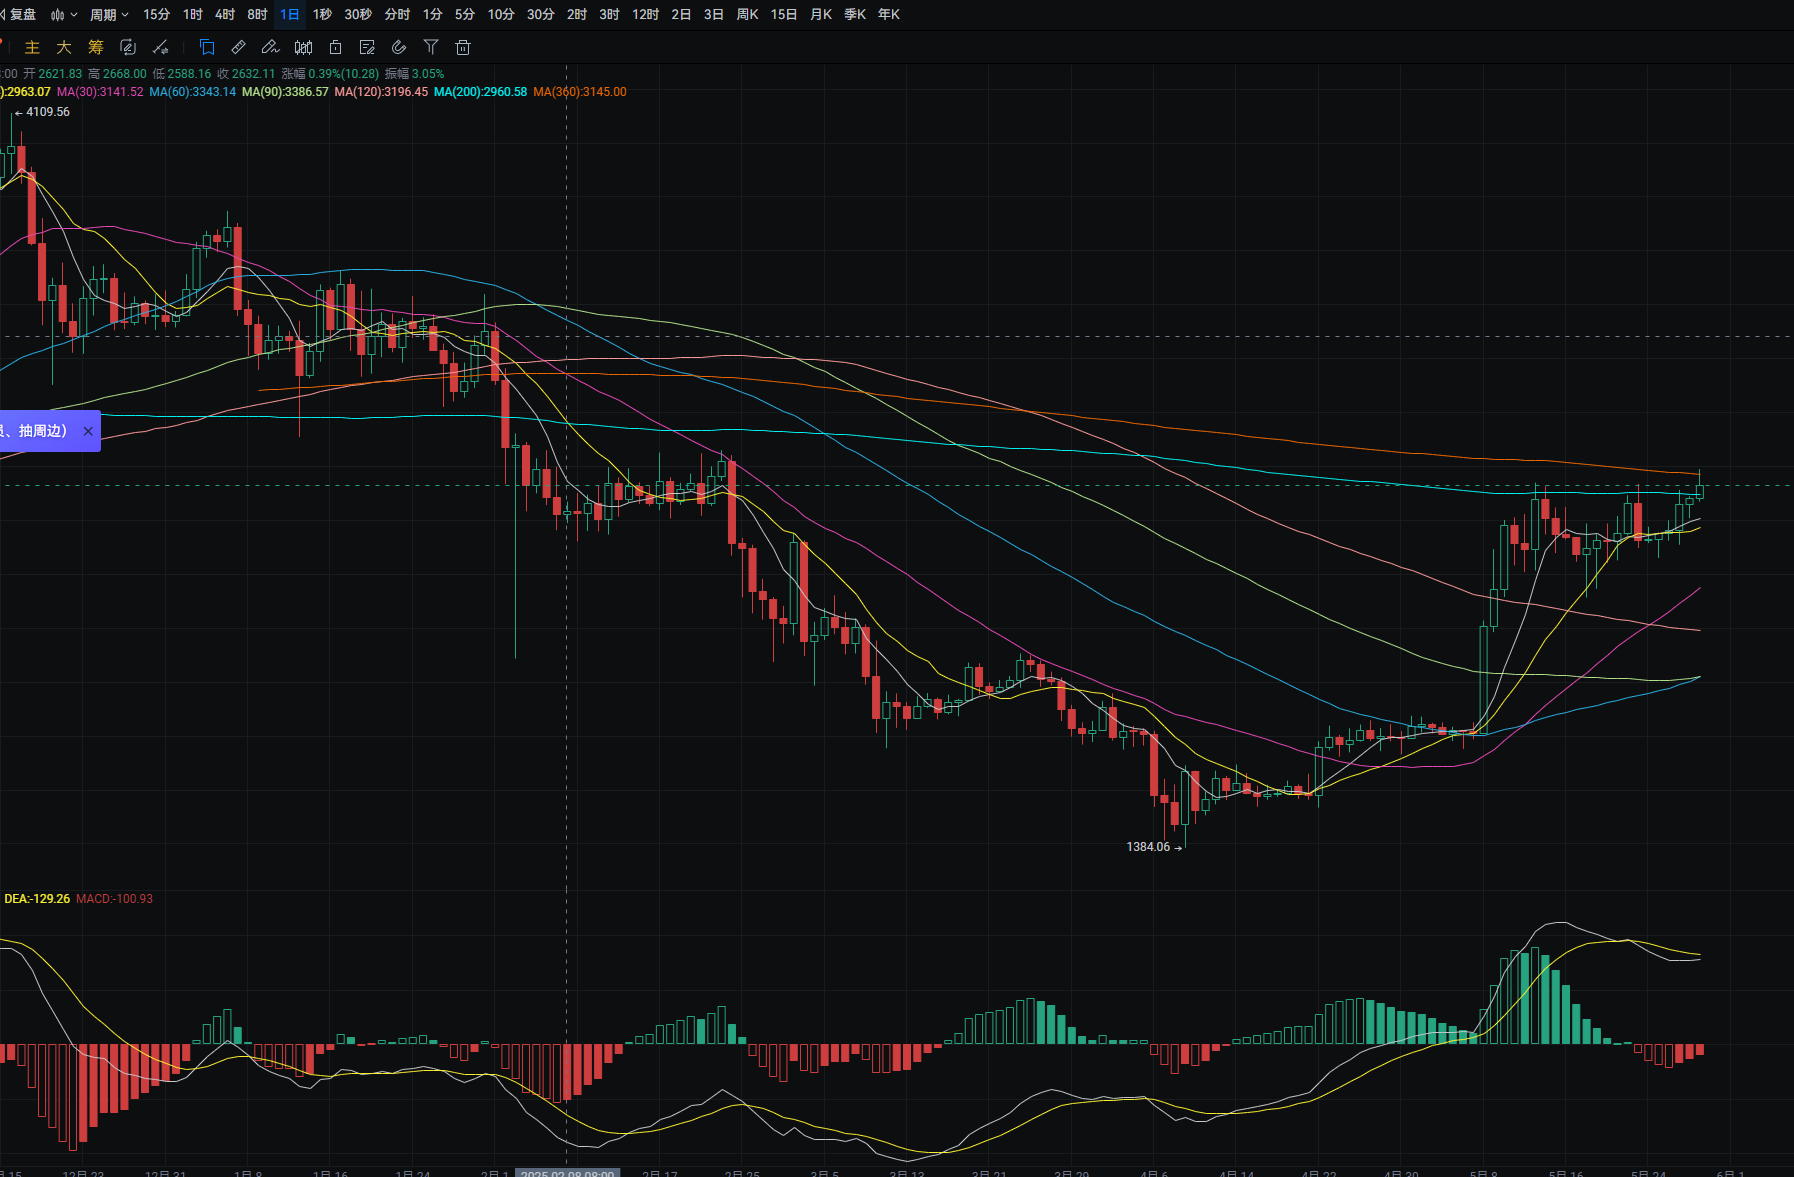
The daily ETH chart rose from a low of around 2,605 to a high of around 2,690 yesterday, closing around 2,680. The support level is near MA200; if it breaks, it could drop to around the MA7 moving average. A pullback can be used to enter long positions nearby. The resistance level is near the MA360 yearly line; if it breaks, it could rise to around 2,865. A rebound to nearby levels can be used to enter short positions. MACD shows decreasing bearish momentum. The four-hour support level is near MA14; if it breaks, it could drop to MA30. A pullback can be used to enter long positions nearby. MACD shows increasing bullish momentum. Short-term entries can be made around 2,708.7 for long positions, with a rebound target around 2,745-2,825. A rebound to around 2,843-2,890 can be used to enter short positions, targeting around 2,760-2,700. Mid-term entries can be made around 2,658-2,600 for long positions, with a rebound target around 2,745.
Disclaimer: The above content is personal opinion and for reference only! It does not constitute specific operational advice and does not bear legal responsibility. Market conditions change rapidly, and the article may have some lag. If you have any questions, feel free to consult.
免责声明:本文章仅代表作者个人观点,不代表本平台的立场和观点。本文章仅供信息分享,不构成对任何人的任何投资建议。用户与作者之间的任何争议,与本平台无关。如网页中刊载的文章或图片涉及侵权,请提供相关的权利证明和身份证明发送邮件到support@aicoin.com,本平台相关工作人员将会进行核查。


