Original Author: ElonMoney Research
Original Translation: Felix, PANews
This article analyzes indicators such as MVRV Z-Score, Energy Value Oscillator, Bitcoin Heater, and historical data. Although historical data is a useful reference, its accuracy may decrease in the current environment, as participants like Strategy, Metaplanet, and ETFs were not present in the 2021 cycle.
MVRV Z-Score
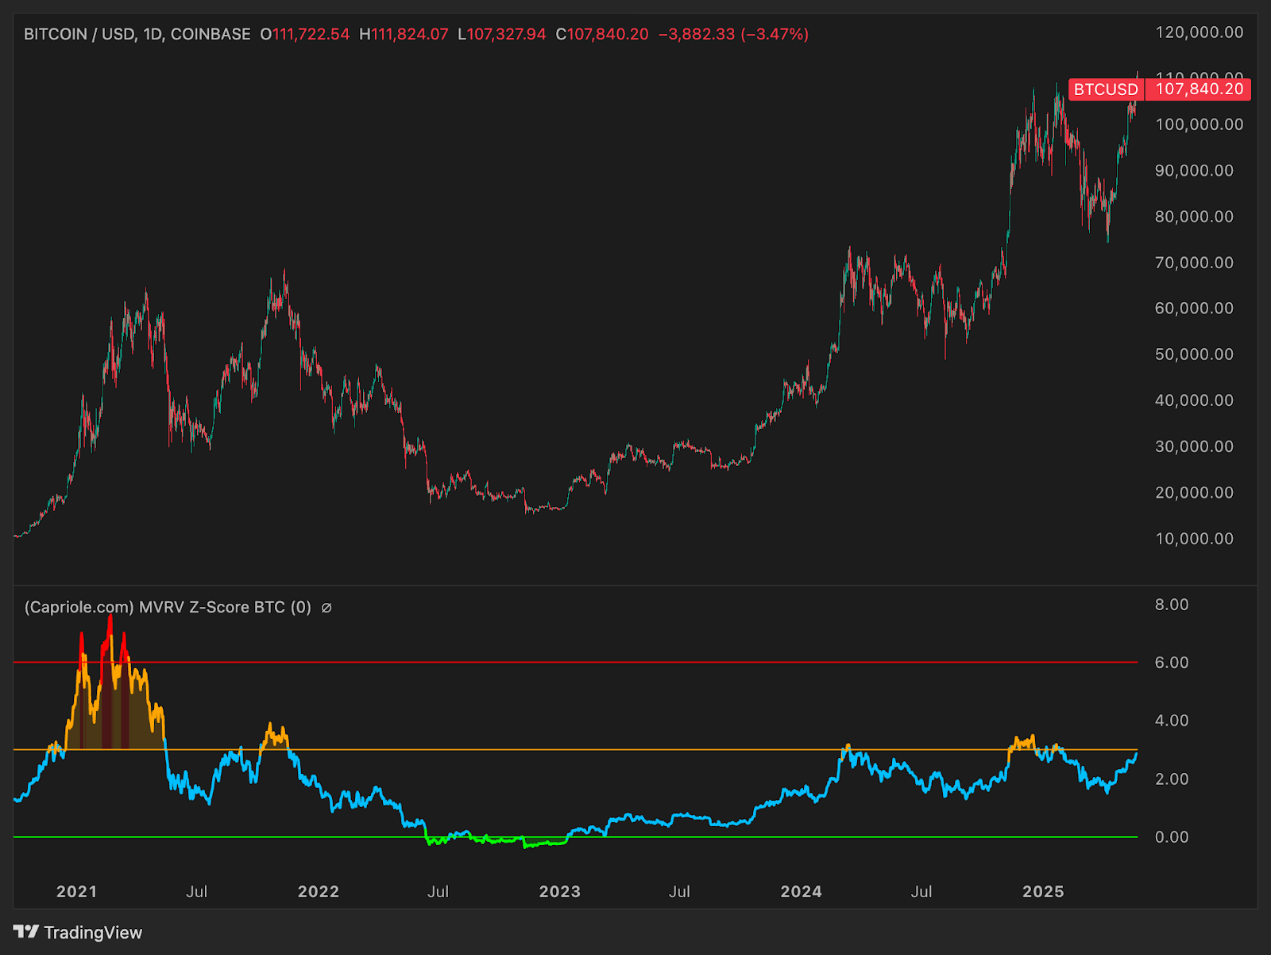
The MVRV Z-Score is an indicator that measures market valuation by comparing the degree to which an asset is undervalued or overvalued relative to its fair value, aiming to identify market cyclical tops and bottoms. The chart shows that the current MVRV Z-Score is around 2 to 3, in a neutral zone, far from the overheating values seen at market tops. Historically, the peaks of Bitcoin cycles push this indicator into the red zone (around 7 to 9), indicating a significant disconnection between market cap and realized cap. Currently, the indicator is slightly above 2, in the blue/yellow zone, suggesting that Bitcoin is not overvalued.
For context: at the beginning of 2021, the MVRV Z-Score exceeded 7 before Bitcoin reached around $60,000 to $65,000. During the bear market of 2022, the indicator fell below 0 (green zone), indicating that the market was oversold.
From a technical perspective, there is still significant room for growth before the end of this cycle. Even if Bitcoin reaches around $100,000 to $110,000, it would not be considered "expensive" according to MVRV standards. If Bitcoin replicates the structural patterns of past tops, the MVRV Z-Score is expected to rise to 5 to 7 or higher.
This implies that there will be significant upward potential in the future market. The basic inference suggests that MVRV tops often occur when BTC trading prices are far above $100,000—potentially over $200,000, depending on changes in realized market cap in the coming months.
Energy Value Oscillator
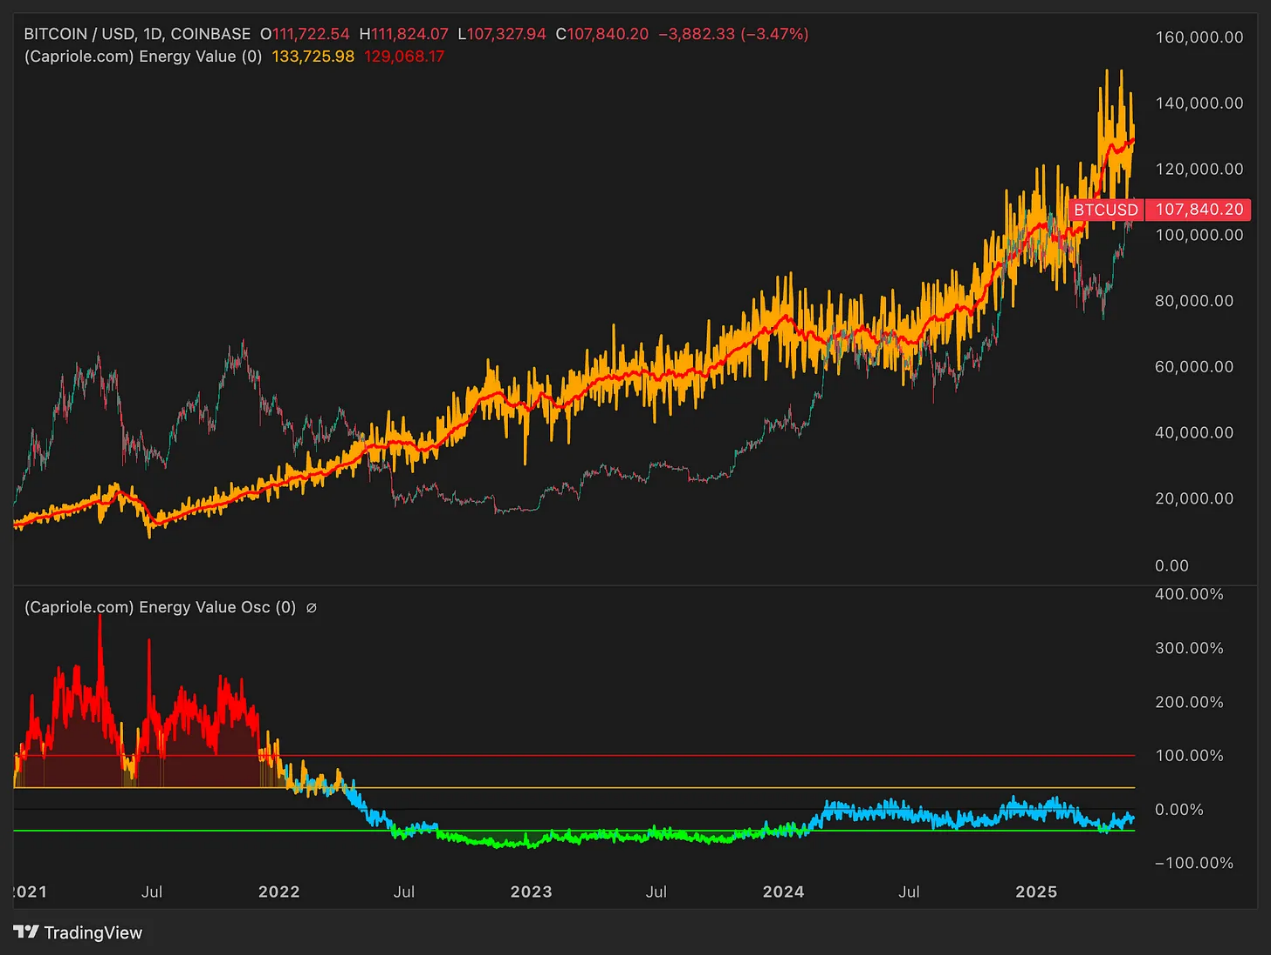
This indicator measures Bitcoin's "fair value" based on total energy (Energy Value = Hash Rate × Energy Efficiency). The red-orange line in the above chart marks the energy-based fair value—approximately $130,000 by mid-2025. The blue oscillating indicator below tracks the current price's deviation from this benchmark.
Historically, when Bitcoin's trading price is far above its energy value, the oscillating indicator enters the red zone (valuations above 100%). At the beginning of 2021, Bitcoin's price was around $60,000, which was over 100% higher than its energy value. Conversely, in 2022, Bitcoin's trading price fell below its energy value, and the oscillating indicator was in the green (undervalued) zone.
Currently, the oscillating indicator is near zero, with Bitcoin's trading price ($107,000 to $110,000) being 10% to 20% lower than the model-calculated fair value. This indicates that Bitcoin is not overheated. If energy value reaches around $150,000 in the second half of 2025, and prices trade at a 50% to 100% premium (common near cycle peaks), this would imply a price range between $225,000 and $300,000.
In other words: the Energy Value Oscillator confirms that Bitcoin still has ample room for growth. The market is unlikely to be in a "severely overvalued" state until this oscillating indicator breaks above +100%.
Bitcoin Heater (Derivatives Overheating Indicator)
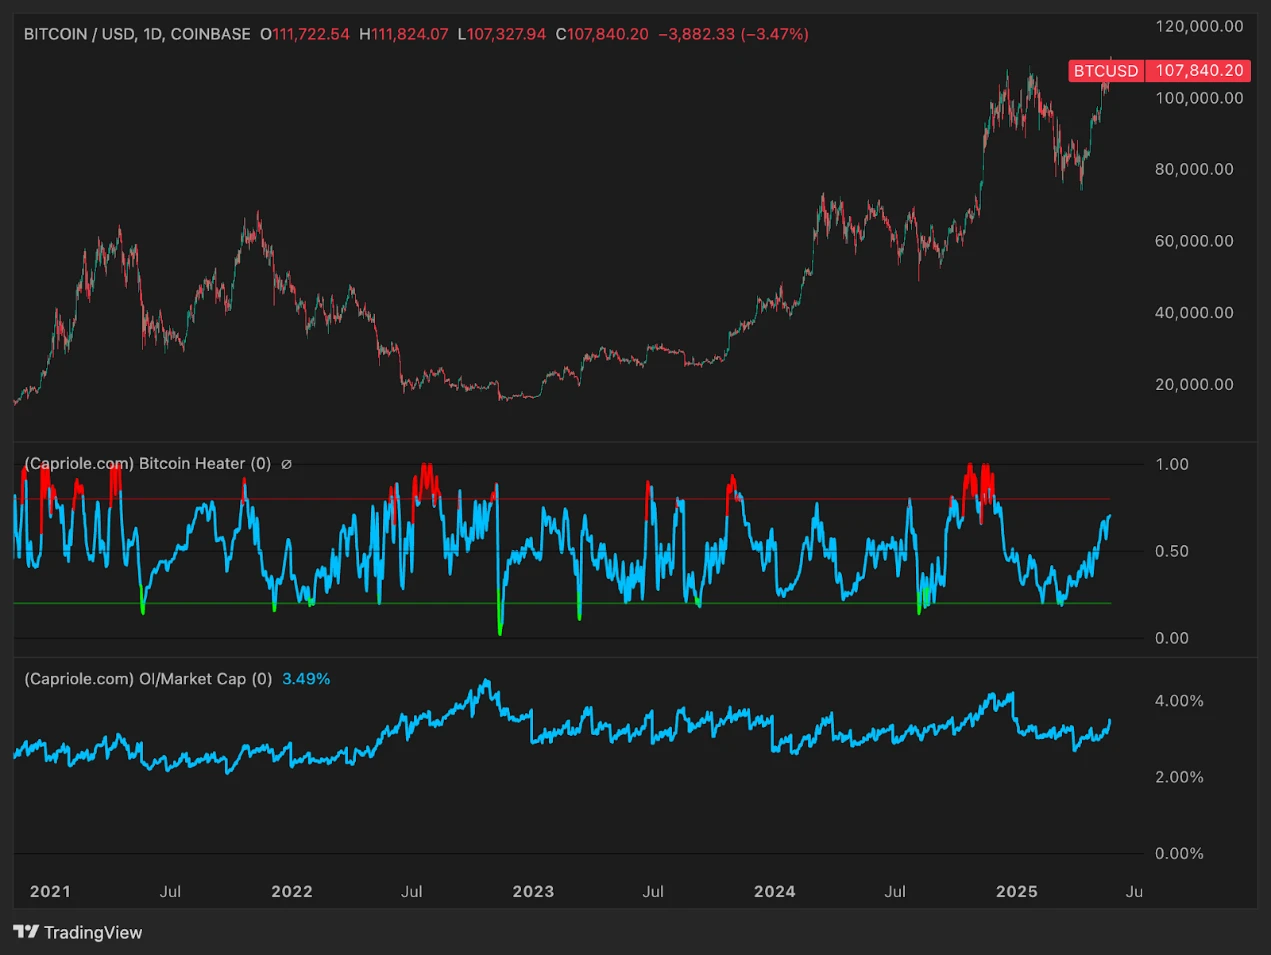
The Bitcoin Heater indicator integrates derivatives sentiment (funding rates, basis, options skew) into a single index ranging from 0 to 1. A value close to 1.0 indicates a bubble, aggressive long positions, and high leverage. A value around 0.0 to 0.3 indicates market cooling or risk-averse sentiment.
In previous cycles (especially in 2021), this indicator often broke above 0.8 before local corrections. However, during the strong bull market (Q4 2020 to Q1 2021), the indicator remained high without immediately triggering a reversal. As of mid-2025, the indicator is around 0.6 to 0.7, in a warm state but not overheated.
This suggests that we have not yet entered the final euphoric phase of the cycle. In the last upward phase, this indicator could reach 0.8 to 1.0. Before that, the market still has room to rise. It is reasonable for the indicator to periodically exceed 0.8 before peaking, but the ultimate peak is likely to align with sustained red zone indicators.
Macro Index Oscillator
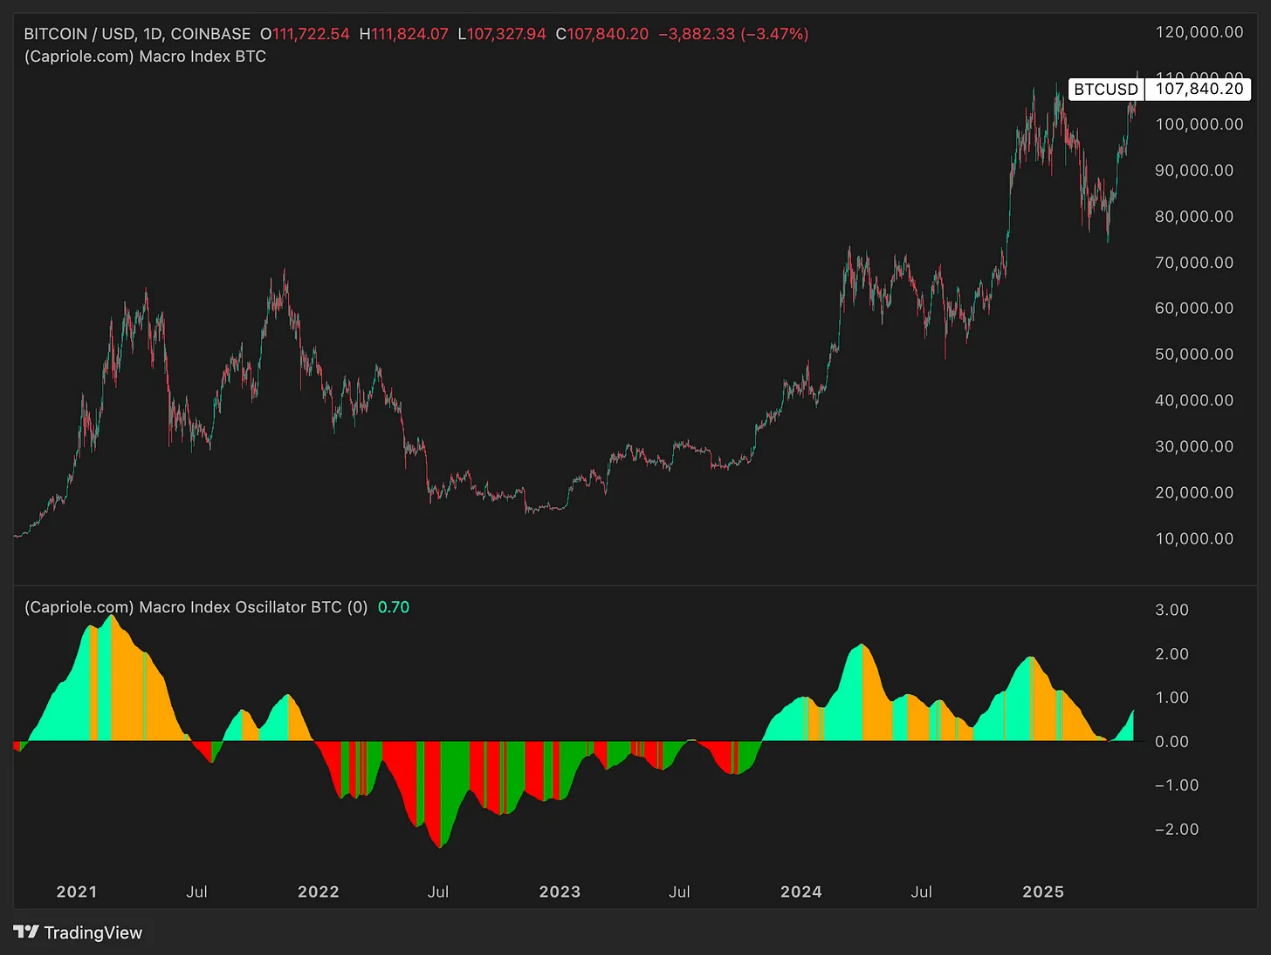
This composite index uses over 40 fundamental, on-chain, and market indicators to assess Bitcoin's macro phase. An index above 0 indicates expansion; an index below 0 indicates contraction or recovery.
In previous bull market cycles, this indicator transitioned from negative territory to strong positive territory—peaking near 2 to 3 in 2021. It fell below -1 at the bottom in 2022. Currently, the macro index is about +0.7—clearly in a growth phase but still far below extreme levels of euphoria.
This suggests that the cycle may be in the mid-expansion phase. As the cycle progresses towards the end of 2025, the index is expected to climb above 2.0. Bitcoin still has room to rise before core network activity stagnates or reverses. There are currently no signs of fatigue.
Volume Summer (Liquidity/Participation)
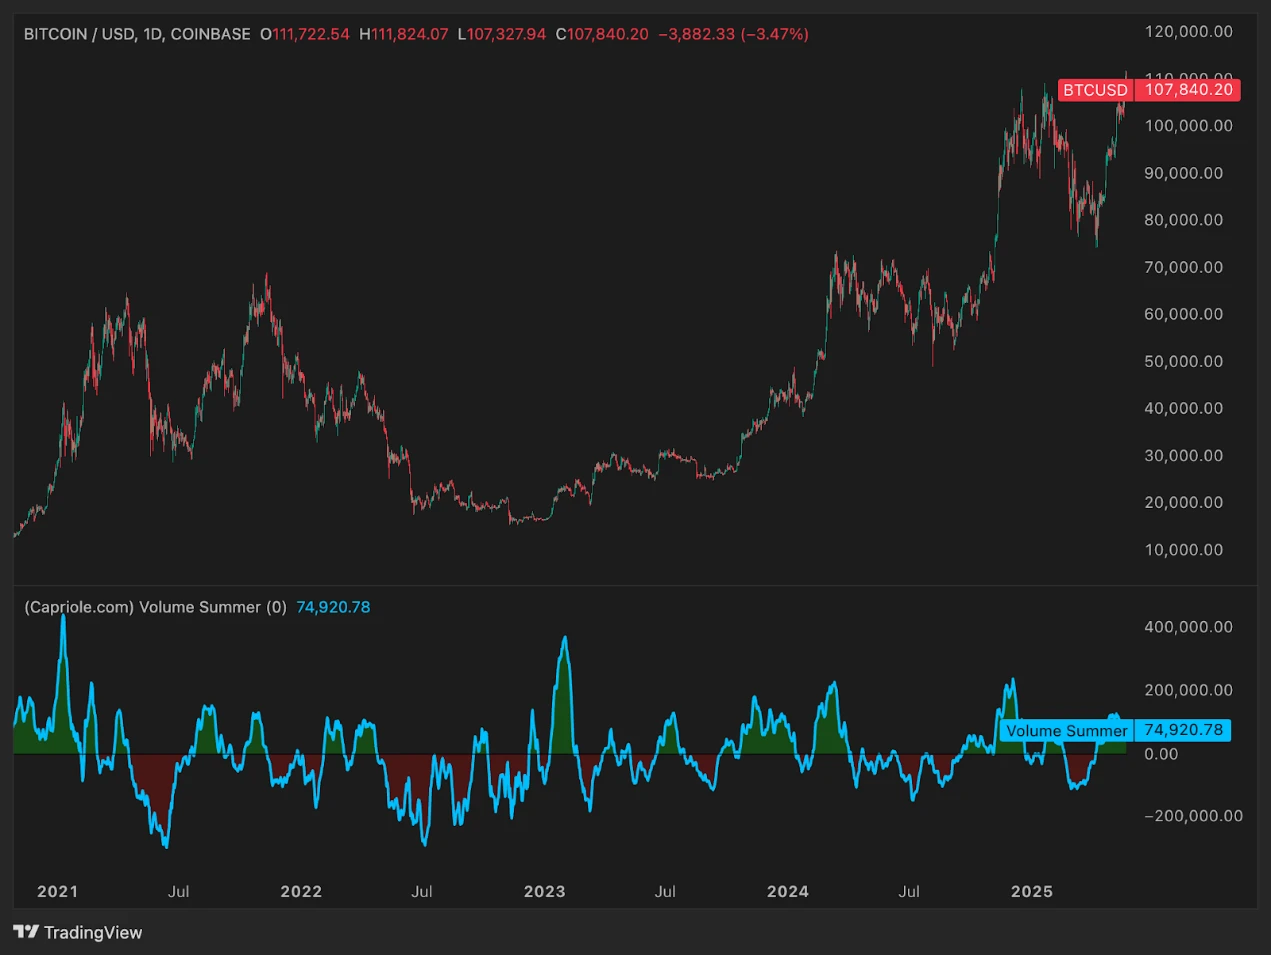
Volume Summer summarizes the net buying volume in the spot and derivatives markets. An indicator above zero indicates net inflow; below zero indicates net outflow or reduced trading activity.
At the beginning of 2021, this indicator soared into the bright green zone—signs of retail FOMO and frenzied participation. In 2022, the indicator fell sharply into the red zone, confirming significant capital withdrawal.
Currently, the Volume Summer indicator is moderately positive (around +75,000)—bullish but far from euphoric levels. This indicates that capital is returning, but the peak liquidity phase may still be ahead (Q4 2025?). If this indicator surges again into the deep green zone, a parabolic rally is expected.
At current levels, liquidity provides support—but is far from peak. There is still more momentum to drive further increases.
Open Interest/Market Cap Ratio (OI/Mcap)
This indicator measures leverage relative to market cap. In 2021, this indicator hovered between 2% and 3%. In 2023, it surged to about 4%, setting the stage for a correction in mid-2024. After the market crash, this indicator reset to 2%, clearing excess leverage.
By mid-2025, this indicator has rebounded to about 3.5%. This indicates that leverage is rising again. While this is favorable for market increases in the short term (providing more momentum for upward trends), it also increases risk. If this indicator rises above 4% - 5% by the end of the year, it may signal a crowded and unstable market, prone to sell-offs.
The final phase of this cycle may be characterized by record leverage—this indicator could reach new highs when prices peak. However, there is still room for growth.
Possible BTC Trends in December This Year
Considering all indicators, it is expected that BTC is in the core phase of a bull market cycle but is not yet nearing its end.
Currently, there are no extreme signals of overvaluation. Most indicators show strong growth but remain below historical peak levels.
Therefore, the basic prediction is that BTC will reach between $210,000 and $230,000 by the end of 2025, more than double the current level. Based on these valuations, the following is expected:
MVRV Z-Score > 7
Energy Value Oscillator > +100%
Bitcoin Heater around 1.0
Volume Summer in the excitement range
OI/Mcap at historical extreme levels
Only then is it possible for the market to transition from the expansion phase to the distribution phase.
免责声明:本文章仅代表作者个人观点,不代表本平台的立场和观点。本文章仅供信息分享,不构成对任何人的任何投资建议。用户与作者之间的任何争议,与本平台无关。如网页中刊载的文章或图片涉及侵权,请提供相关的权利证明和身份证明发送邮件到support@aicoin.com,本平台相关工作人员将会进行核查。


