Recent Bitcoin Trends and Double Top Pattern Analysis
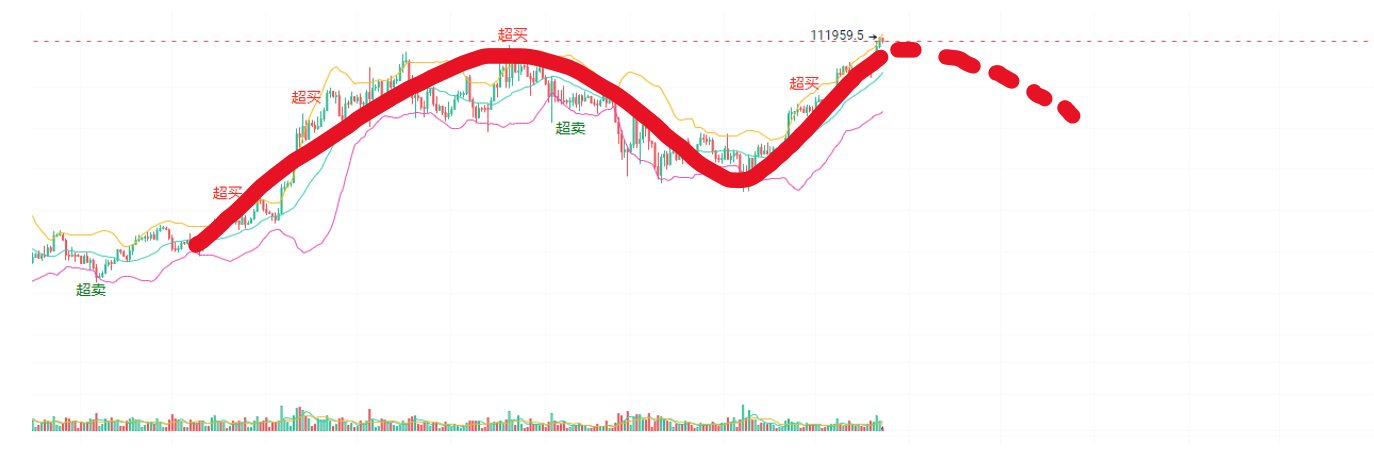
At the beginning of 2025, Bitcoin reached a new high due to institutional capital inflows and market optimism, followed by a pullback for adjustment. Currently, its price has surged again, forming a second peak, resembling the "double top" pattern in technical analysis, which may indicate a price reversal and decline, but further confirmation with technical indicators is needed.
Characteristics and Logic of the Double Top Pattern
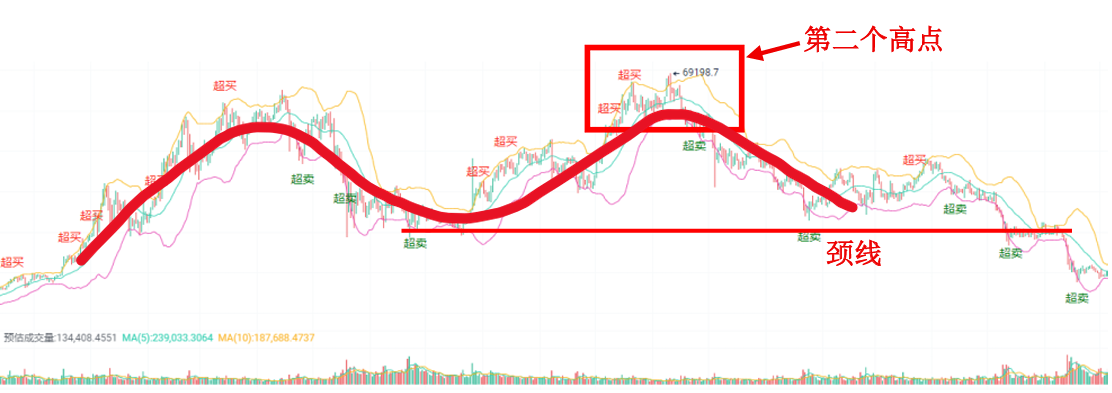
Pattern: Shaped like the letter "M," consisting of two equal peaks and a neckline connecting the low points.
Confirmation: The price breaks below the neckline, confirming the pattern and suggesting a downward trend.
Logic:
First peak: Strong buying but encounters resistance and pulls back.
Second peak: Upward momentum weakens, buyer enthusiasm declines, or selling pressure increases.
Break below the neckline: Sellers dominate, and market sentiment turns bearish.
Current Situation: Bitcoin is at the second peak, and the pattern is not yet confirmed, requiring continuous observation.
Historical Cases of the Double Top Pattern and Profit Opportunities
Historically, the double top pattern has appeared multiple times in Bitcoin and other financial markets. For example, in April and November 2021, Bitcoin formed two peaks around $60,000, subsequently breaking below the neckline, leading to a significant price drop of over 30%.
When identifying the second peak, such as the current Bitcoin trend, different types of investors can adopt various strategies to seize profit opportunities:
If you are an aggressive investor who likes high risk and high return:
You can try shorting near the second peak with a small position, or take profits on your long positions to lock in gains.
Since upward momentum is weakening and the market shows signs of turning, be sure to set stop-loss orders to prevent misjudgment!
If you are a conservative investor who prefers a steady approach:
You can take your time to make decisions; if the price breaks below the neckline, then consider taking action.
The double top indicates weakness in the bulls, and the neckline is a key support level. Once it breaks, a downward trend may begin. At this point, entering short or reducing positions has a higher success rate.
By flexibly applying these strategies, investors can effectively capture market opportunities when the double top pattern is confirmed while balancing risk and return.
Using Custom Indicators to Identify the Double Top Pattern
To more accurately identify the double top pattern, investors can utilize the "custom indicators" feature to analyze price trends and market signals.
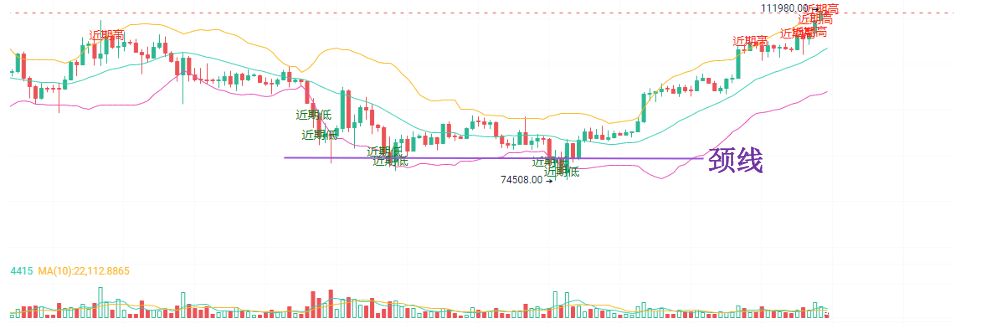
First, set up price monitoring tools to mark recent highs and lows, and draw the neckline to confirm the pattern.
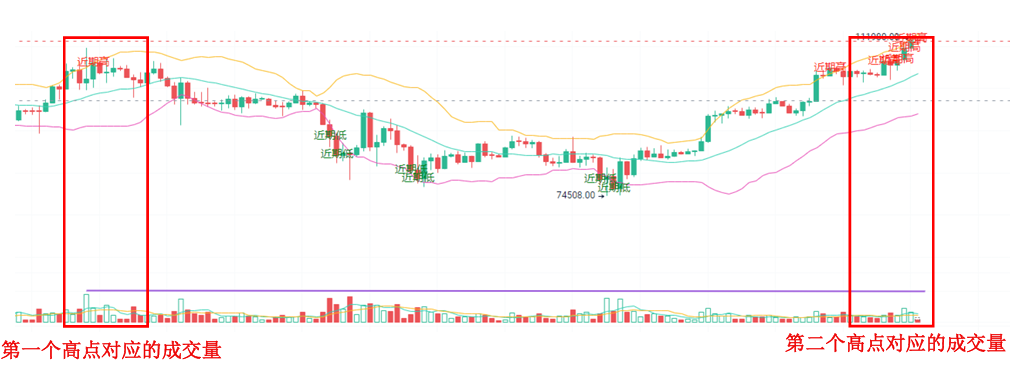
Next, observe changes in trading volume: if the volume at the second peak is lower than at the first peak, it may indicate insufficient upward momentum.
Additionally, pay attention to the RSI indicator; if a top divergence occurs at the second peak, it further validates the possibility of a double top pattern.
Besides directly observing changes in the RSI, you can also use the alert script in the custom indicators feature to automatically notify you when the price rises but the RSI declines. This helps avoid excessive monitoring and missing opportunities.
Currently, the Bitcoin market has shown recent highs, while trading volume has weakened compared to the first peak, but the RSI remains stable without showing a significant decline. Investors should closely monitor whether there is a new price high but a declining RSI to validate the double top pattern.
Utilizing the custom indicators feature to overlay the RSI indicator on the candlestick chart for intuitive judgment, or setting alert scripts to monitor real-time situations where the price rises but the RSI declines, are effective choices to avoid missing key signals.
In the 2021 double top pattern, the closing price remained at a high, but the blue line RSI showed a decline:

Current pattern:

If the price effectively breaks below the neckline later, consider defensive strategies or look for shorting opportunities; if it does not break below the neckline, be cautious of a pattern failure and flexibly adjust strategies.
Through custom indicators, investors can more precisely capture trading opportunities in the double top pattern while effectively controlling risk.
免责声明:本文章仅代表作者个人观点,不代表本平台的立场和观点。本文章仅供信息分享,不构成对任何人的任何投资建议。用户与作者之间的任何争议,与本平台无关。如网页中刊载的文章或图片涉及侵权,请提供相关的权利证明和身份证明发送邮件到support@aicoin.com,本平台相关工作人员将会进行核查。


