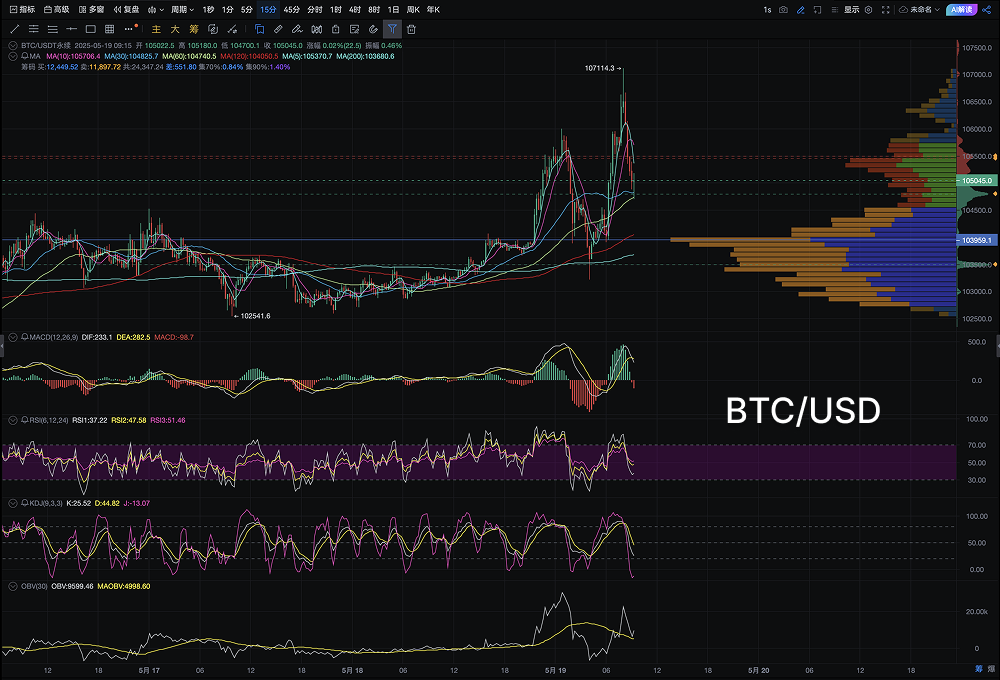
On the evening of May 18 to the early morning of May 19, 2025, the price of Bitcoin (BTC) experienced a sharp surge, briefly breaking through the $107,000 mark, reaching a new high since May.
K-line Structure: Volume Expansion Long Bullish Breakthrough Confirming Platform Resistance
From the chart, it can be seen that Bitcoin rapidly increased in volume after 18:00 on May 18, breaking through the previous consolidation platform's top (around the $104,500-$105,000 range), and peaked at $107,114.3 between 3:00-4:00 AM on May 19. The K-line pattern formed a solid long bullish candle with significant volume signals, presenting a typical "breakthrough acceleration phase."
It is noteworthy that after reaching above $107,000, the price quickly retraced to around $105,000 and found support, confirming the effectiveness of the platform's neckline support. The current K-line combination meets the standard structure of "breakthrough - pullback - confirmation," which is an important component of the bull market continuation pattern.

Large Fund Movements: Exchange Withdrawals + Institutional Accumulation Occurring Simultaneously
- Significant Increase in Large Transactions
According to monitoring data from the on-chain tracking platform Whale Alert, between 22:00 on May 18 and 1:00 AM on May 19, at least three large transfers of over 5,000 BTC occurred, moving from exchanges like Binance and OKX to unknown wallets or cold wallet addresses.
- ETF Fund Inflows Hit New Highs
Data from CoinShares and Farside shows that on May 17, 2025, the U.S. Bitcoin spot ETF recorded a net inflow of $412 million in a single day, with BlackRock's IBIT dominating, achieving a daily net inflow of $245 million, continuing a trend of positive net inflows for 20 consecutive days since May. This inflow was highly synchronized with the price increase that night, indicating that the price was driven by real buying rather than pure technical speculation.
Technical Indicators in Full Resonance: Bullish Structure Complete, Indicators Closely Aligned
From a technical indicator perspective, several key tools indicate that the current rise is not a false signal.
- The MACD indicator (12,26,9) has shown a golden cross signal since May 17, with the histogram continuously expanding, indicating an increase in trend strength. As of 08:00 on May 19, the distance between DIF and DEA expanded to 233.1 and 282.5, showing short-term divergence but still in a strong bullish zone.
- The RSI (12,24) quickly fell back after breaking through the critical point of 70 during the rise, currently returning to a level of 47.58, releasing overbought pressure while not completely weakening, remaining in a neutral to strong range, leaving momentum for a potential second upward attack.
- The KDJ indicator shows that the K and D values are maintaining expansion, while the J value peaked and fell back but has not formed a death cross. The J value's pullback may be due to short-term adjustments, and the structure has not been damaged. If K and D maintain an upward trend, it is expected to drive the market again.
Trading Behavior and Position Trends: Long-term Holders Strengthen Lock-up, Derivative Data Shows No Liquidation Anomalies
On-chain data analysis company CryptoQuant reported that on May 18, 2025, the net outflow of Bitcoin from exchanges reached 18,920 BTC, the largest single-day net outflow since mid-April, indicating a significant decrease in the market's "selling impulse."
At the same time, in the futures market, open interest (OI) slightly increased during the rise, but there were no large-scale liquidation phenomena, indicating that this rise was not triggered by "short squeezes" but was driven by substantial funds.
Market Sentiment and Structural Support: Price Still in "Hand Change - Climb" Phase
From the observed area of high trading volume (VPOC), the current maximum trading range is concentrated around $103,900, while a new secondary support zone has formed near $105,000. This structure indicates that the market is in a phase of "weak hands changing to strong hands," with bottom chips continuously solidifying.
In terms of sentiment, the Crypto Fear & Greed Index shows that market sentiment has jumped from "neutral" to "greed," but has not yet entered an extreme state, leaving room for further upward movement.
This article represents the author's personal views and does not reflect the stance or views of this platform. This article is for informational sharing only and does not constitute any investment advice to anyone.
Join our community to discuss this event
Official Telegram community: t.me/aicoincn
Chat room: Wealth Group
免责声明:本文章仅代表作者个人观点,不代表本平台的立场和观点。本文章仅供信息分享,不构成对任何人的任何投资建议。用户与作者之间的任何争议,与本平台无关。如网页中刊载的文章或图片涉及侵权,请提供相关的权利证明和身份证明发送邮件到support@aicoin.com,本平台相关工作人员将会进行核查。


