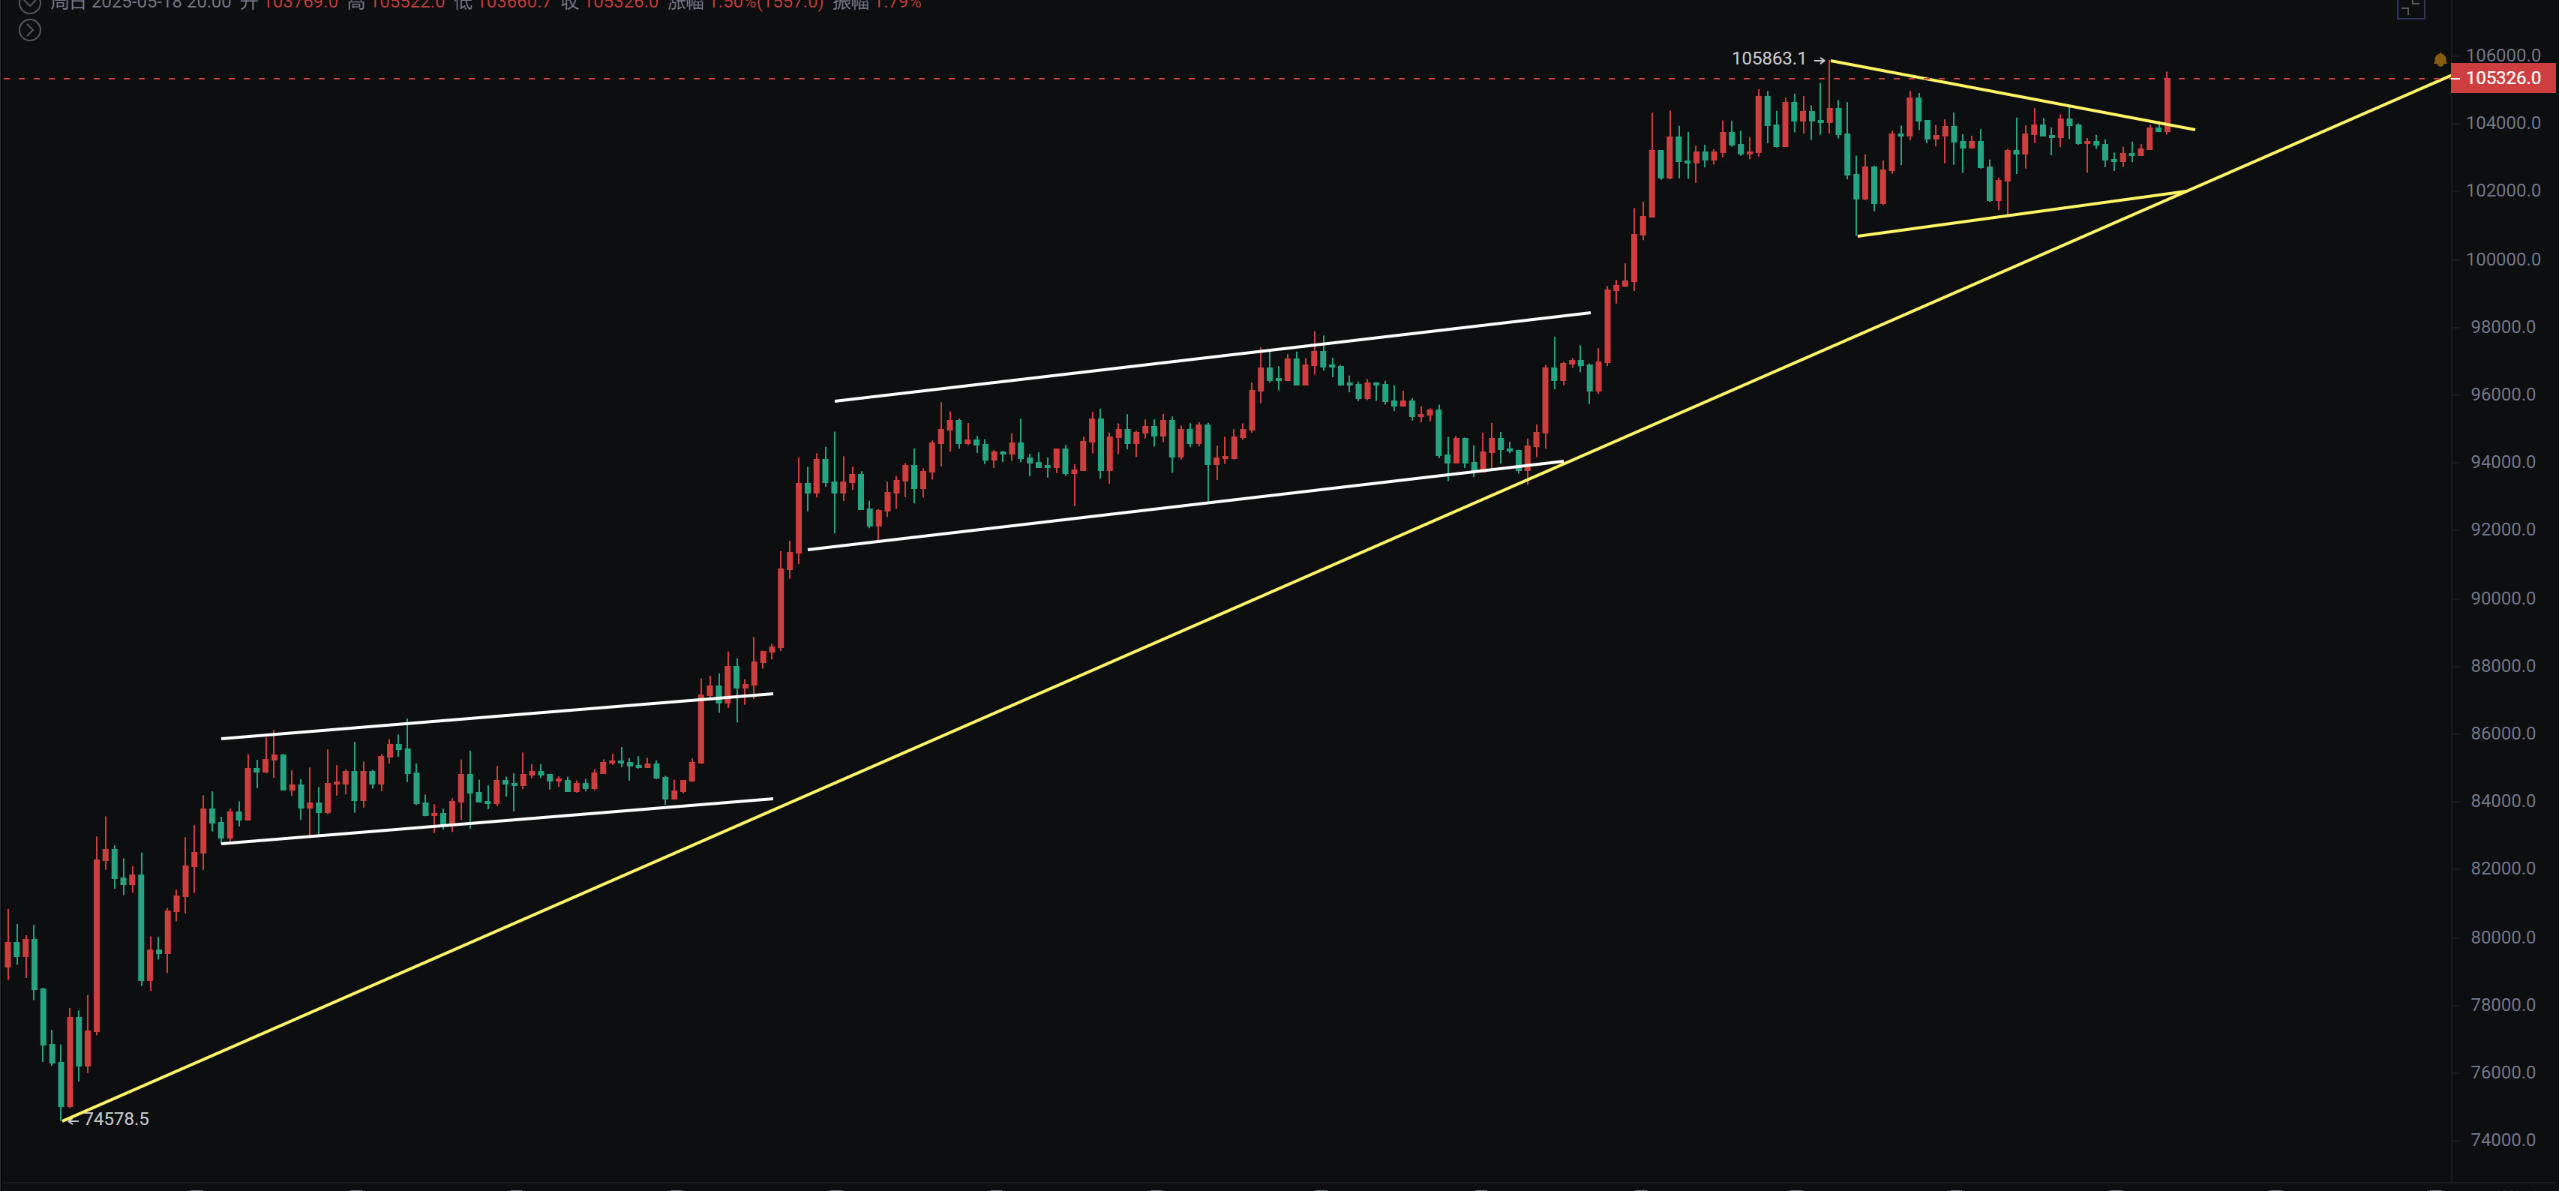
Emergency update, there are some abnormal signals in Bitcoin's short-term trading. The probability of a weekly close forming a doji star is quite high. The daily chart shows a top divergence but has maintained a high-level consolidation for 9 days. However, the 4-hour chart shows a bottom divergence that can still lead to an upward movement. This wave of increase is mainly driven by large institutional funds, and retail investors have not entered much, with many fearing heights and exiting early.
The strategy for the US market will not change; completing the bat pattern is likely to see a pullback near previous highs. Additionally, major short-sellers like Buffett are reducing or liquidating their positions in the US market, coupled with Moody's downgrading the US sovereign credit rating, marking a complete farewell to the top AAA credit rating club. Furthermore, there are significant sell-offs of US Treasury bonds by Eastern rabbits and three large entities. Therefore, while there are risks at critical positions in the US market, there are no short signals, and with gold also recently pulling back, it is worth watching whether Bitcoin will play a safe-haven role. The probability of a trend change next week is very high.
Bitcoin
Bitcoin has been in a narrow range for 9 days at a high level. The daily chart shows a top divergence, but the decline has been limited, and the 4-hour bottom divergence still has upward momentum. Therefore, I remind those looking to short to wait; a significant upward spike followed by a pullback must occur. Secondly, for those in the spot market, short-term positions should still aim for an upward push before the long-term position established at 78,000. Those doing short-term swings can take quick profits; if it should drop but doesn't, there may still be a rally. However, the best entry point is to wait for a pullback.
The weekly and monthly charts still indicate a bullish outlook without a doubt. The daily MACD shows a top divergence, with the fast and slow lines crossing, and if the histogram continues to turn red, attention should be paid to a potential rebound. The EMA has been directly spiking between EMA7 and EMA13, indicating a relatively strong trend, as seen from the volume which is decreasing.
Support: 95,800—97,800—100,000
Resistance: 110,000

Ethereum
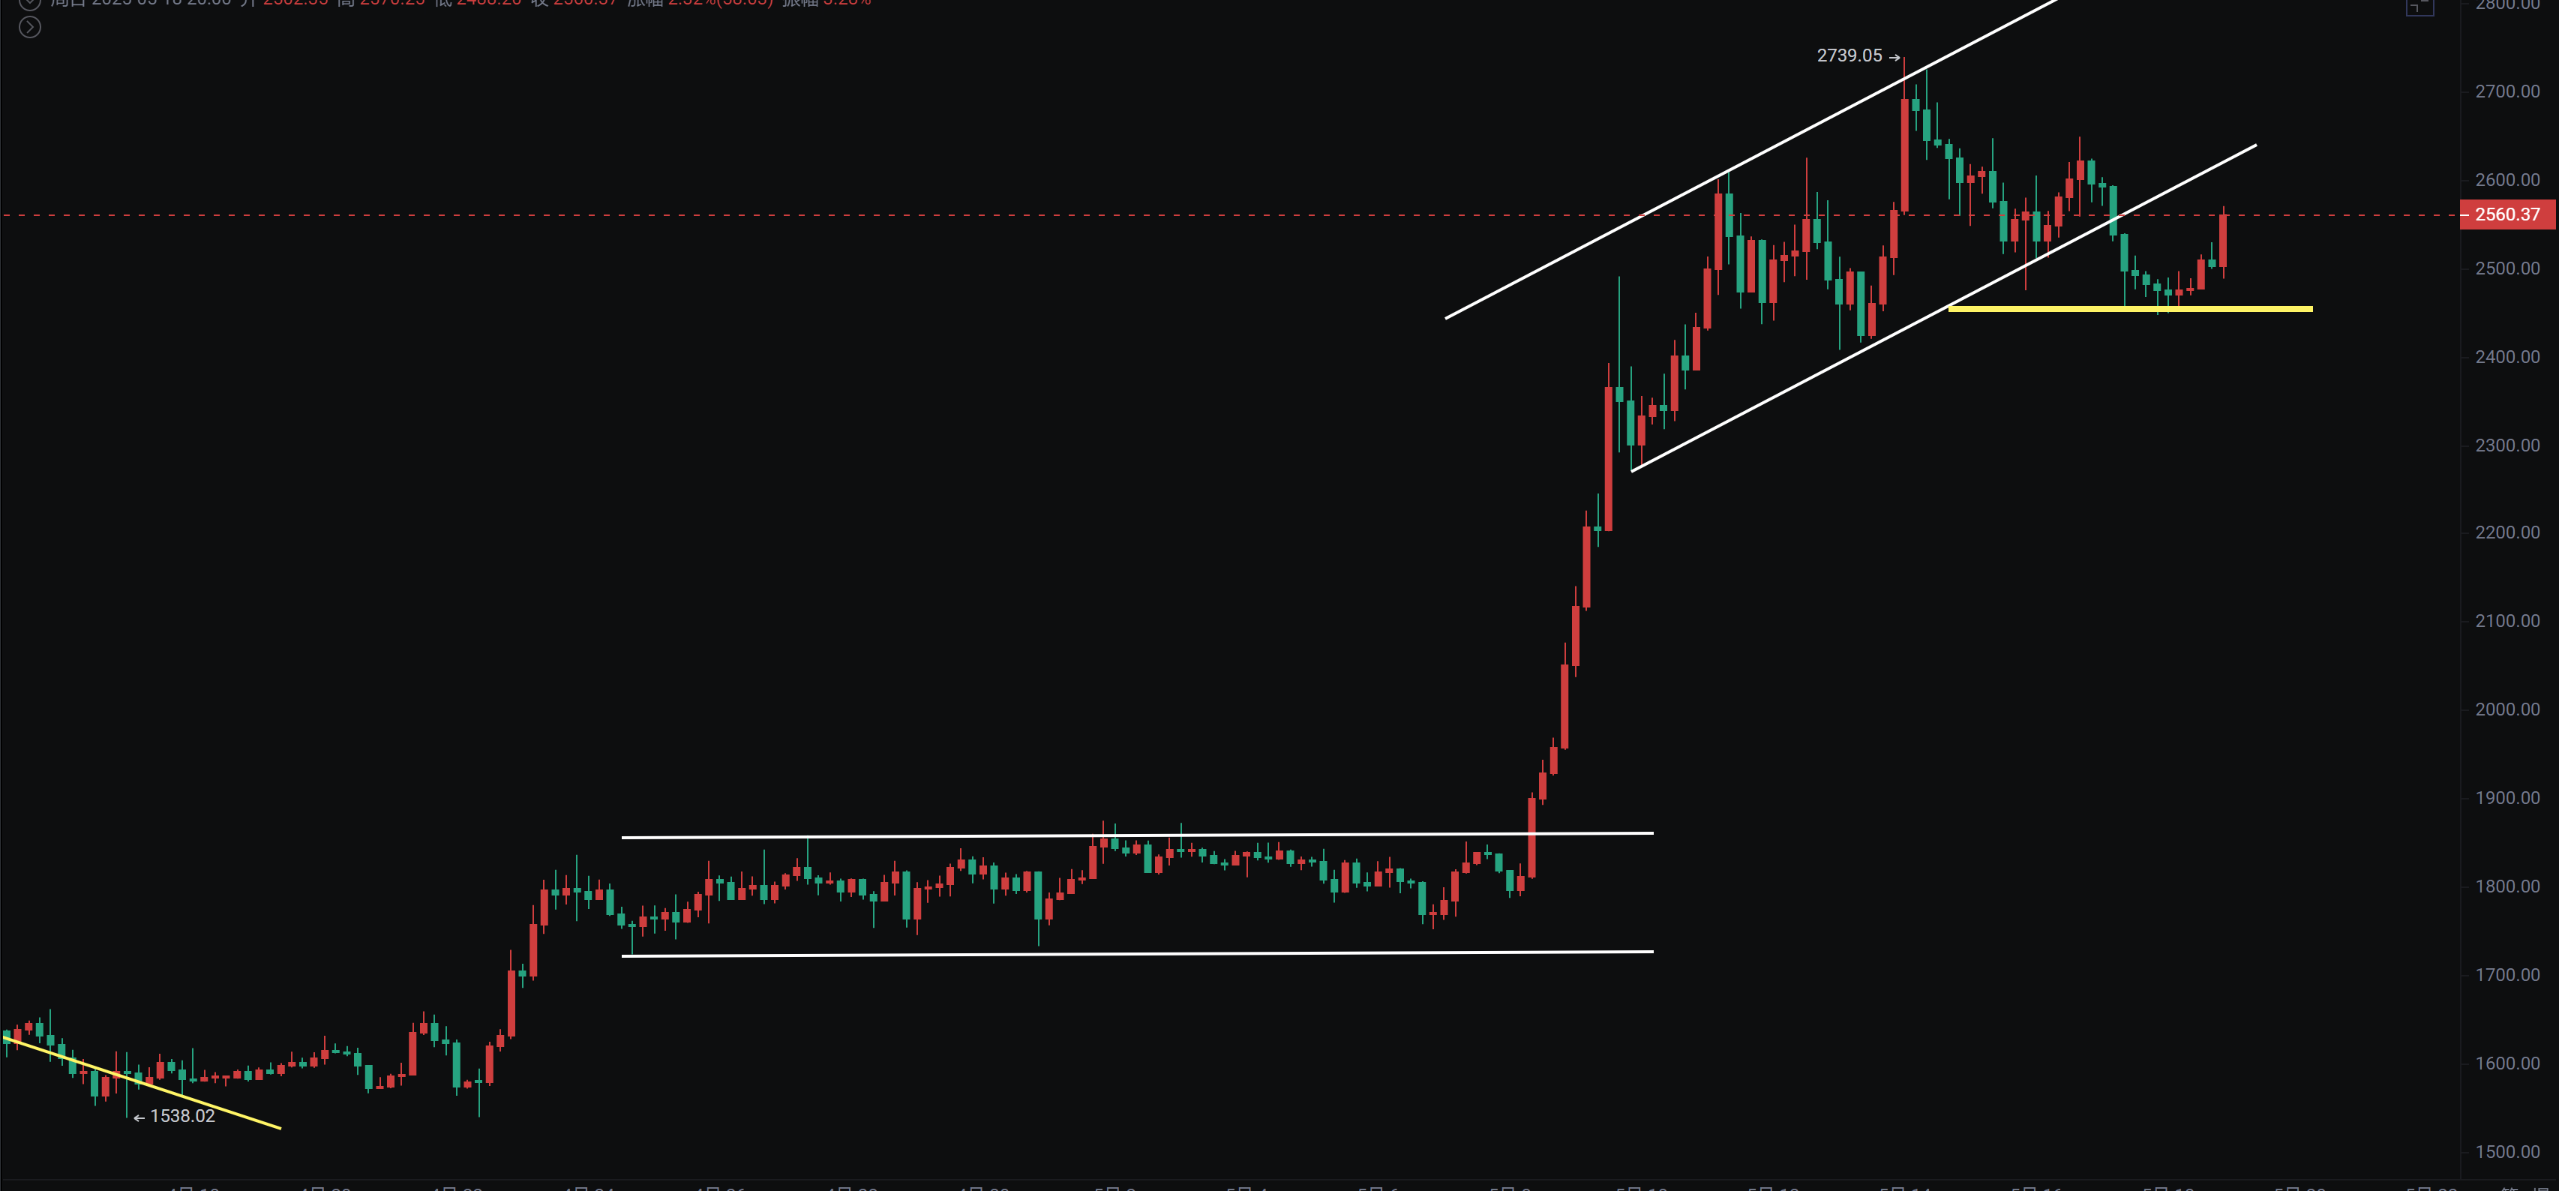
The 4-hour ascending channel has broken down, currently testing the channel resistance for a rebound. If it can return inside the channel, the upward trend will continue.
Altcoins: SOL, STX, DOGE, FLOKI, SUSHI can be monitored.
Support: 2,000—2,268—2,445
Resistance: 2,856—3,200

If you like my views, please like, comment, and share. Let's navigate through the bull and bear markets together!!!
The article is time-sensitive and for reference only, updated in real-time.
Focusing on K-line technical research, sharing global investment opportunities. Public account: BTC Trading Prince Fusu

免责声明:本文章仅代表作者个人观点,不代表本平台的立场和观点。本文章仅供信息分享,不构成对任何人的任何投资建议。用户与作者之间的任何争议,与本平台无关。如网页中刊载的文章或图片涉及侵权,请提供相关的权利证明和身份证明发送邮件到support@aicoin.com,本平台相关工作人员将会进行核查。


