Erosion of Dollar Hegemony and Rotation of Crypto Assets: Three Major Trends Reshaping the Value Logic of BTC
Macroeconomic Interpretation: Although the China-U.S. trade negotiations have made some progress, Goldman Sachs' latest report indicates that the downward trend of the dollar/Asian currency exchange rate is difficult to reverse. This judgment is based on two underlying logics: the consensus among institutions on diversifying U.S. assets and the market inertia formed by Asian exporters continuously selling dollars for local currencies. Notably, UBS has revealed that its high-net-worth clients are accelerating the reduction of dollar assets, opting instead to increase allocations in gold and cryptocurrencies. This "de-dollarization" strategy hedges against more than 20 new trade agreements that the Trump administration may introduce. If trade protection policies intensify, holding non-sovereign credit-backed crypto assets will become a natural choice for capital hedging.
The U.S. SEC's cautious attitude towards the physical redemption mechanism of Bitcoin ETFs exposes the deep contradictions between the traditional financial system and the crypto ecosystem. Although the physical redemption model proposed by institutions like BlackRock could theoretically enhance ETF operational efficiency, regulators prefer a conservative cash redemption strategy. This regulatory lag has led to collective approval delays for products like Grayscale Litecoin Trust and Solana Trust. However, the policy balance is shifting: two senators have jointly urged the Treasury Department to adjust crypto tax rules, directly pointing out the absurdity of taxing unrealized gains under current accounting standards. If the Treasury can clarify tax details before the third quarter, it may unleash the entry momentum of institutional funds worth billions.
On-chain data from CoinAnk shows that the net inflow of funds into the crypto market reached $35 billion in the past three weeks, a figure close to the capital scale at the beginning of the 2021 bull market. Interestingly, the timing of the fund inflow is highly correlated with the Federal Reserve's interest rate policy—CME interest rate observations indicate that the market's expectation for maintaining rates in June is at 91.8%. This monetary policy stalemate has weakened the attractiveness of traditional fixed-income assets. On a more micro level, UBS clients' trend of allocating cryptocurrencies alongside gold confirms the upgrade of Bitcoin's narrative from "anti-inflation" to "store of value." When mainstream institutions begin to hold BTC with the logic of gold allocation, its market cap ceiling opens up significant upward potential.
Trump's approval rating has rebounded to 44%, introducing new policy variables, and his trade team has hinted at announcing more than 20 new agreements. This "art of the deal" may exacerbate volatility in the currency market. Historical data shows that whenever the dollar index falls by 1%, Bitcoin's monthly average increase reaches 7.2%. If Asian currencies continue to strengthen, triggering a sell-off of dollar assets, the crypto market may become the largest liquidity reservoir. On a technical level, if BTC can stabilize above the $100,000 key level, it will attract CTA strategy funds to trigger programmatic buying, forming a short-term positive feedback mechanism.
The current market is at the intersection of the deconstruction of traditional financial models and the reconstruction of the crypto ecosystem. The progress of Bitcoin ETF approvals, the Treasury's tax details, and the Federal Reserve's policy shift constitute three major observation indicators. Any breakthrough of a single variable could trigger a qualitative change in the market. For institutional investors, the allocation weight of crypto assets has shifted from "experimental holdings" to "strategic allocation." This cognitive shift may be historically more significant than short-term price fluctuations. When $35 billion in funds vote with real money to choose the crypto market, we may be witnessing the moment of value awakening for digital gold.
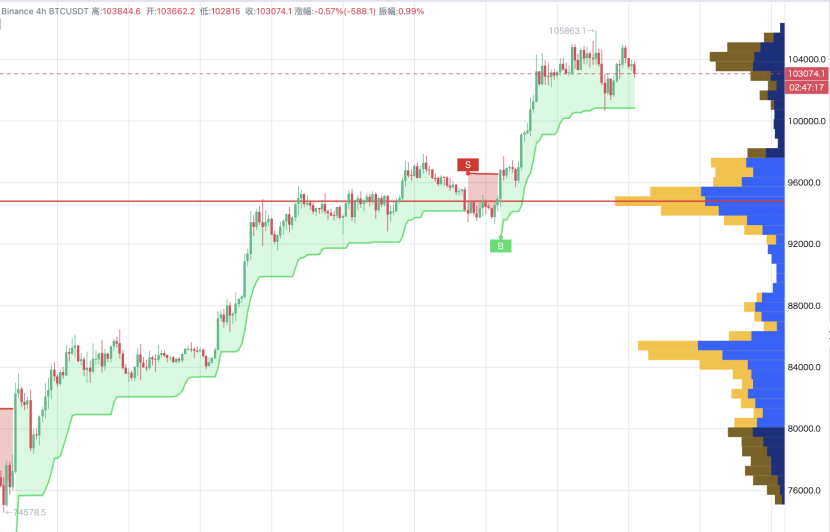
According to CoinAnk AI Smart Analysis, the BTC 4H Market Analysis Report is as follows:
Main Support Level: 100678 USDT
Main Resistance Level: 104913 USDT
Current Trend: Slightly Bullish
Detailed Explanation:
Technical Indicators Summary:
Moving Average System: MA5=103942.42, MA10=103407.52, MA20=103551.81, MA120=97647.38. The current price is between MA5 and MA10, showing a bullish arrangement in the moving average system, but MA5 slightly crossing below MA10 indicates some oscillation characteristics.
MACD: DIF=511.45, DEA=630.49, Histogram=-119.05. The MACD is in a death cross state, but the histogram is narrowing, indicating that bearish momentum is weakening, and the market may enter a consolidation or reversal phase.
BOLL: Upper Band=105248.99, Middle Band=103551.81, Lower Band=101854.63. The current price is near the middle band, %B=0.54%, indicating that the price is above the middle band but has not touched the upper band, showing slightly bullish characteristics.
RSI: RSI6=52.02, RSI12=53.71, RSI14=54.43, RSI24=56.90. The RSI indicator is in a neutral zone, with no overbought or oversold signals, indicating relatively stable market sentiment.
KDJ: K=65.61, D=62.50, J=71.83. The KDJ indicator is in a golden cross state, but the J line is slightly above the K and D lines, indicating some bullish momentum.
Indicator Data:
Funding Rate: 0.00611500%. The funding rate is in a neutral zone, with no significant bullish or bearish sentiment, indicating relatively stable market sentiment.
Volume Changes: Recent trading volume has shown fluctuations but has not exhibited significant increases or decreases, indicating average market participation.
Capital Flow Data: Recent contract funds have shown a net outflow, and spot funds have also shown a net outflow, indicating some signs of capital withdrawal, but no clear trend has formed.
Analysis Result
Direction: Cautiously Bullish
Entry Timing: The current price is near the middle band; it is recommended to enter long positions when the price pulls back to near the support level.
Stop Loss Setting: Stop loss ratio is about 3%.
Target Price Level: The target price level is set at the resistance level; if the price breaks through the resistance level, it can be held further, and the target return can be increased to 5%.
Note: This analysis is for reference only and does not constitute any investment advice!
免责声明:本文章仅代表作者个人观点,不代表本平台的立场和观点。本文章仅供信息分享,不构成对任何人的任何投资建议。用户与作者之间的任何争议,与本平台无关。如网页中刊载的文章或图片涉及侵权,请提供相关的权利证明和身份证明发送邮件到support@aicoin.com,本平台相关工作人员将会进行核查。


