Technical Key Points Analysis:
BTC:
Bitcoin has formed a large cross bearish candlestick on the daily chart, with an overall pullback of 5000 points after a rise. The day after, we relied on the second rise after hitting 105800, which faced resistance, and we positioned ourselves for a bearish outlook around 104500, achieving a very good range. This is also the first bearish pullback layout recently, as we have been consistently bullish and capturing opportunities!
On the daily chart, Bitcoin has shown the first consecutive bearish pullback after a series of bullish days, forming a large bearish candlestick. This type of movement is considered a neutral bearish state, which does not affect the overall upward trend and is not classified as extremely weak. It only impacts the continuity of today's upward movement, creating resistance for further increases. Next, we will focus on the 4-hour chart, where the 104500 level continues to face pressure, which is also the position we looked at for a bearish outlook the day before.
On the hourly chart, we should pay attention to the resistance level at 103200-103500. This is the high point after the drop in the early morning and also serves as the support for the previous upward movement.
From a larger perspective, the most important level below is the 99500 level for the top-bottom conversion. Friends who have been following this level know how much I have emphasized it; this is also the dividing line between strength and weakness. For intraday support, we will focus on the low point of 10500 after the first breakthrough of 100000 and subsequent pullback. We can look bullish based on this position!
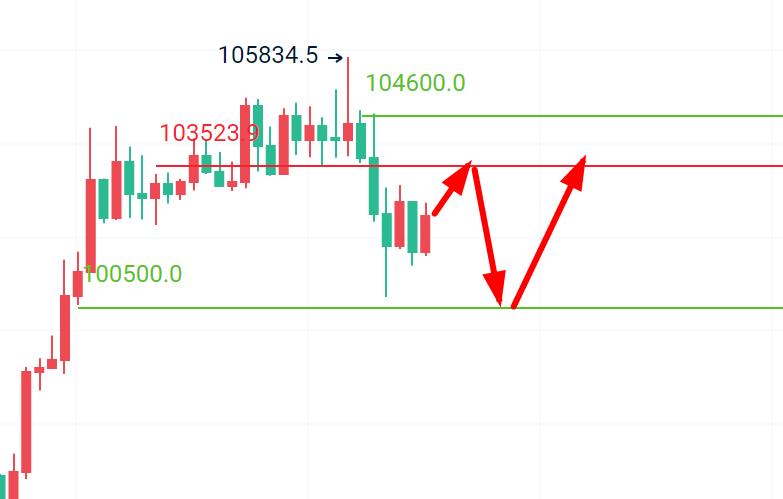
For Bitcoin, it is recommended to look bullish in the range of 100500-100700, with a stop loss at 100000 and a target of 101800-103000;
For Bitcoin, it is recommended to look bearish in the range of 103200-103500, with a stop loss at 104000 and a target of 101800-101000;
免责声明:本文章仅代表作者个人观点,不代表本平台的立场和观点。本文章仅供信息分享,不构成对任何人的任何投资建议。用户与作者之间的任何争议,与本平台无关。如网页中刊载的文章或图片涉及侵权,请提供相关的权利证明和身份证明发送邮件到support@aicoin.com,本平台相关工作人员将会进行核查。