Summary
• In April, Solana maintained an average of over 93 million daily transactions, totaling 2.8 billion by April 30, continuing to lead across all chains.
• As of April 28, Ethereum recorded a net inflow of over $904 million in the funding flow data of various public chains, ranking first across the network.
• Wallet addresses holding more than 10,000 BTC have a cumulative score between 0.9 and 1, indicating an almost fully net buying state.
• The net growth value of BTC UTXO has continued to turn positive, showing a rebound in momentum, with new addresses maintaining an average of 300,000 daily, driven mainly by existing users.
• As of April 28, the LaunchLab platform has created a total of 25,207 tokens, with a graduation rate of approximately 0.84%.
• $TRUMP leveraged a golf dinner and White House visit to spark market enthusiasm, with prices soaring over 50%, and on-chain holdings and activity increasing simultaneously.
On-chain Data Summary
Overall On-chain Situation
- Daily On-chain Transaction Volume
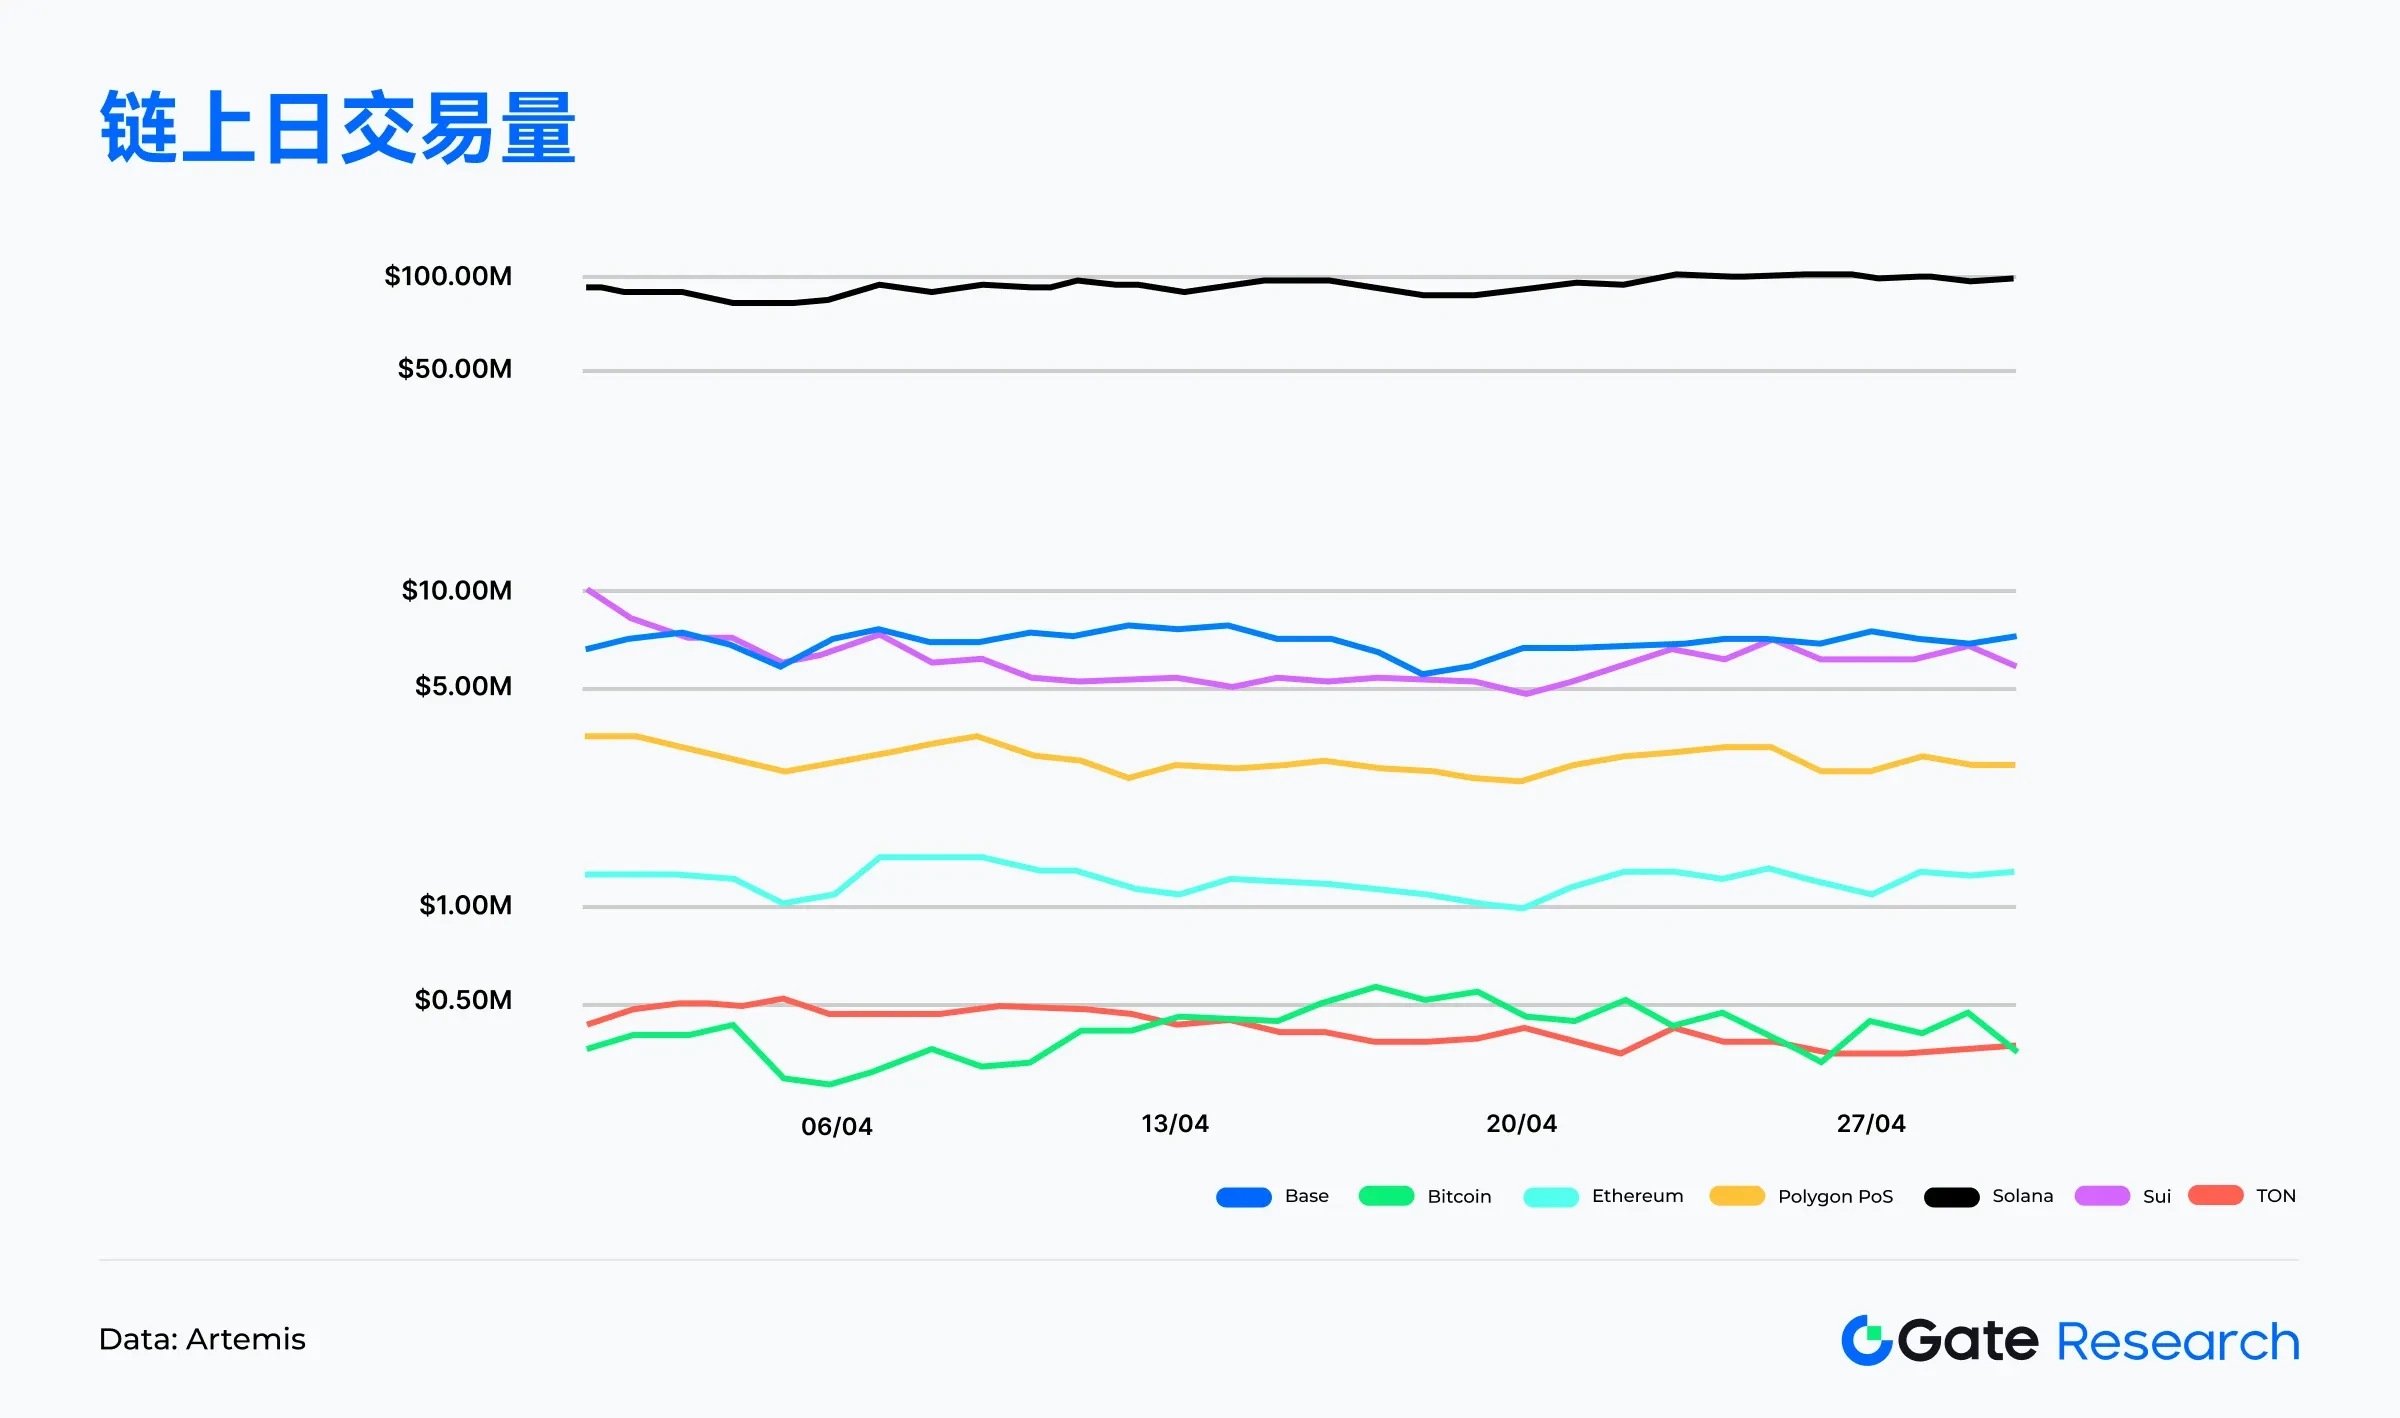
In April, Solana maintained an average of over 93 million daily transactions, totaling 2.8 billion by April 30, continuing to lead across all chains. Base and Sui stabilized at around 7 million and 6.1 million transactions, respectively, demonstrating strong activity. Polygon PoS and Ethereum had daily transaction volumes of over 2.9 million and 1 million, showing relatively stable trends. TON and Bitcoin had lower transaction volumes, generally maintaining between 200,000 and 400,000 transactions.
Overall, Solana remains in first place, while emerging chains Base and Sui, though still small in scale, exhibit frequent interactions and strong ecological momentum. Base benefits from the support of the Coinbase ecosystem and the activity of meme coins, not only maintaining an average daily transaction volume exceeding 7 million but also recording nearly $350,000 in average daily gas revenue in mid-April, showcasing its commercialization potential. Sui, leveraging the advantages of the Move language and use cases in gaming and NFTs, achieved an average daily transaction volume of 6.1 million, maintaining high-frequency interactions. Both are rapidly expanding in a low-fee, high-interactivity on-chain environment, representing the most promising emerging public chains currently.【1】
- Daily Gas Fees for Each Chain
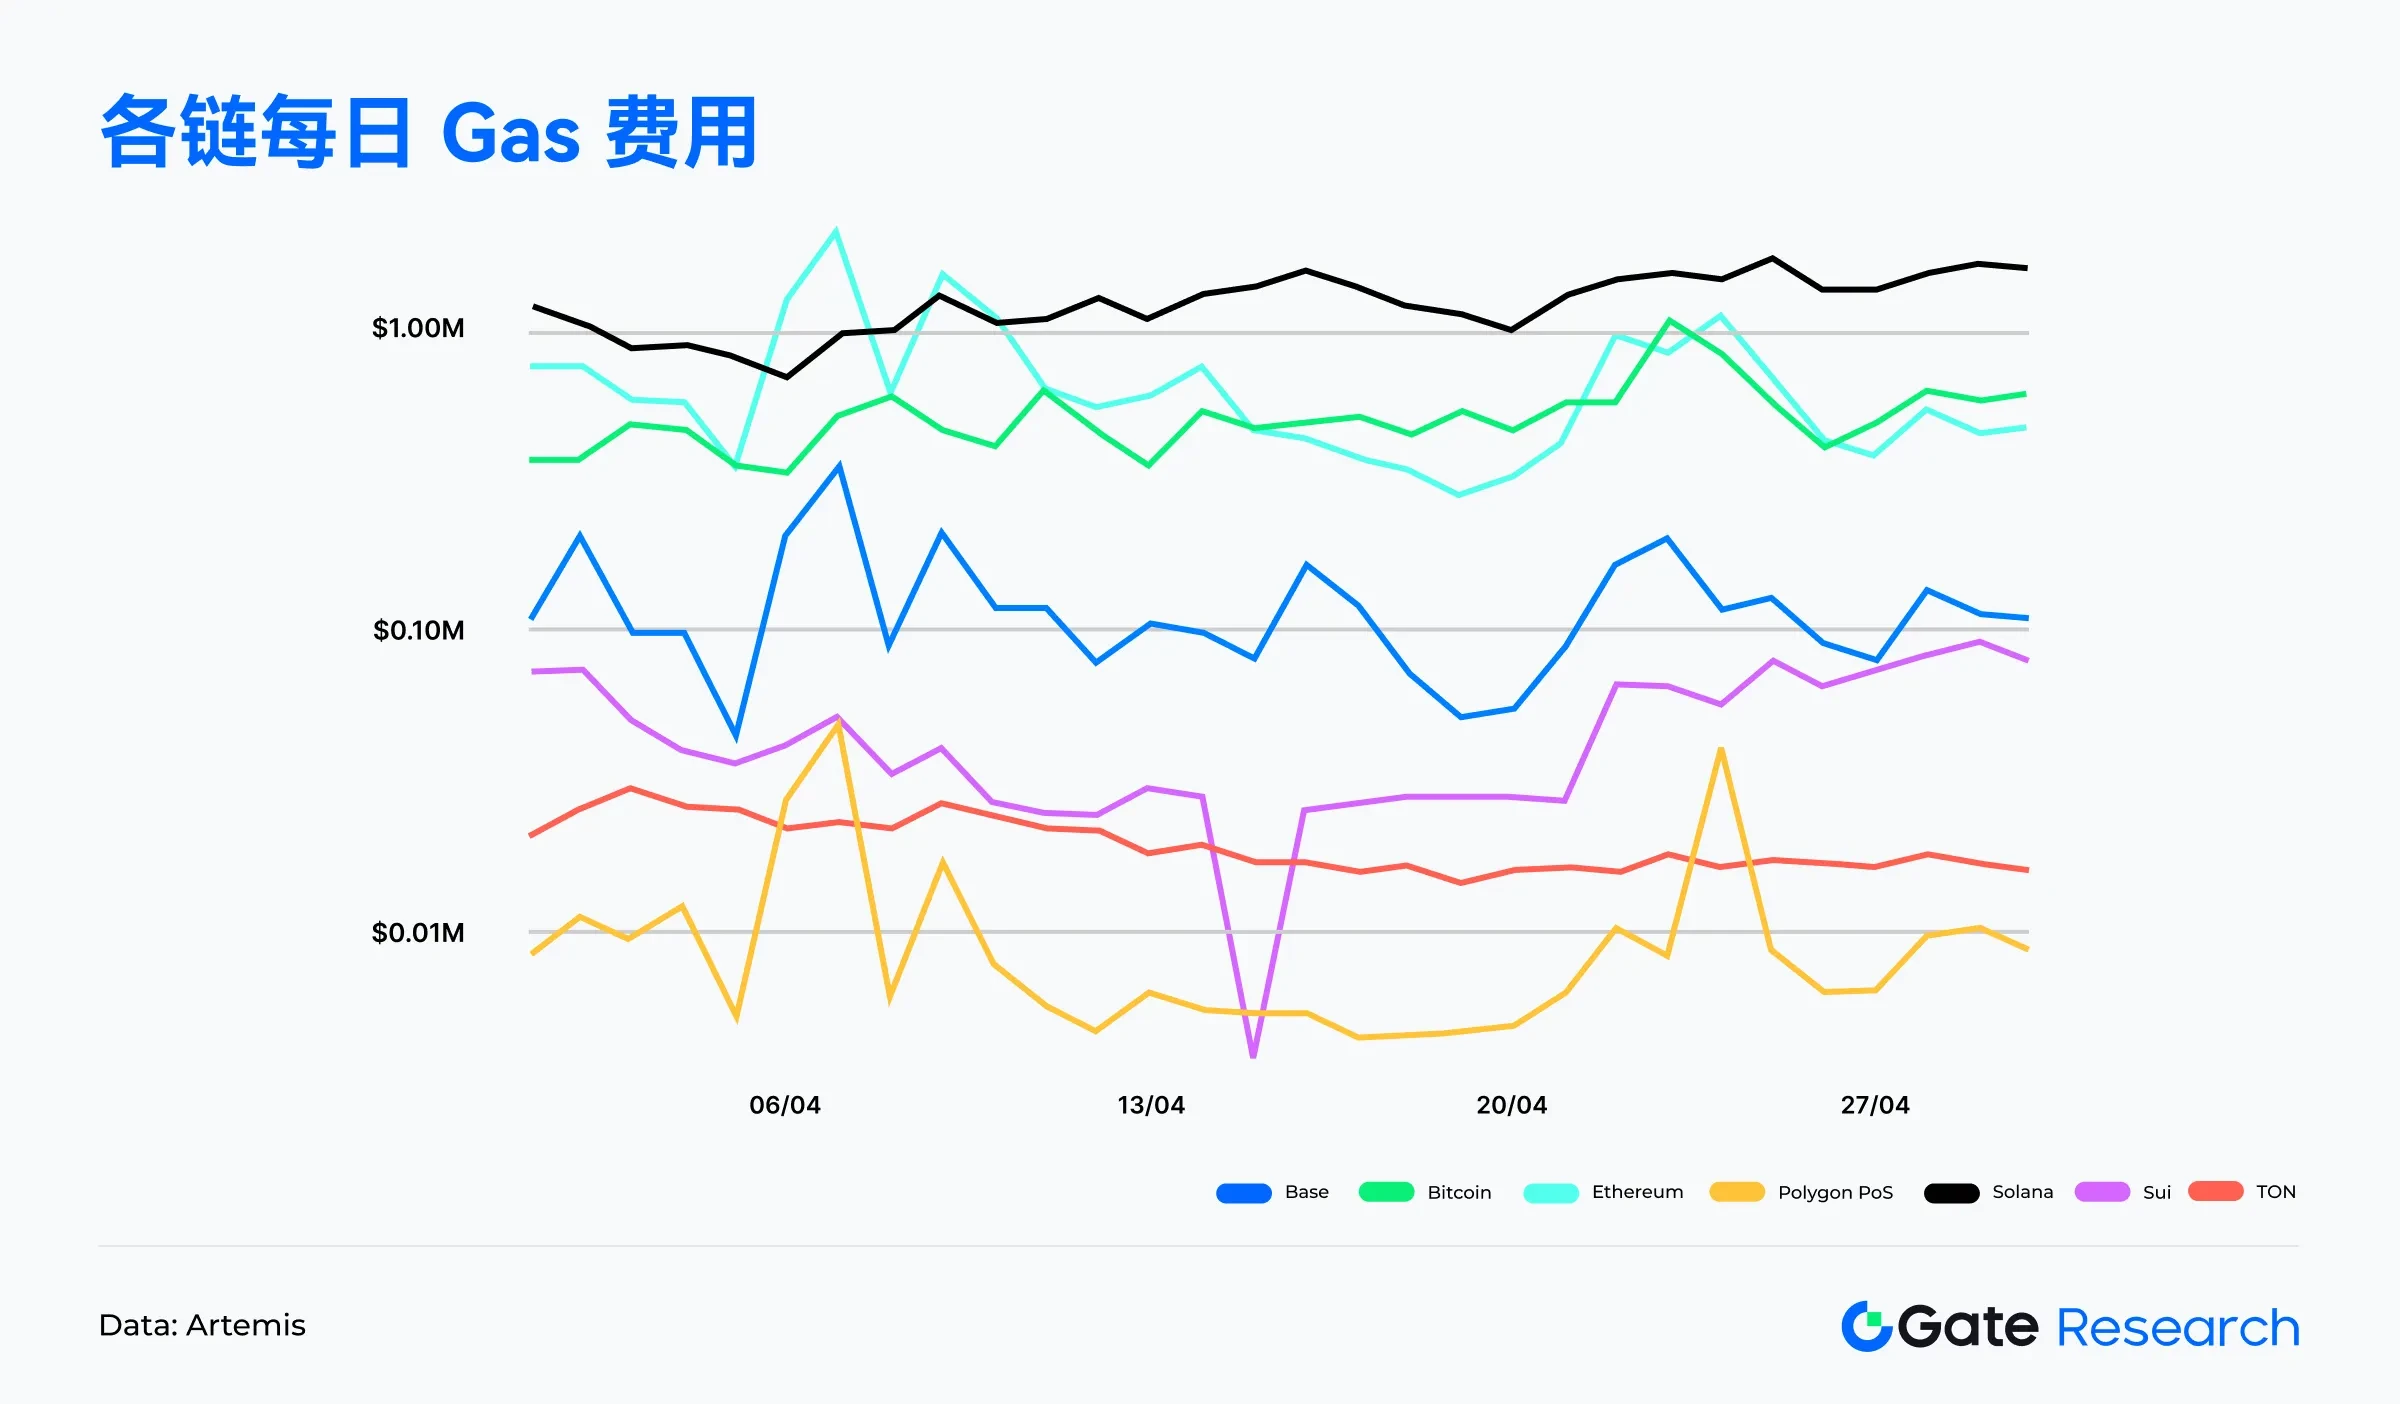
During April, Solana's gas revenue continued to lead, with average daily fees exceeding $1.2 million, totaling $37.5 million by April 30. Bitcoin and Ethereum followed closely, with daily average revenues roughly between $500,000 and $700,000. Base peaked at nearly $350,000 in mid-April, showing impressive performance. Sui, Polygon PoS, and TON's daily fees remained below $50,000, maintaining low levels. Overall, leading chains continue to excel in fee revenue, while emerging chains like Base are gradually demonstrating commercialization potential.【2】
- User Base and Ecological Dynamics Behind Solana's High-frequency Interactions
In April, Solana not only maintained an average of 93 million daily transactions but also had over 4 million daily active addresses, averaging about 4.5 million for the month, indicating that trading activity is not solely driven by bots or a single protocol but is built on a broad user base. Notably, on April 11, active addresses exceeded 6.2 million, further highlighting the concentrated explosion of ecological heat.
Additionally, Solana's average daily gas revenue exceeded $1.2 million, far surpassing most public chains, indicating that on-chain transactions are not only frequent but also supported by real fee income, rather than "zero-cost volume brushing." This trend is closely related to MEV reward mechanisms like Jito, with a large number of high-frequency traders and arbitrage bots active on-chain, driving up fees. Platforms like Pump.fun continue to attract creators, coupled with the swap transaction volume supported by aggregation platforms like Jupiter, keeping on-chain interactions at a high level over the long term.【3】
- Net Flow of Public Chain Bridges
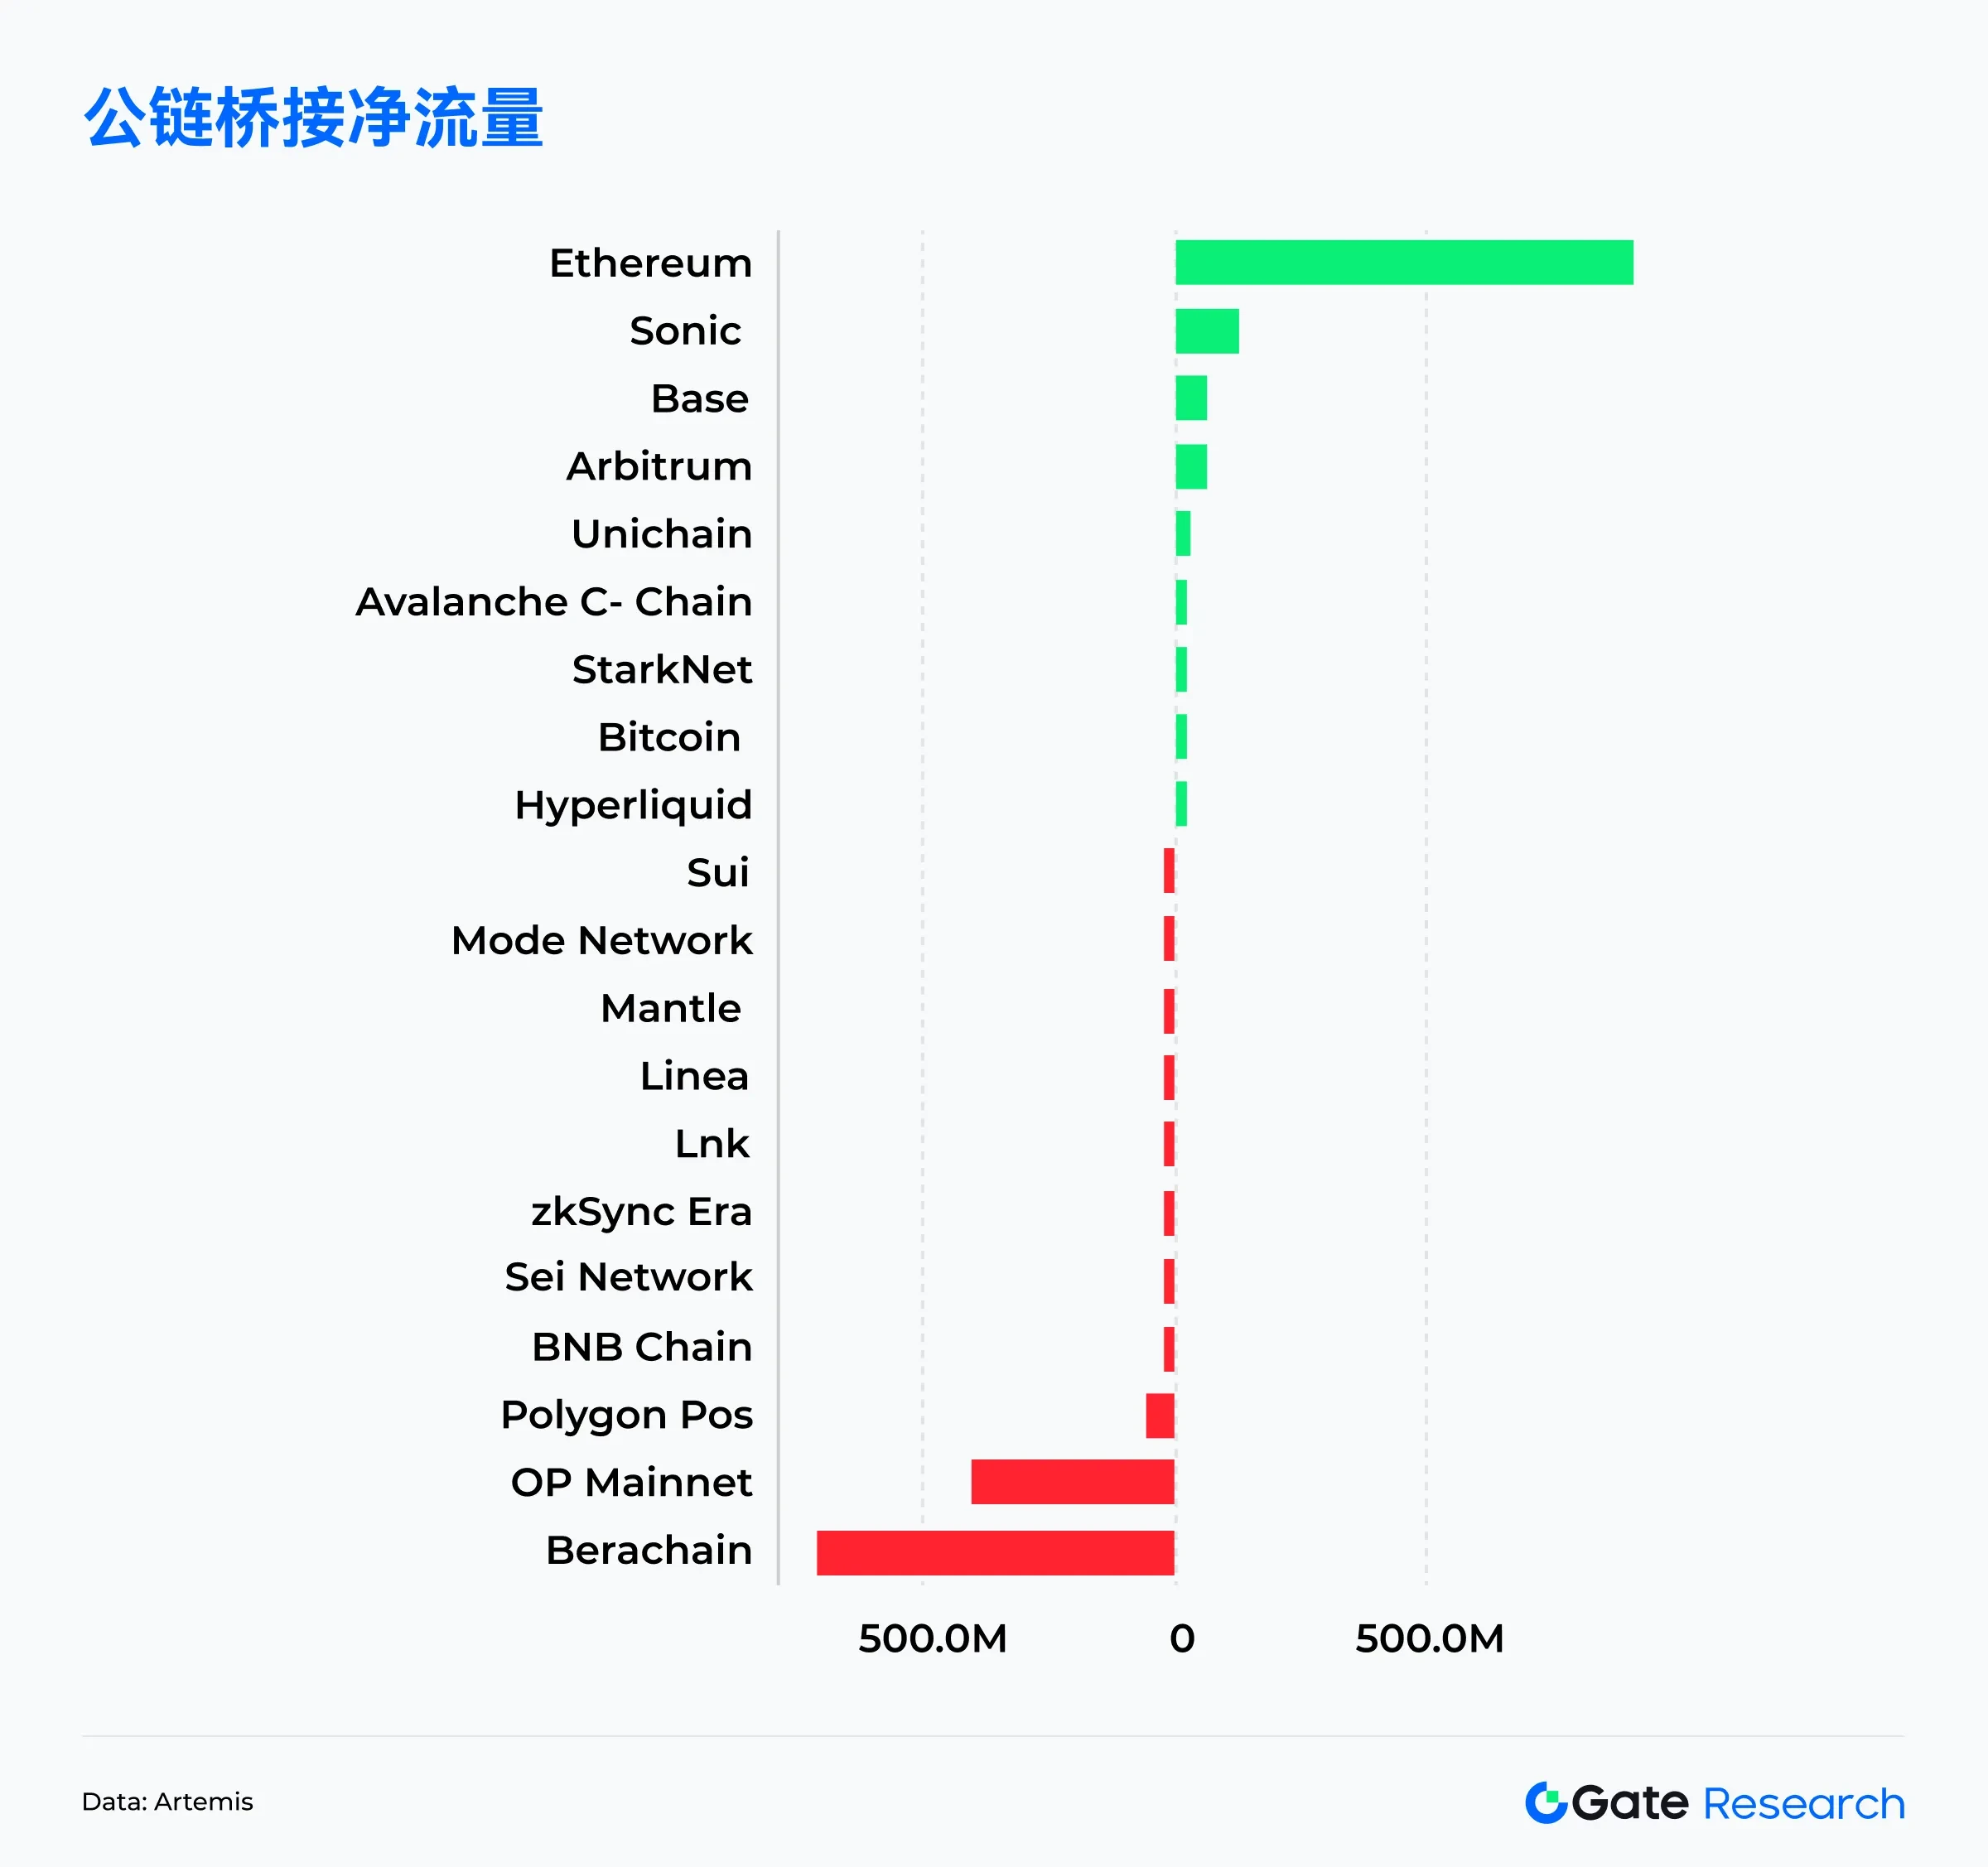
In the funding flow data of various public chains in April, as of April 28, Ethereum recorded a net inflow of over $904 million, ranking first across the network, reversing the trend of continuous outflows in the previous three months and re-establishing its core position as a "value reservoir." This inflow trend may be related to a rebound in market risk appetite, stabilization of L2 on-chain activities, and rising expectations for ETFs, attracting long-term capital back to the main chain.
Among emerging public chains, Sonic performed impressively, attracting over $124 million in net inflow in a single month, ranking second, reflecting its high-performance architecture and low-cost trading attracting new capital attention, with market recognition of its ecological growth potential. Meanwhile, Base and Arbitrum recorded net inflows of approximately $64.8 million and $62.1 million, respectively, indicating that some L2 networks still maintain a net inflow of funds, benefiting from a stable developer base and user growth. Smaller ecological chains like Sui and Hyperliquid maintained slight net inflows, reflecting their ability to attract capital in vertical scenarios (such as trading and gaming).
In contrast, Berachain experienced a net outflow of up to $704 million, the highest among all chains. OP Mainnet and Polygon PoS also saw outflows of $400 million and $57 million, respectively, indicating that some funds have been reallocated to other public chains or off-chain markets in the short term. Overall, the funding flow structure in April showed a structural recovery, with Ethereum making a strong comeback, Sonic emerging as a dark horse, while some early hot projects face pressure from capital redistribution, indicating a subtle change in the competitive landscape of public chains.【4】
Key Bitcoin Indicator Analysis
The following will filter and analyze several key indicators of Bitcoin and summarize market trends based on this.
Bitcoin Buying Trend by Different Holding Sizes: Large Funds Continue Net Buying, Rebound Signals Clear
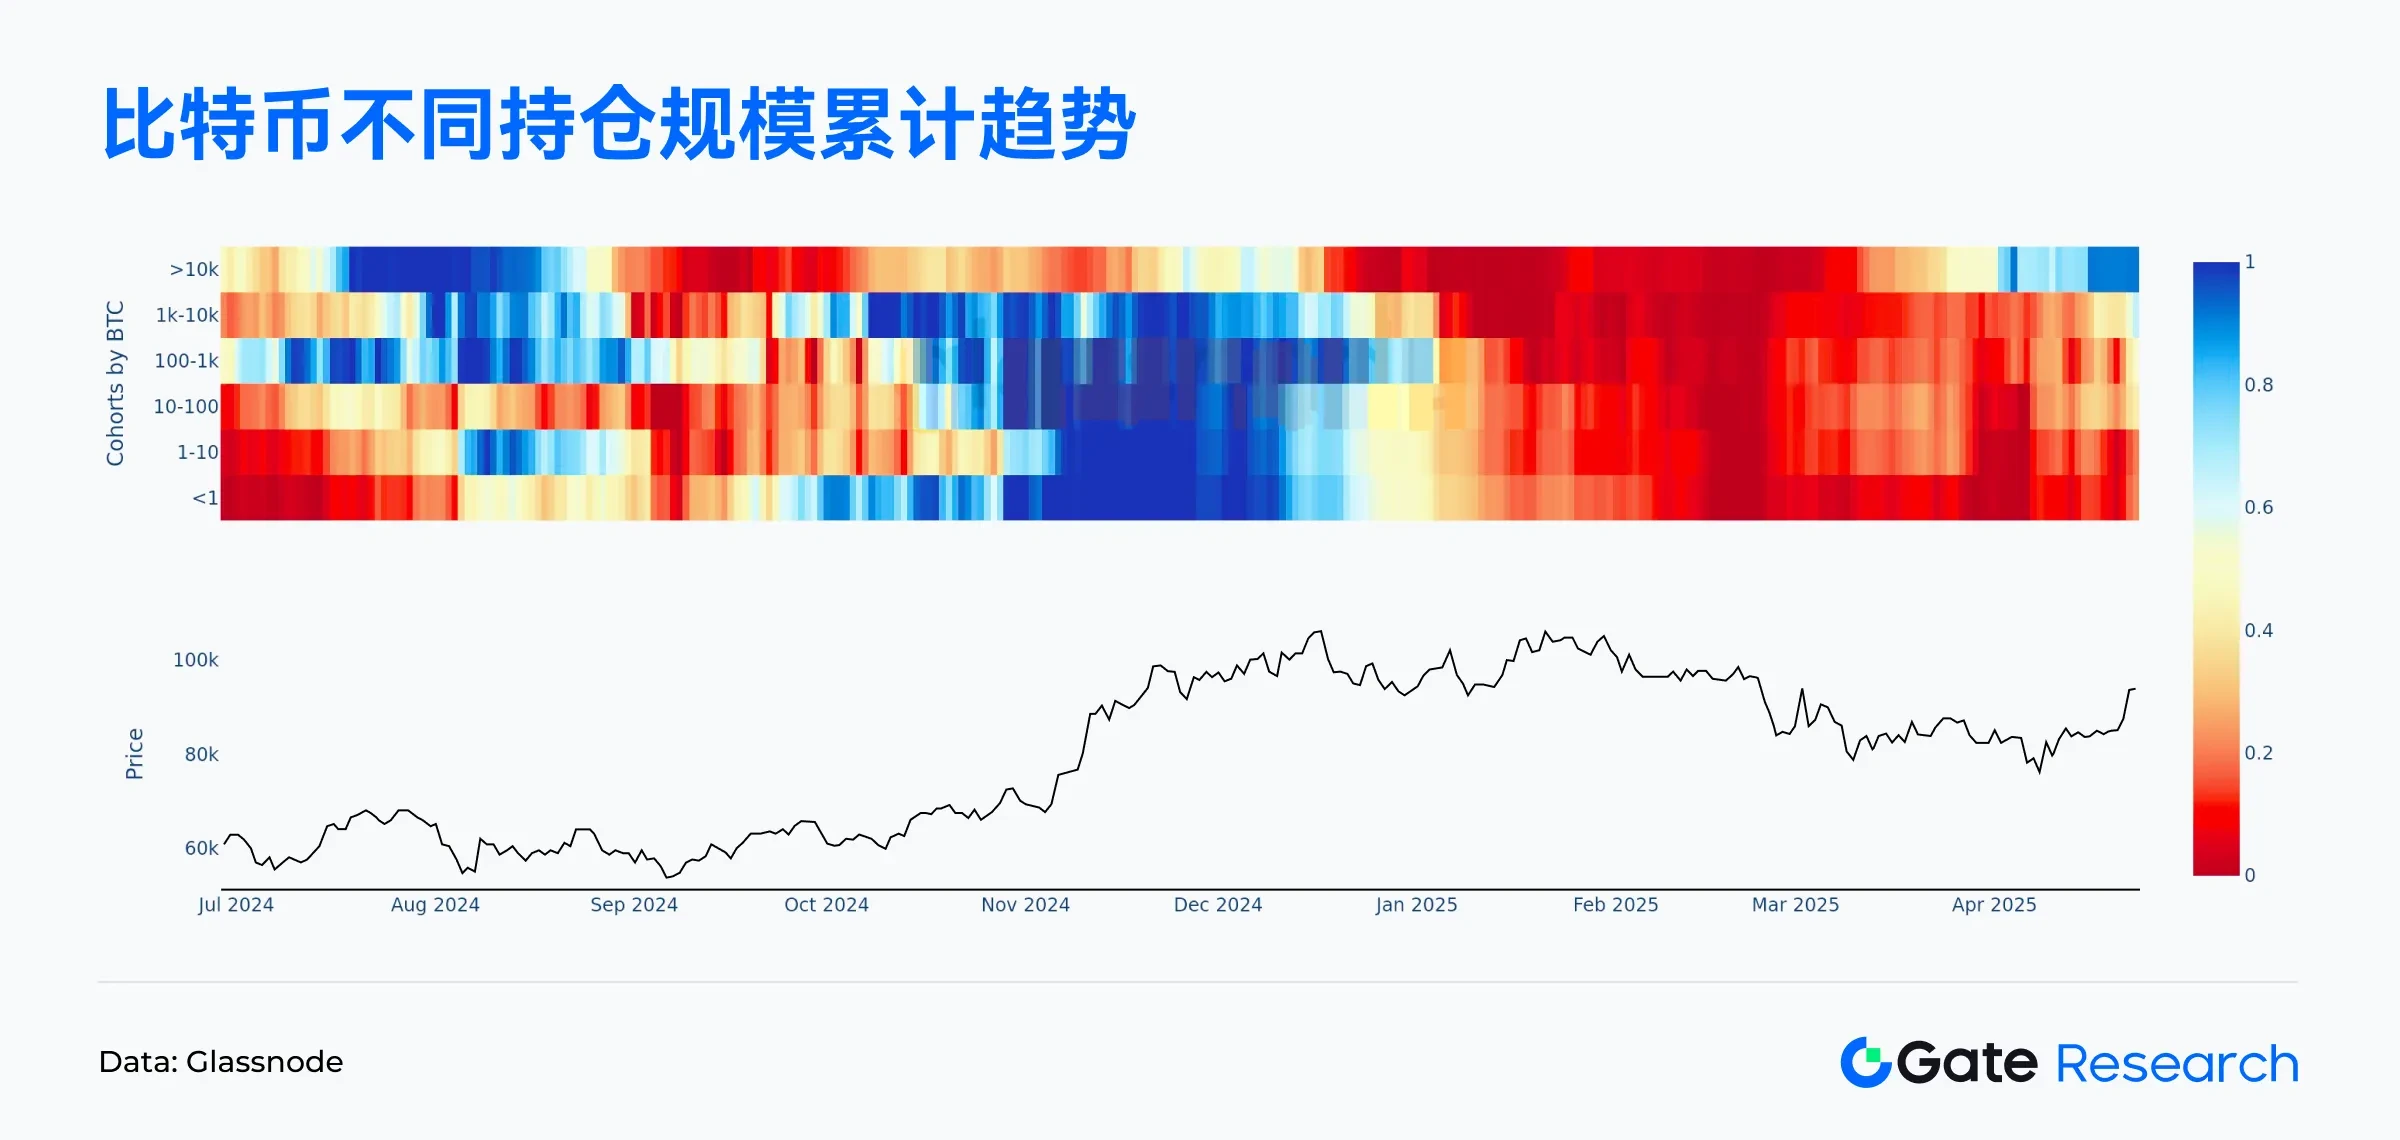
According to Glassnode data, during the recent rebound in Bitcoin prices, large fund holders have shown a clear trend of continuous buying:
• Wallet addresses holding more than 10,000 BTC have a cumulative score between 0.9 and 1, indicating an almost fully net buying state.
• Addresses holding between 1,000 and 10,000 BTC have a cumulative score between 0.7 and 0.8, indicating that this group is actively increasing their holdings.
• Medium holders with 10 to 1,000 BTC have seen their cumulative score rise to around 0.5, indicating a shift from neutral to a buying inclination.
This means that during the rebound of Bitcoin prices after the mid-April correction, large funds (whales) have taken the lead in entering the market and continue to absorb chips, gradually boosting market confidence. Such funds typically have a significant impact on price trends, and their concentrated accumulation behavior is often seen as an important signal for medium to long-term price increases.【5】【6】
- UTXO Net Growth Turns Positive, Bitcoin On-chain Activity Rebounds
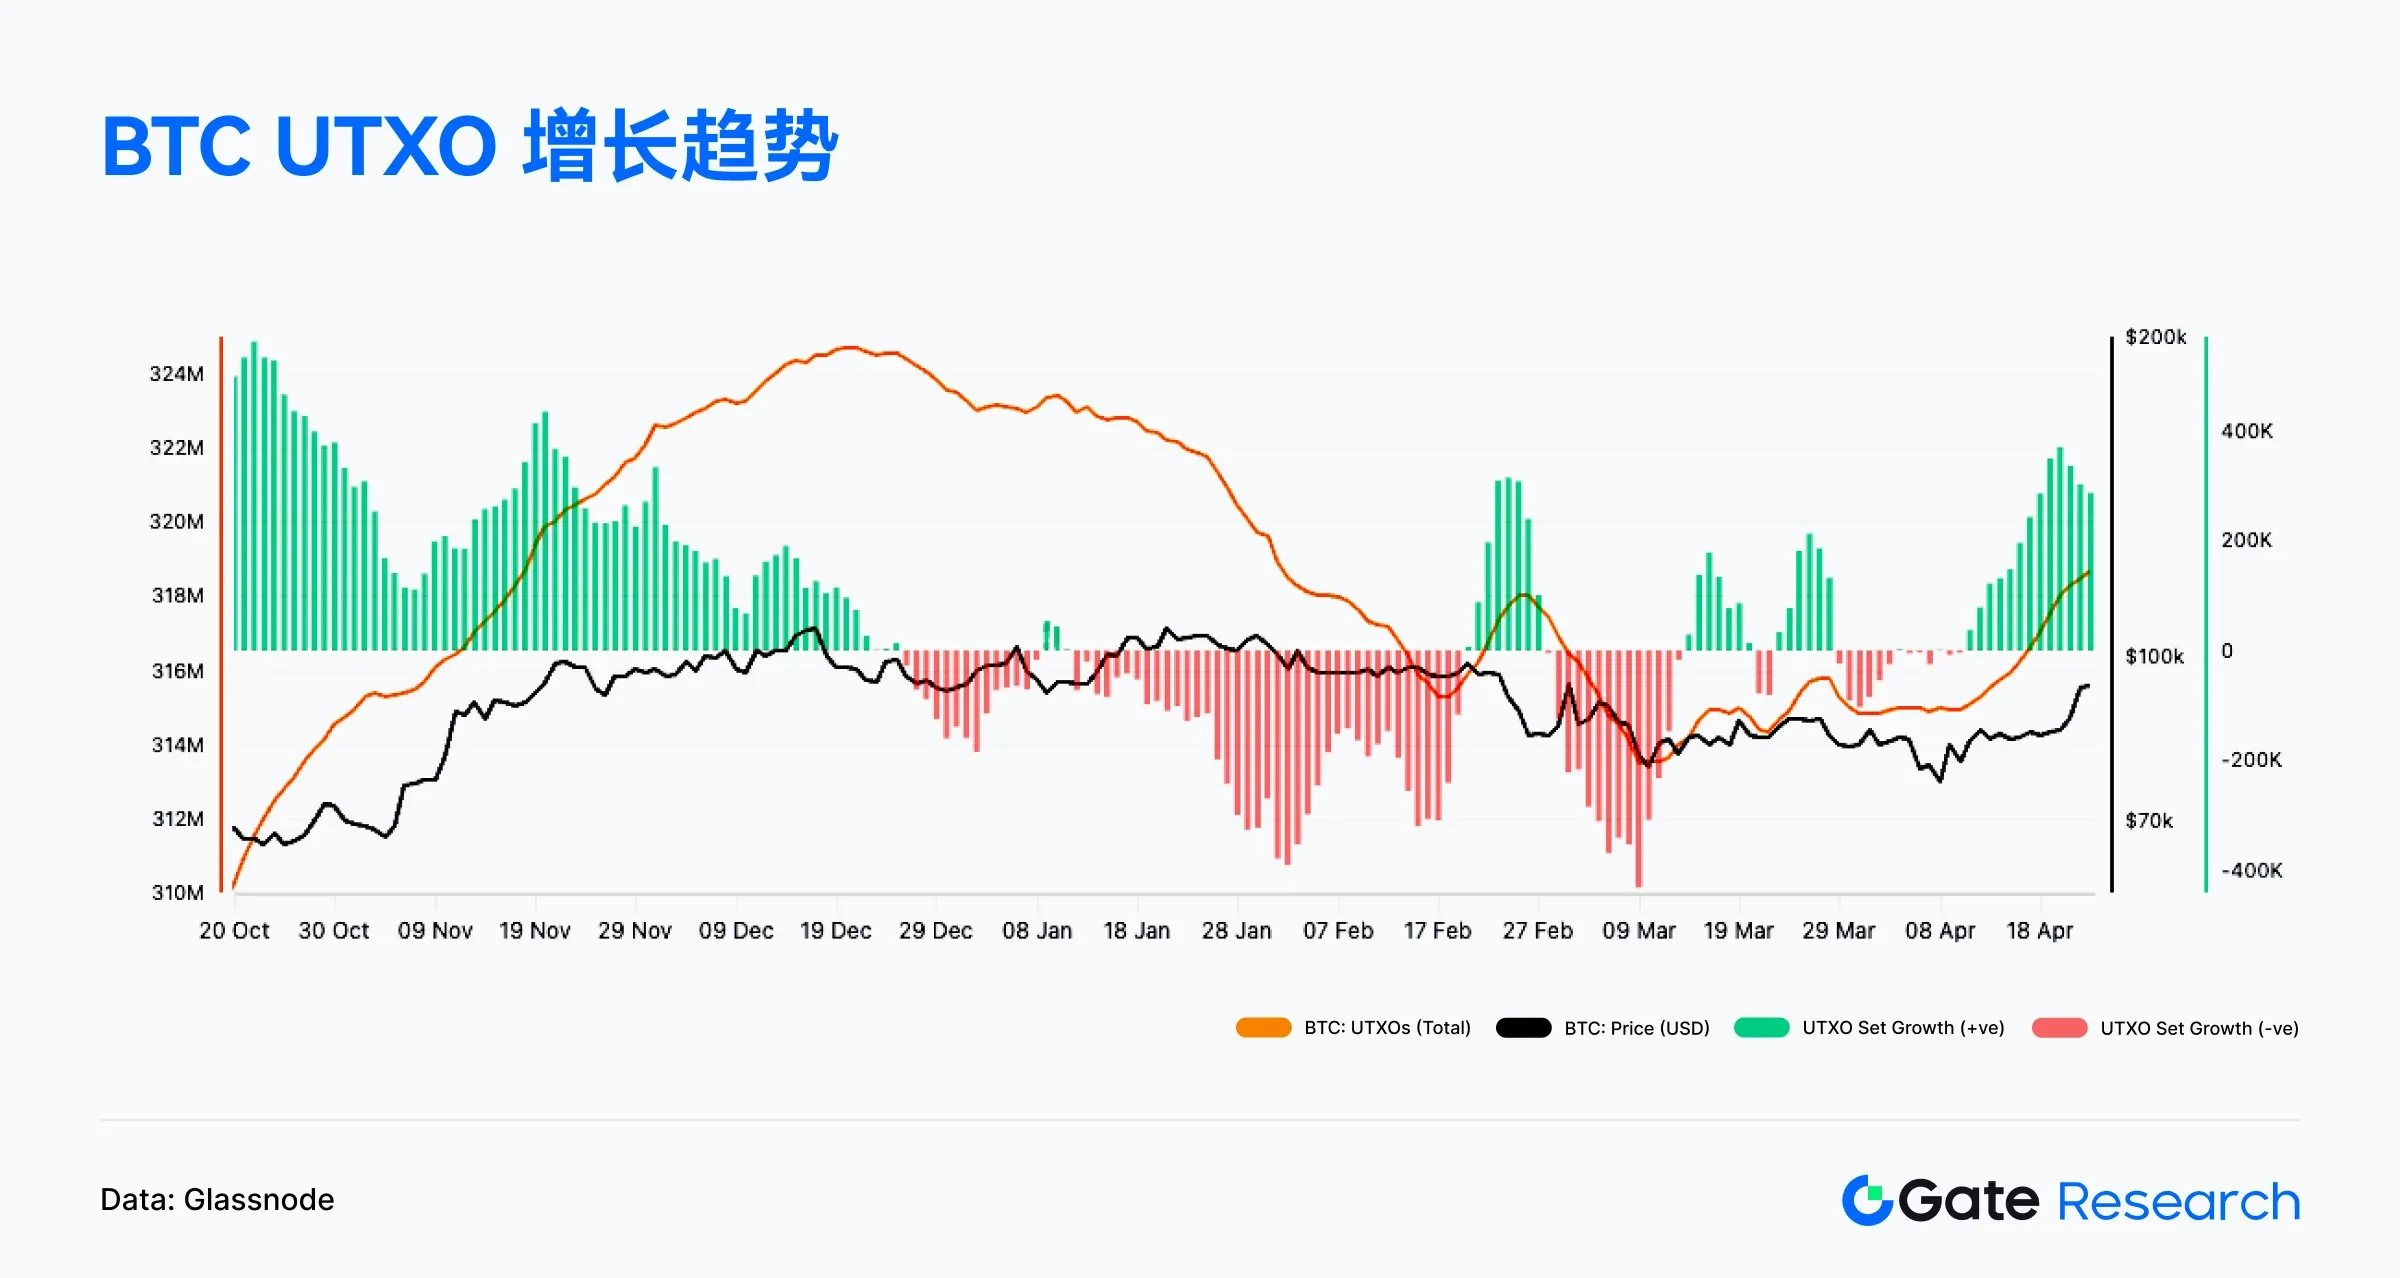
UTXO (Unspent Transaction Output) is the most basic accounting unit in Bitcoin, which can be seen as "change" that has not yet been used, controlled by the private key of the corresponding address until it is used in the next transaction. Its mechanism ensures the transparency and traceability of the blockchain and is the core of Bitcoin's decentralized structure. Changes in the total number of UTXOs reflect on-chain activity; an increase usually indicates a rise in transaction frequency, new addresses, or capital dispersion, representing network activity; a decrease may indicate transaction consolidation, a reduction in users, or market hesitation, reflecting a slowdown in network usage.
According to on-chain data from Glassnode, since April 11, the net growth value of UTXO has continued to turn positive, with a noticeable increase in the green bar portion, indicating that network activity is gradually rebounding, and on-chain transaction behavior is becoming more frequent. Meanwhile, the total UTXO amount has also begun to rise, echoing the upward trend in Bitcoin prices, suggesting that the market may be experiencing a new growth cycle or is in the early stages of recovery. This indicator provides important reference for on-chain capital flow and user participation, often seen as a leading signal for assessing market heat and on-chain health.【7】
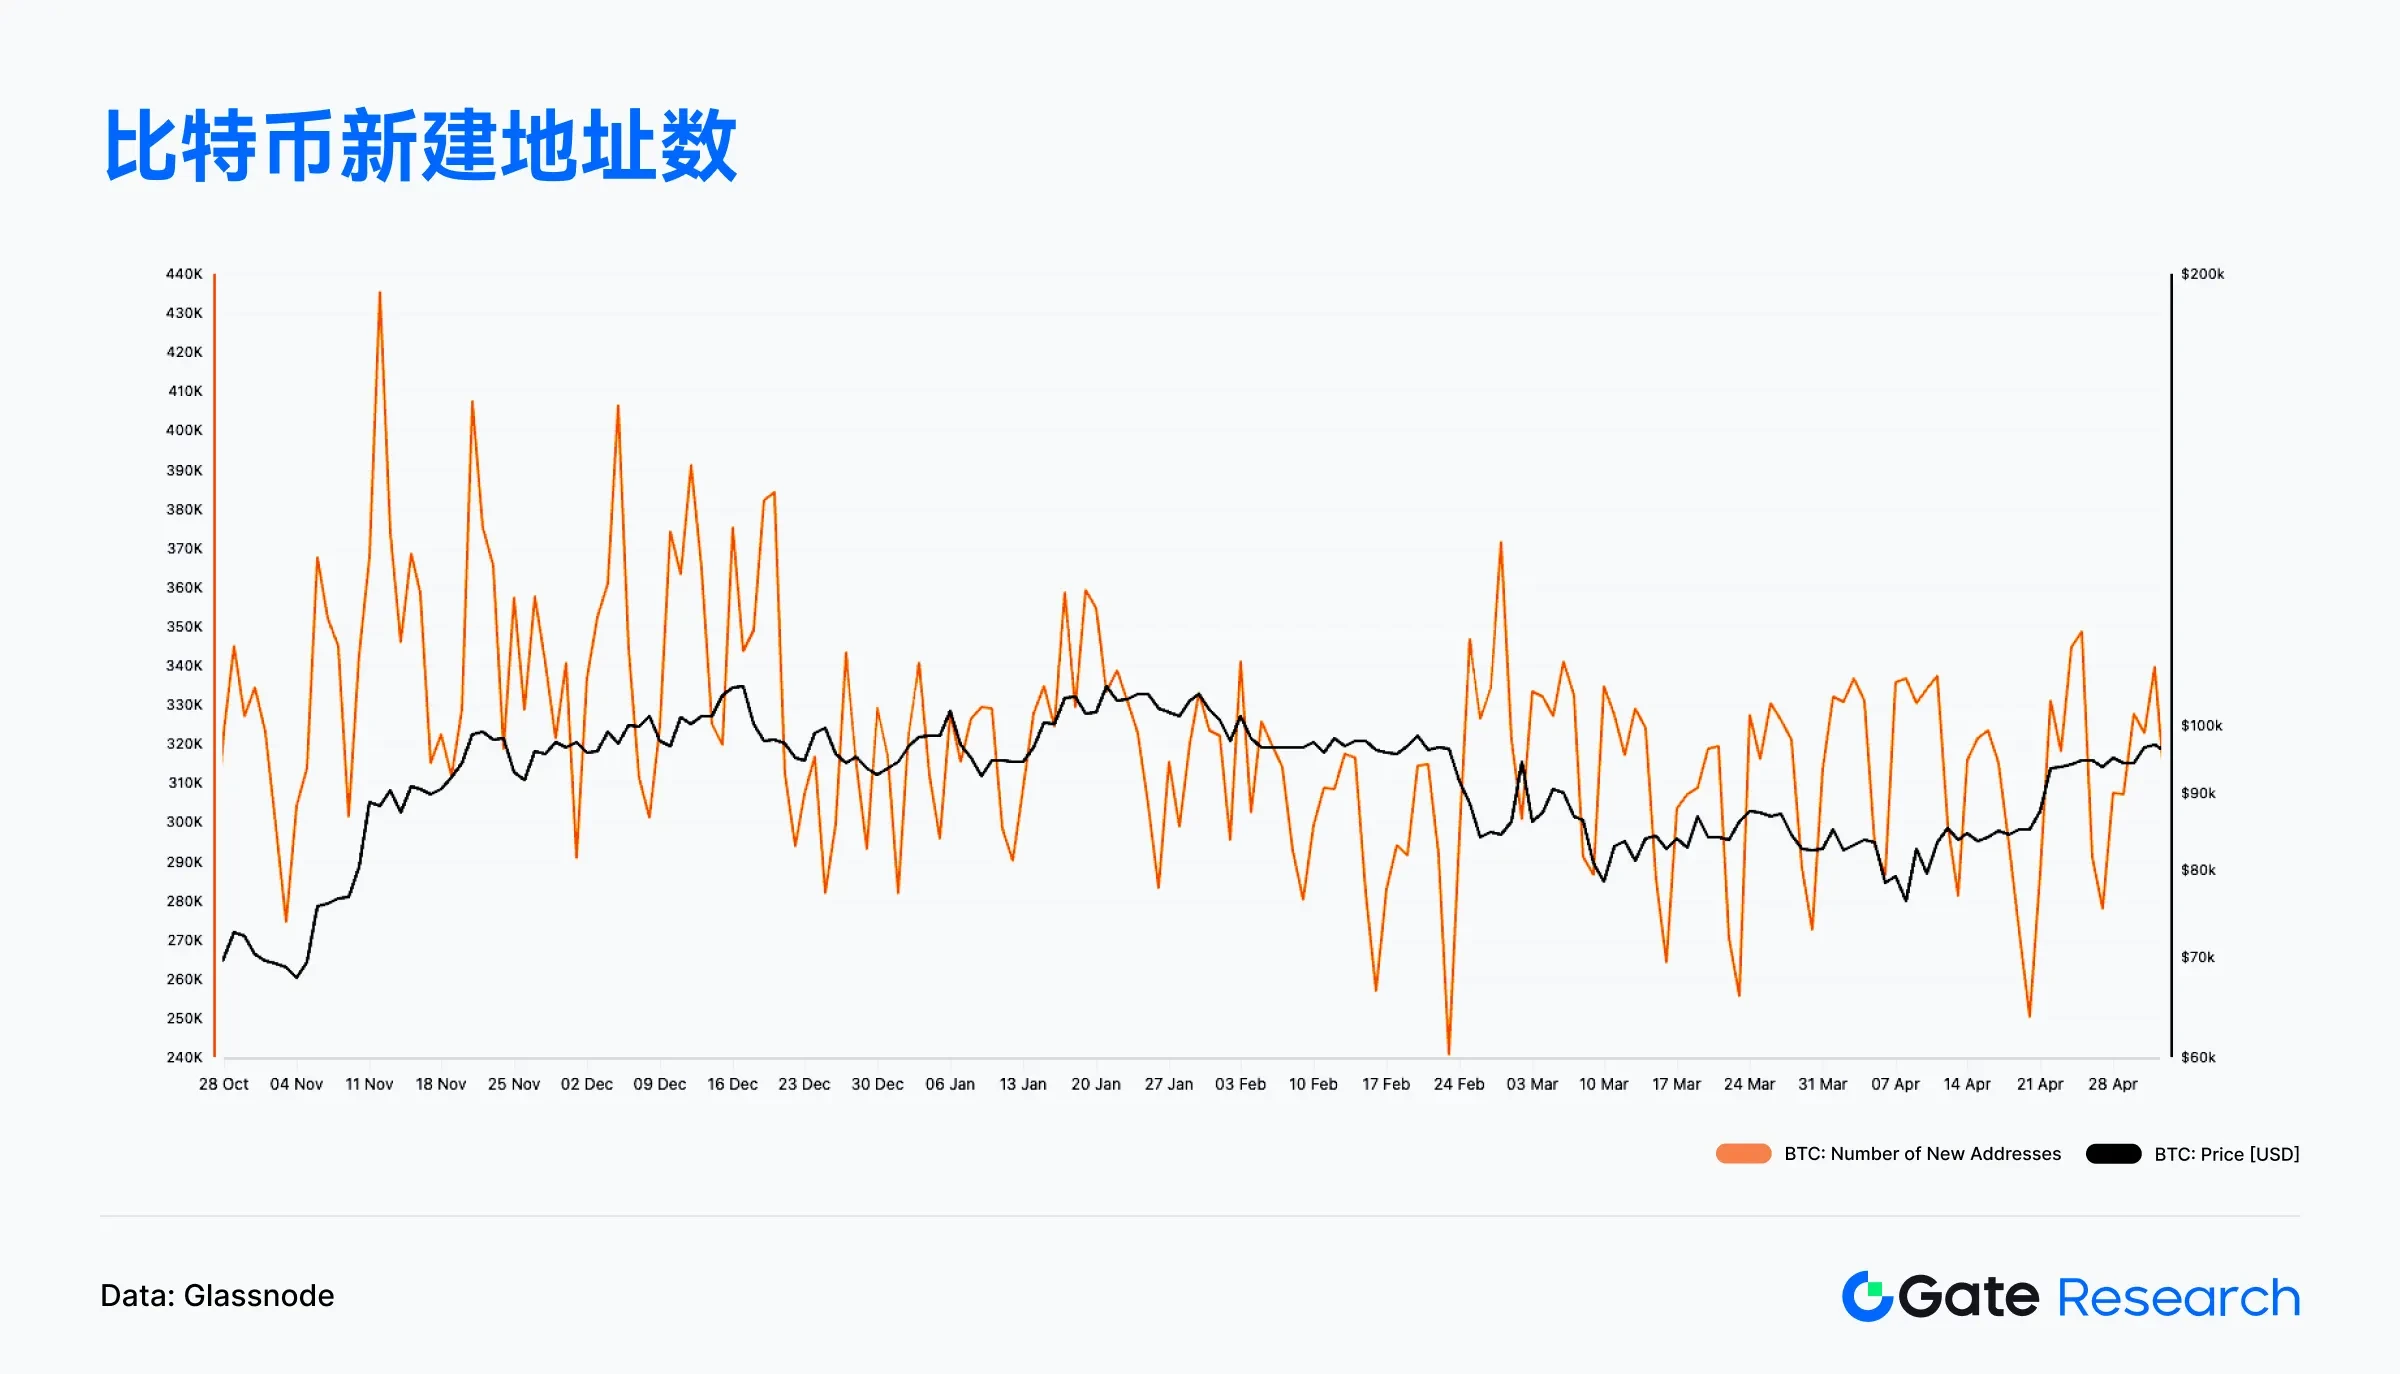
It is worth noting that although UTXO turned positive in April, reflecting an increase in on-chain transaction activity, the number of new addresses did not show significant growth. According to Glassnode data, the number of new addresses during April remained roughly between 300,000 and 350,000 daily, lacking a significant breakthrough, indicating that this round of on-chain recovery is more driven by the return of existing users and an increase in transaction frequency rather than the entry of new investors.
This structural characteristic indicates that the current market is still in a recovery phase dominated by existing users, with new users yet to form a trend of expansion. Although on-chain indicators are overall positive, to support a longer-term price increase, it is still necessary to continuously monitor whether the number of new addresses increases in tandem with rising prices to verify whether the market has entered a new phase driven by "incremental capital."【8】
- The Proportion of Profitable Bitcoin Addresses Rises to 93%, Market Sentiment Warms Up
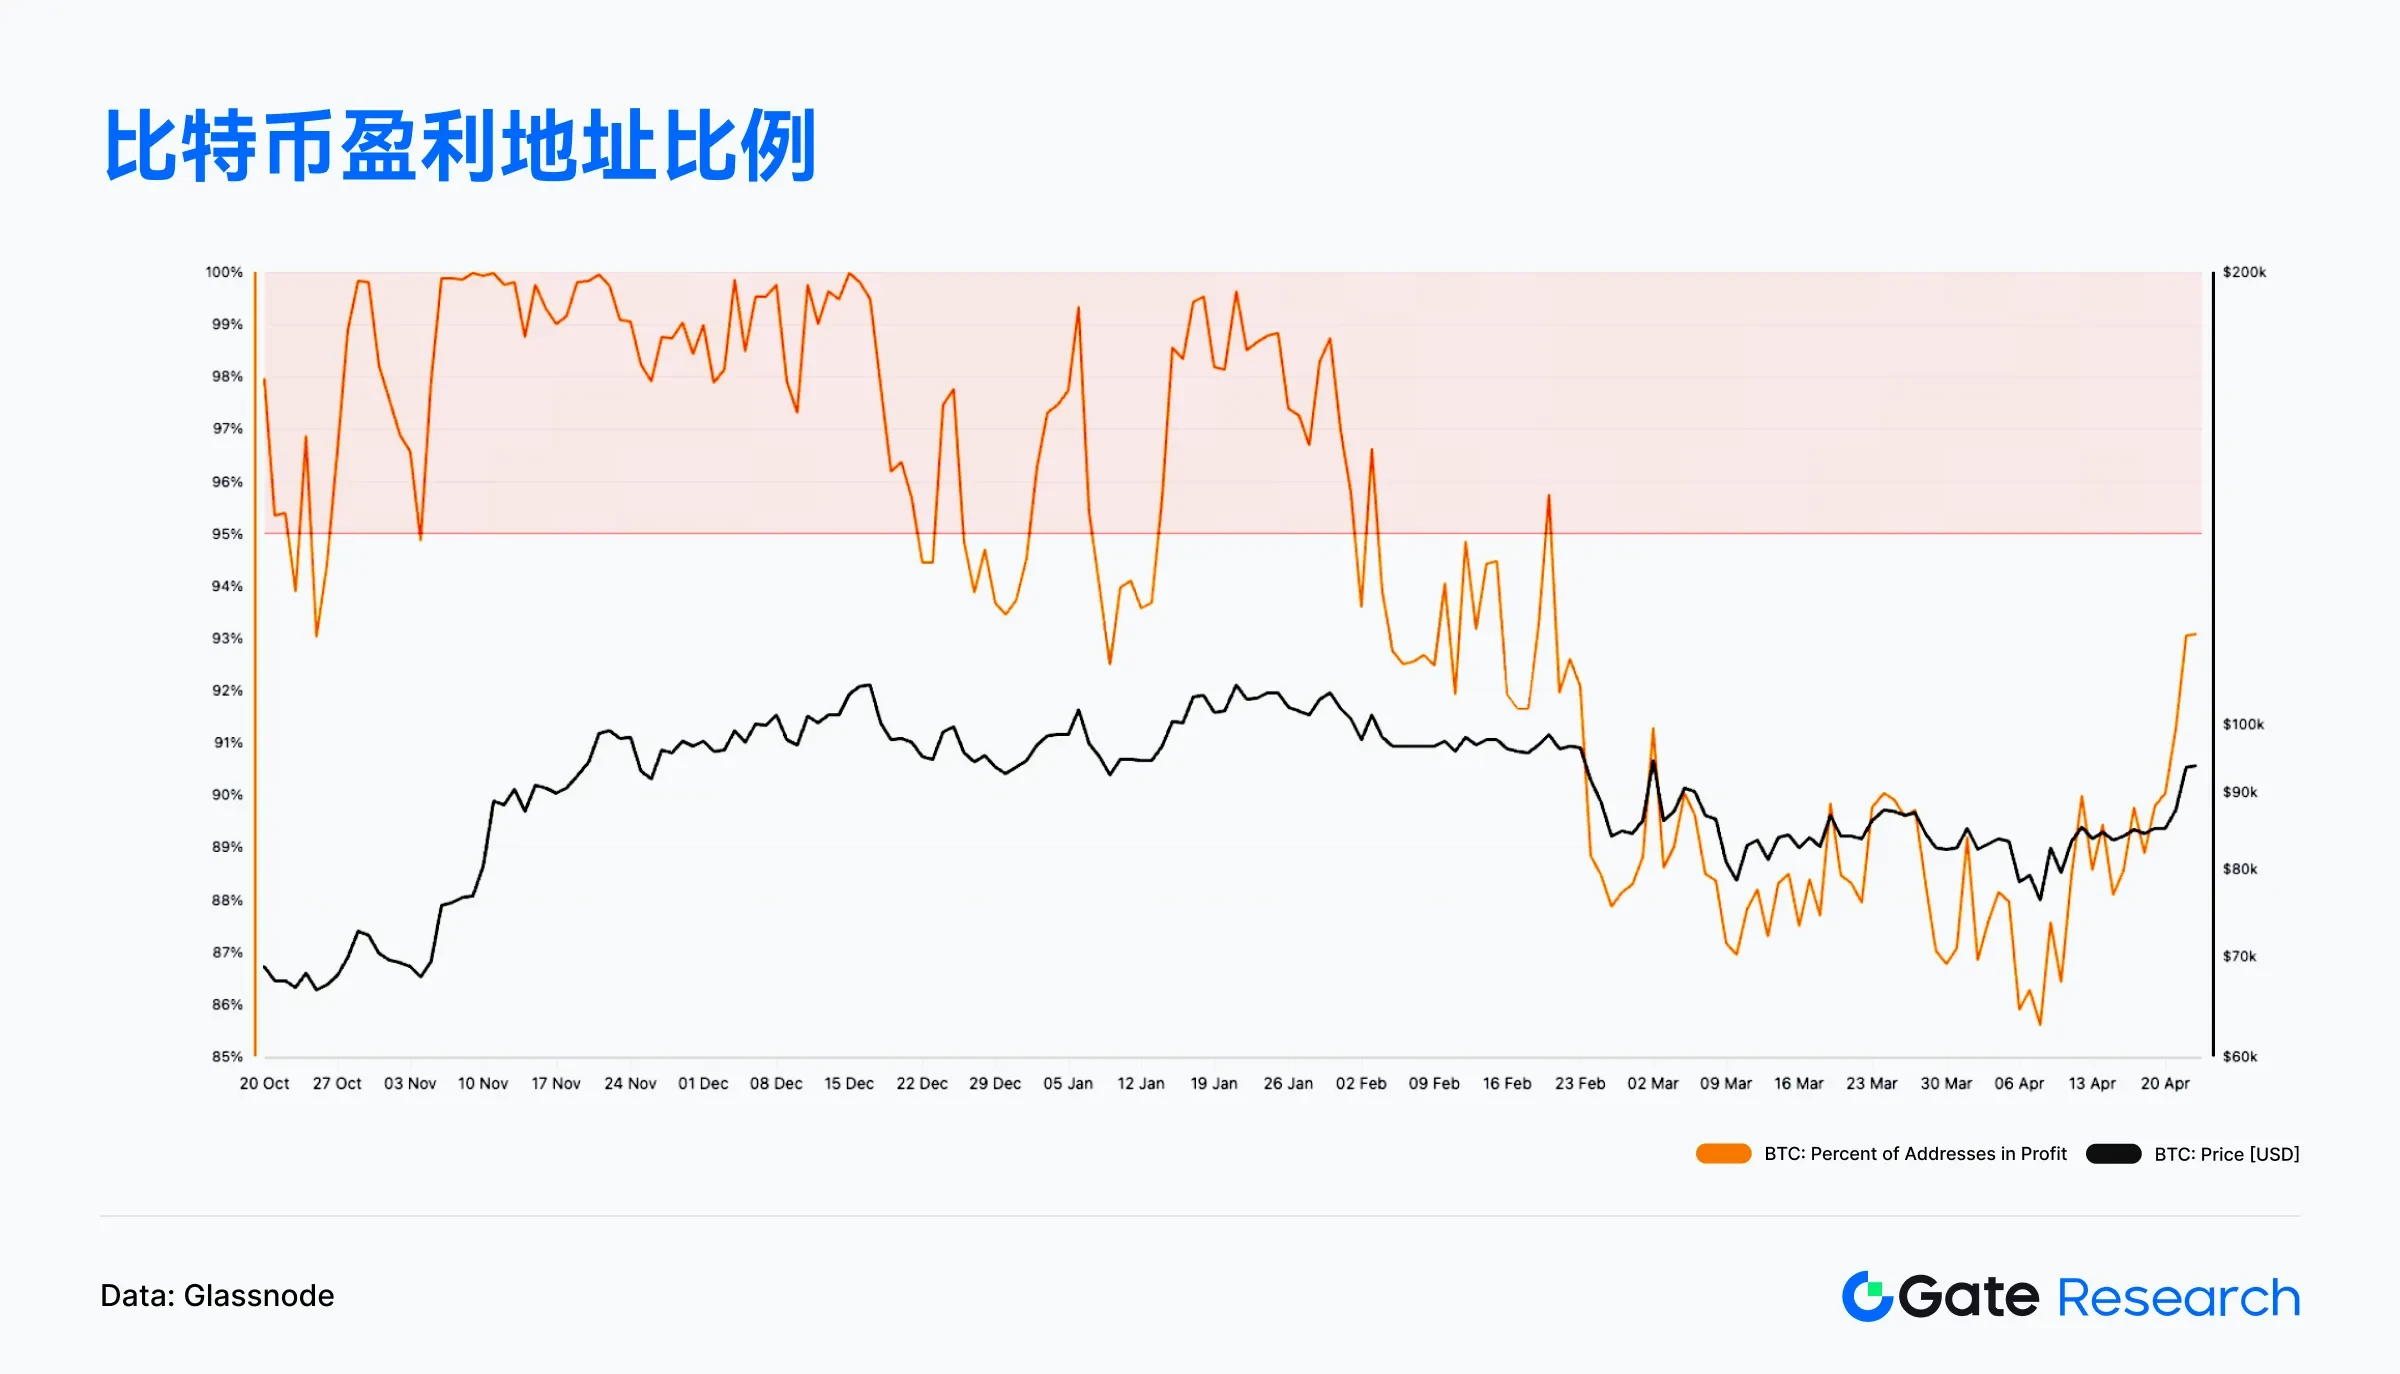
As existing users return and increase interaction frequency, market sentiment is gradually warming up alongside the price rebound, which can be further observed from the changes in the proportion of profitable addresses. According to Glassnode data, during the recent rebound in Bitcoin prices, the proportion of addresses in profit on-chain has also increased. This indicator (Percent of Addresses in Profit) represents the percentage of addresses where the current price is above the average purchase price, which can be used to measure the overall "profit status" of the market.
From the chart, since the price of Bitcoin began to rise in mid-April, this proportion has quickly rebounded and currently stands at 93%. This means that the majority of investors have returned to a profitable state, and the pressure from earlier adjustments is rapidly easing. This trend typically indicates that market sentiment is shifting from pessimistic to neutral or even bullish, which not only helps stimulate new buying momentum but may also be accompanied by some profit-taking. If prices continue to operate at high levels and drive the proportion of profitable addresses even higher, the market may enter the early stages of a new upward cycle.【9】
- Market Trend Summary
The on-chain ecosystem in April showed significant differentiation, with Solana maintaining its dual championship in transaction volume and gas revenue, demonstrating strong main chain capabilities; Base and Sui showed increased activity, revealing potential. Although Ethereum led in fund inflows, its on-chain activity remained relatively stable; Berachain and Polygon PoS faced outflow pressures. Overall, mainstream chains are consolidating their leading positions, while competition among emerging chains is intensifying.
From the comprehensive on-chain data, Bitcoin is currently in the early stages of a structural rebound, with large holders entering the market first and continuously accumulating, becoming an important driving force behind this price recovery. The on-chain unspent transaction outputs (UTXO) have turned positive since mid-April, with transaction frequency and network activity rising in tandem, indicating a recovery of on-chain momentum. However, it is important to note that Glassnode data shows that the number of new addresses did not significantly increase during April, maintaining an average of 300,000 to 350,000 daily, indicating that the current recovery is mainly driven by existing users, with widespread new capital yet to enter.
At the same time, the proportion of profitable addresses has rapidly risen to 93%, reflecting that the majority of investors in the market have returned to a profitable state, with panic sentiment significantly alleviated, and sentiment gradually shifting to neutral to bullish. If price and on-chain activity indicators continue to strengthen and drive new user growth, the market is likely to welcome further incremental capital inflows, entering the next upward cycle.
Popular Projects and Token Dynamics
Overview of Popular Project Data
- LaunchLab
Raydium, a leading decentralized exchange in the Solana ecosystem, officially launched the token issuance platform LaunchLab on April 16, providing creators and developers with low-threshold, uncensored on-chain token issuance and liquidity launch tools.【10】 Users can issue tokens using various pricing curves (linear, exponential, logarithmic) and quote assets (such as SOL), integrating AMM V4 and locking mechanisms; creators can also continue to earn 10% of AMM trading fees after their tokens "graduate."
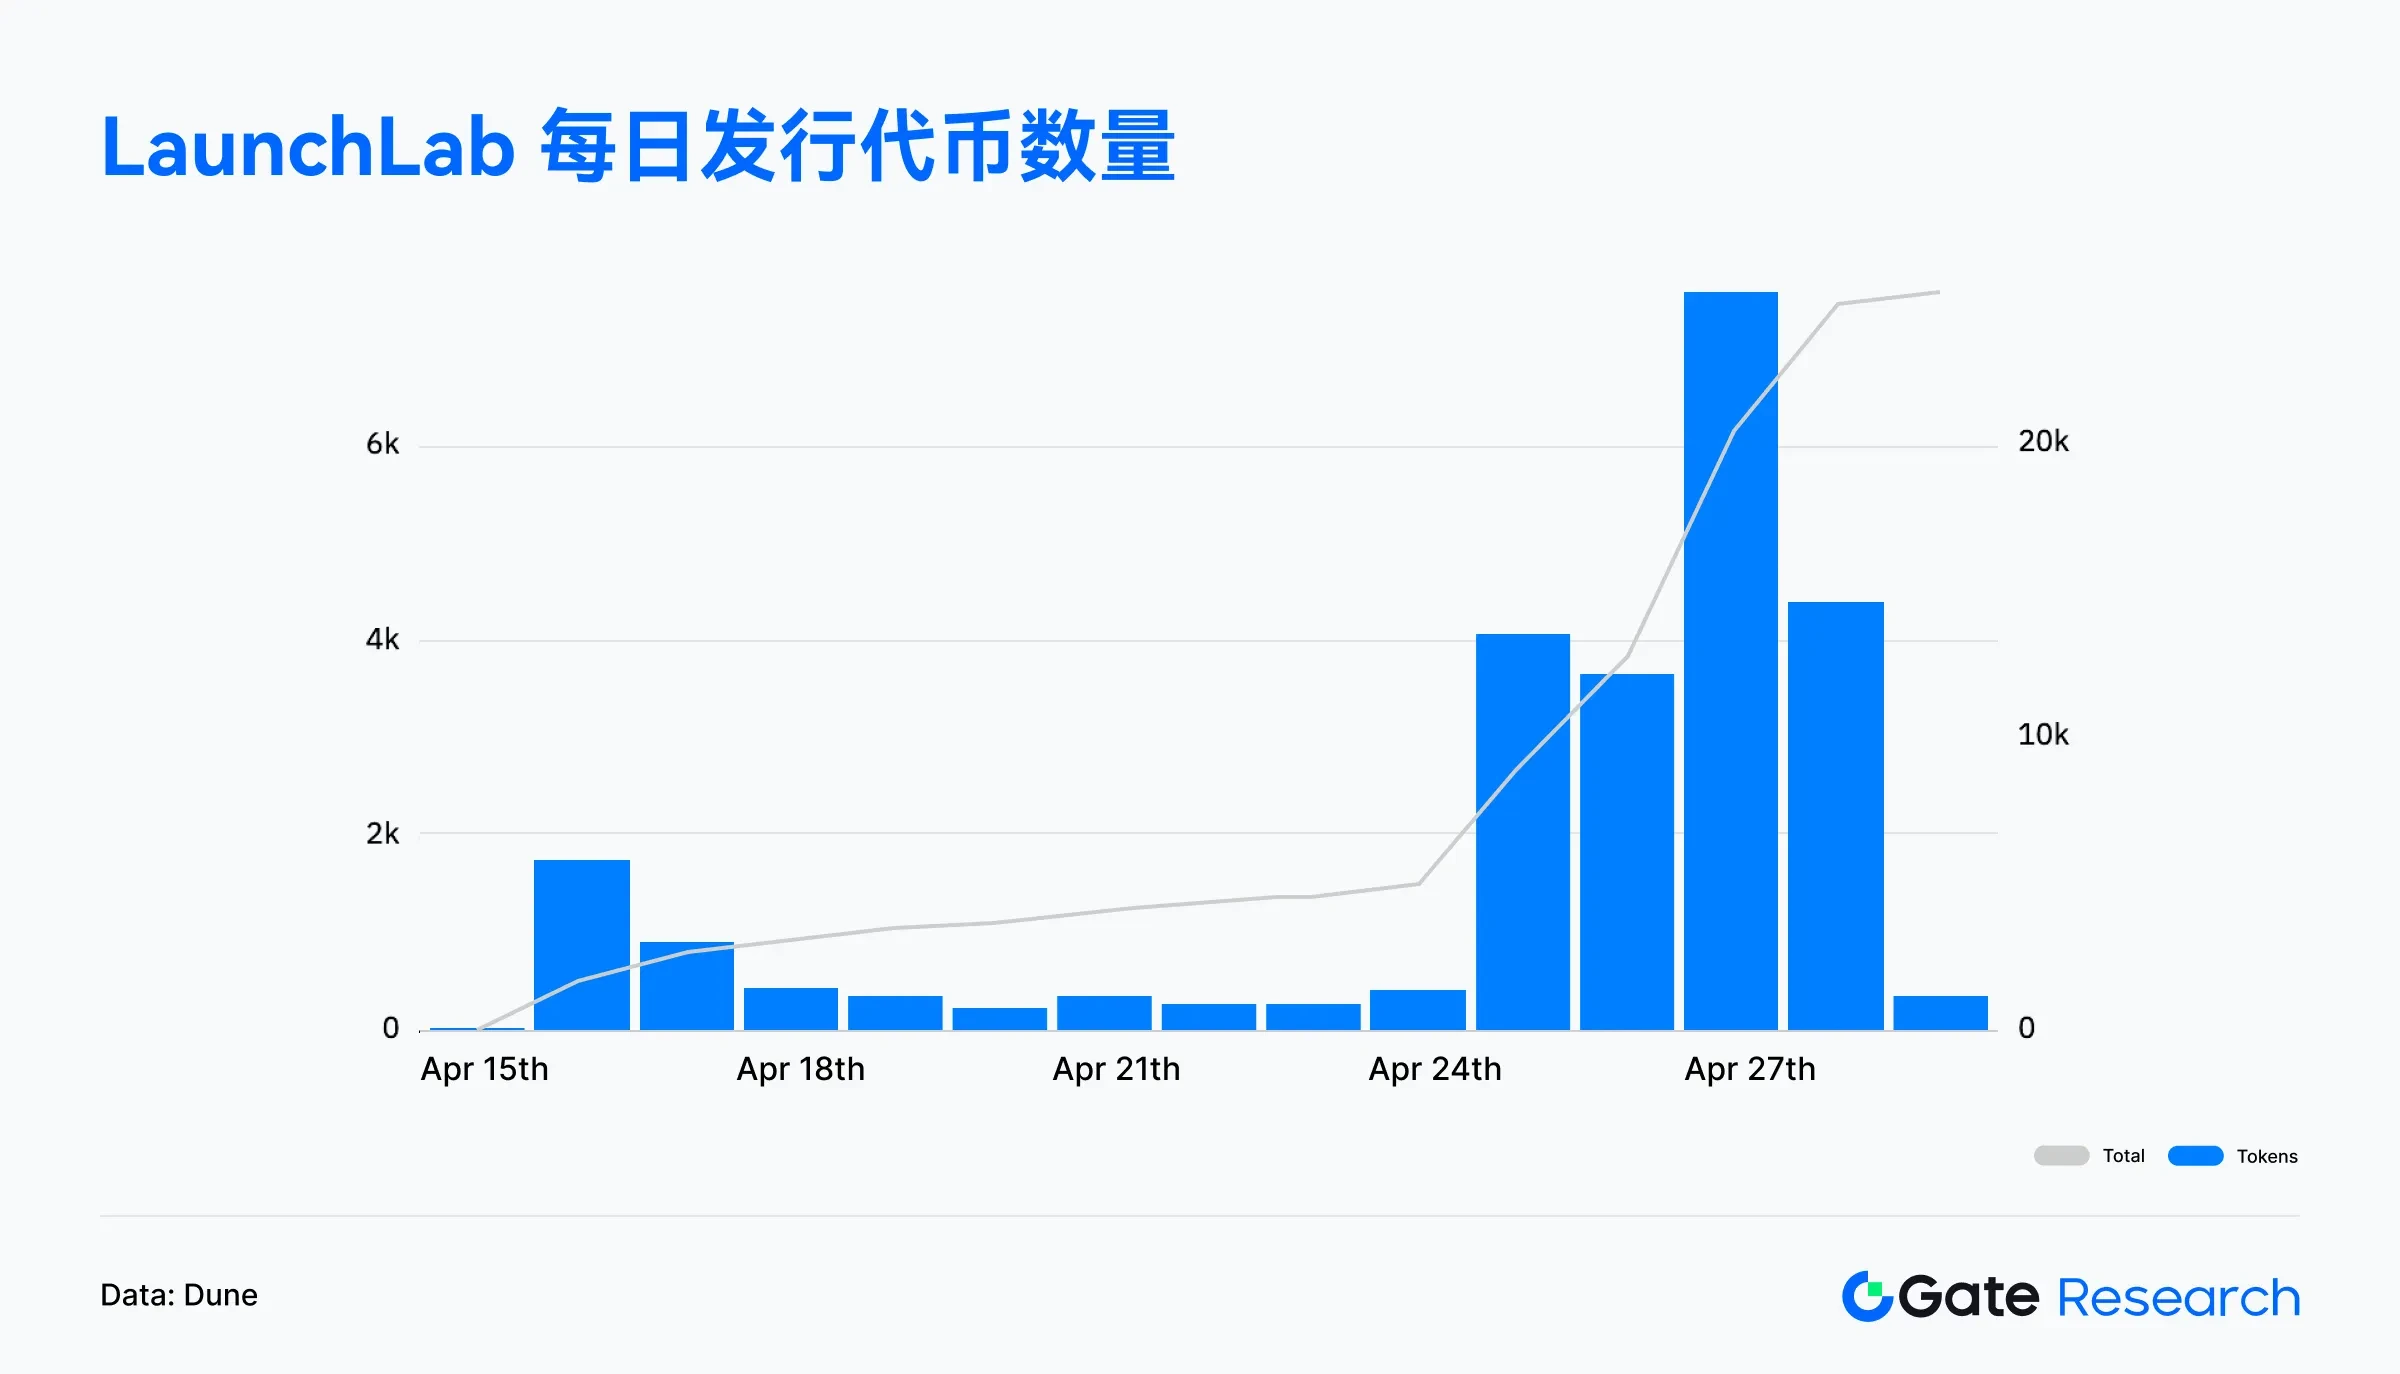
As of April 28, nearly two weeks after its launch, the LaunchLab platform has created a total of 25,207 tokens, of which only 211 (0.84%) successfully raised funds and migrated to AMM liquidity pools, indicating a high success threshold. The peak of token creation occurred on April 27, with over 7,500 tokens created in a single day; the peak of graduating tokens was concentrated on April 25 and 26, with a total of over 110 tokens graduating in those two days. Overall, while LaunchLab has lowered the threshold for token issuance, the success of projects still heavily relies on team strength and market recognition.【11】
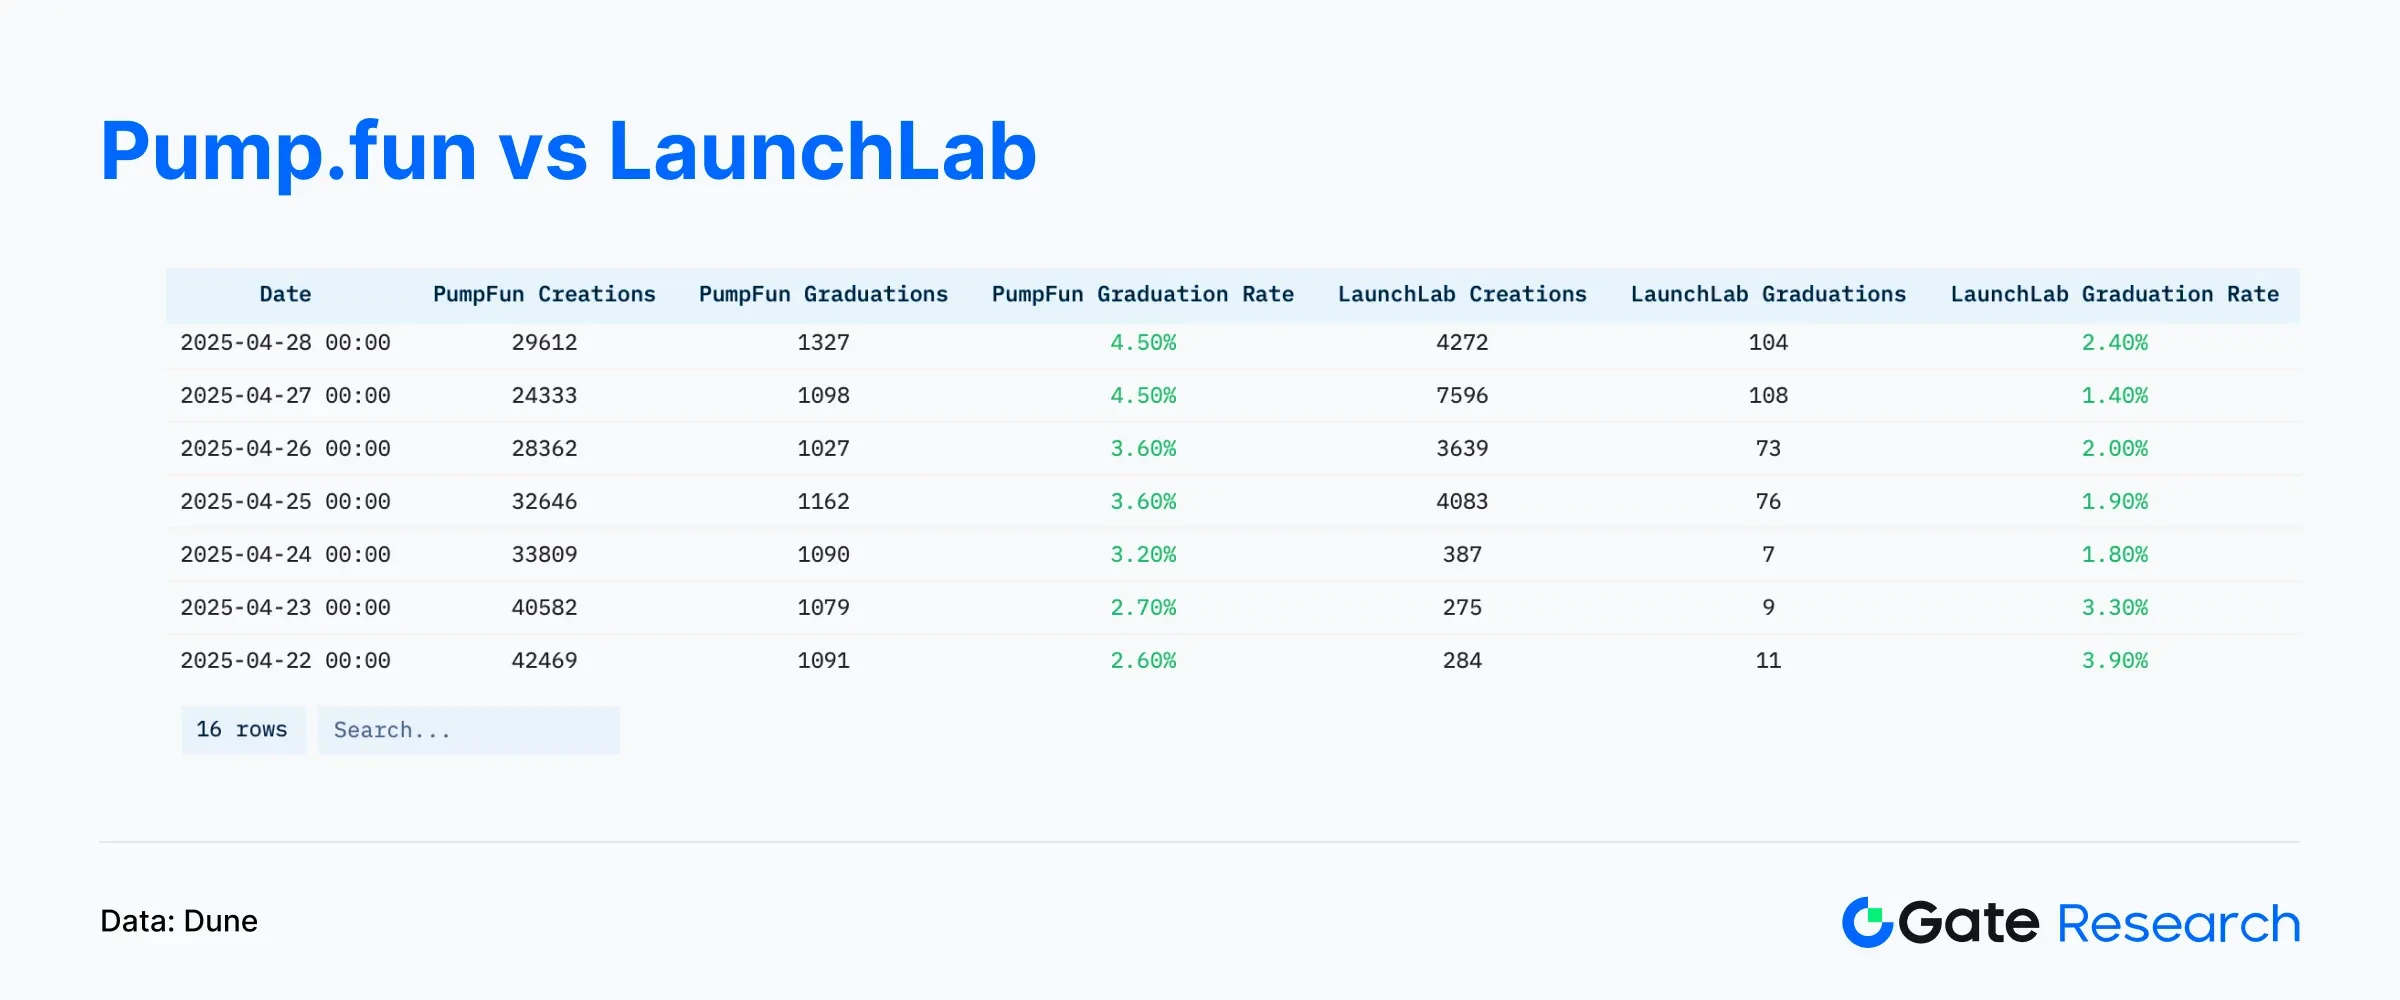
For example, on April 28, the two major token issuance platforms on the Solana chain formed a stark contrast:
• Pump.fun created 29,612 tokens, of which 1,327 successfully graduated, with a graduation rate of 4.5%.
• Raydium's LaunchLab created 4,272 tokens, of which 104 successfully graduated, with a graduation rate of 2.4%, significantly lower than Pump.fun.【12】
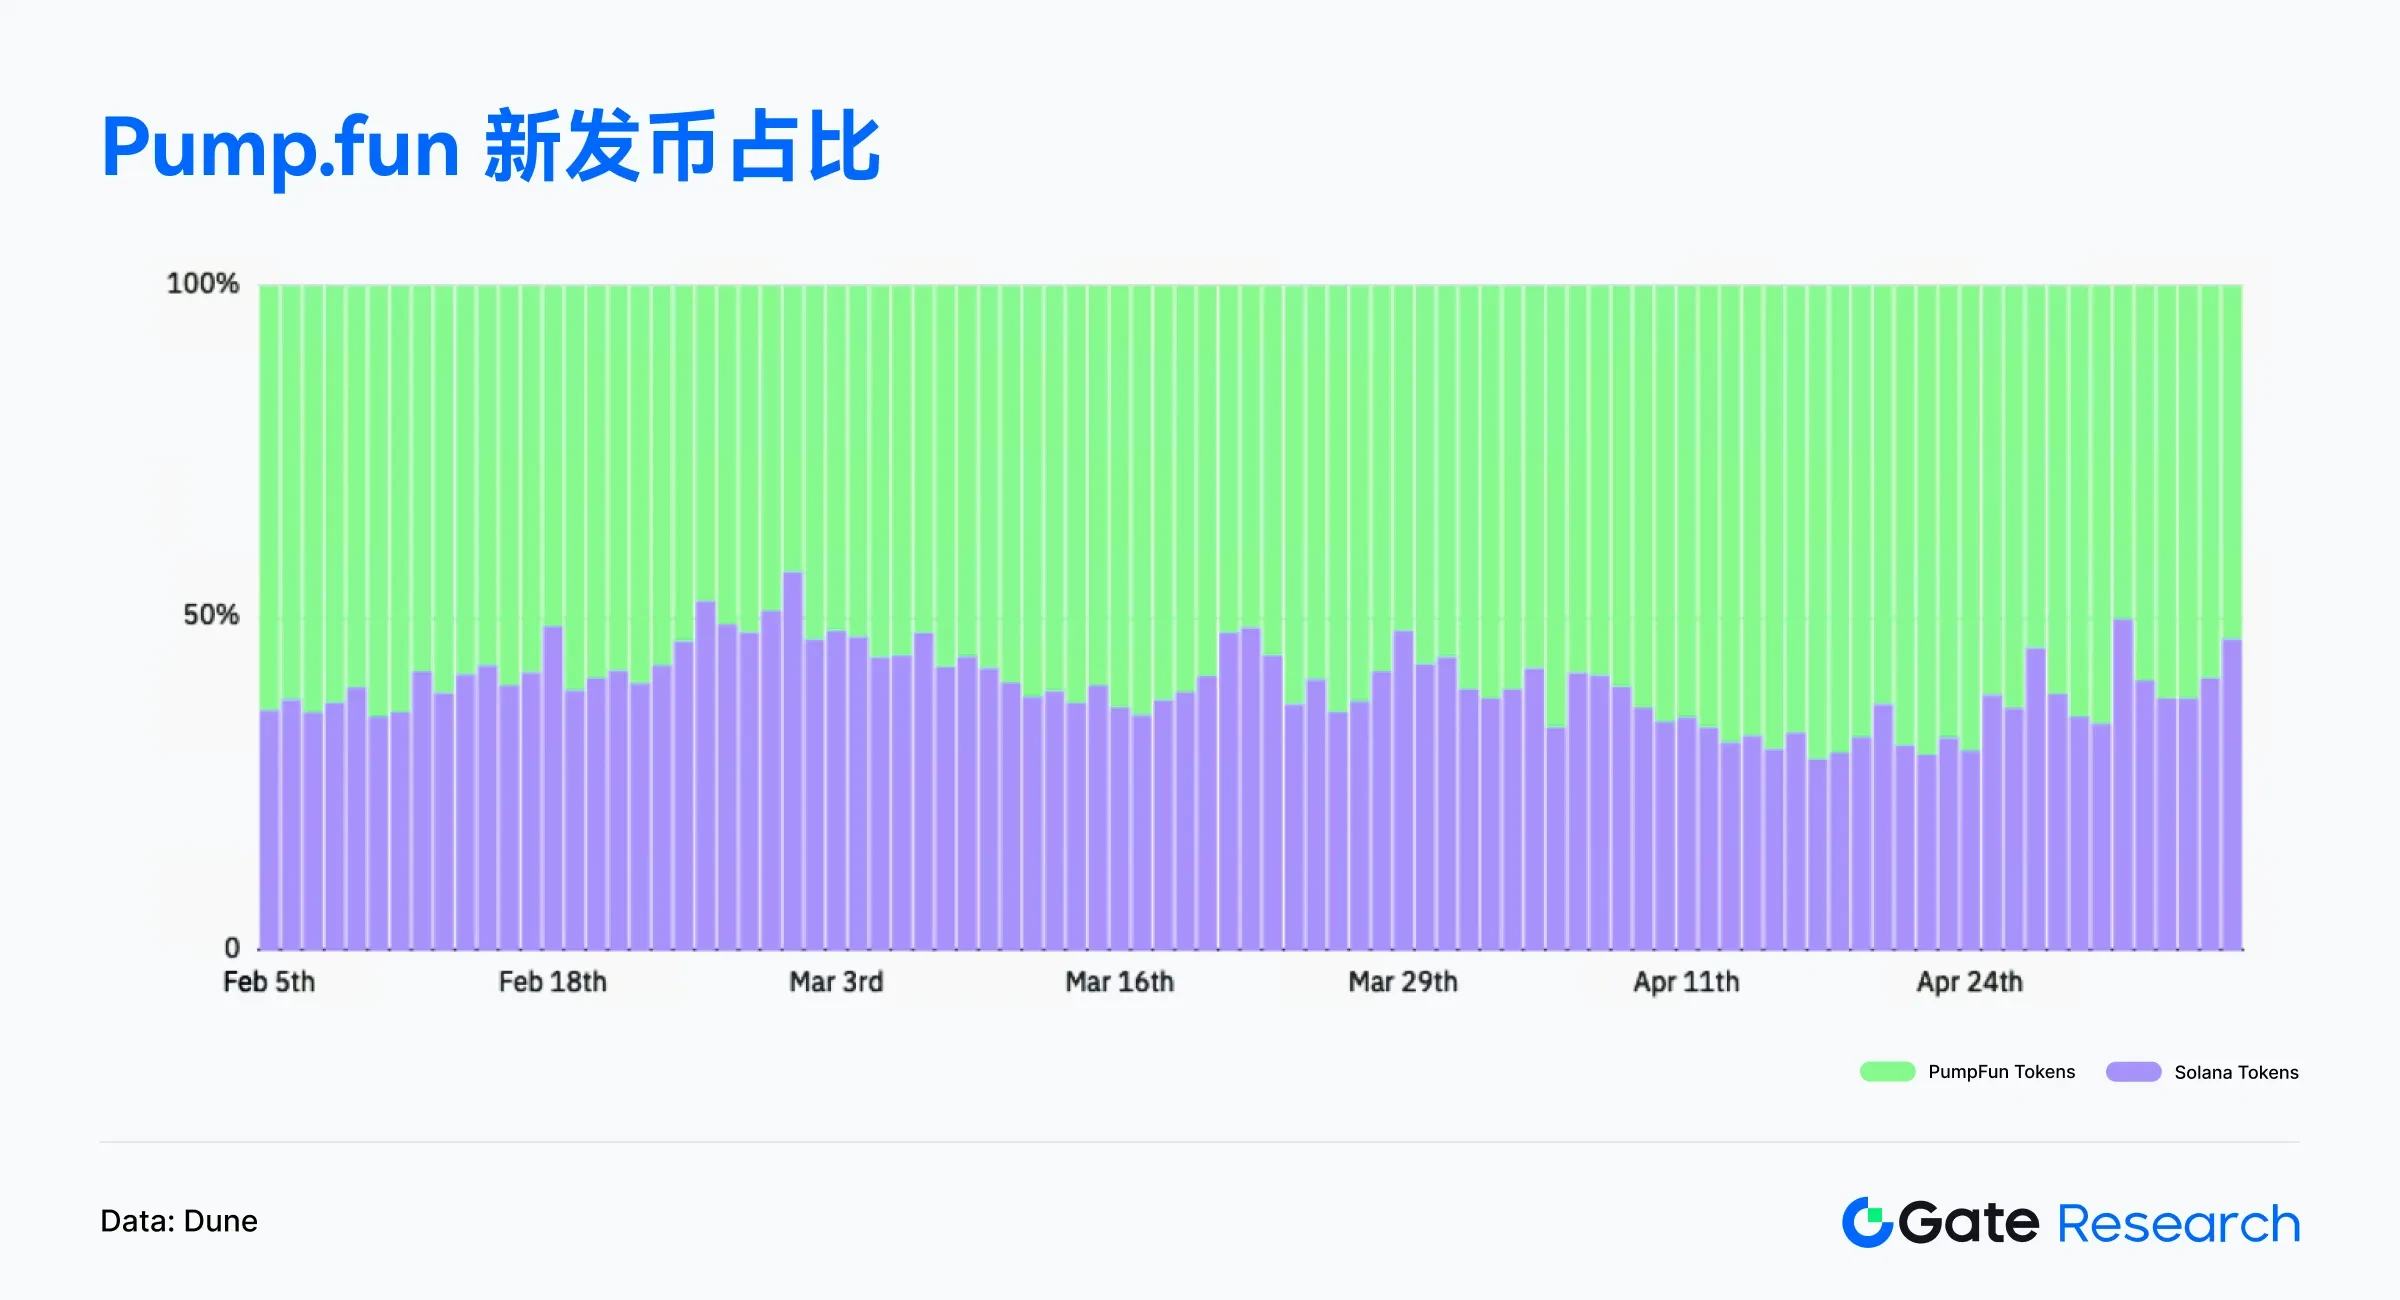
The number of new tokens created by Pump.fun has long occupied the majority share of the total issuance on the Solana chain, and even after the launch of LaunchLab, its proportion remains high. Especially in early March and late April, Pump.fun's daily issuance share once exceeded 65%, indicating that it still leads in terms of issuance quantity and user activity. Although LaunchLab offers a more flexible issuance mechanism and economic incentives, in terms of penetration and market dominance, Pump.fun remains the primary token issuance platform on Solana at present.【13】
Overall, LaunchLab, as a new token issuance platform launched by Raydium, has quickly gathered a large number of creators and project parties in a short time, demonstrating strong ecological appeal and on-chain innovation vitality. Although the overall graduation rate is still in the early development stage, the platform has successfully lowered the issuance threshold, enriching the application and asset diversity on the Solana chain, laying a solid foundation for the incubation and growth of more quality projects in the future. As market mechanisms continue to improve and community ecology matures, LaunchLab is expected to become an important force in promoting financial innovation and enhancing user participation on the Solana chain.
Overview of Popular Token Data
$TRUMP — The TRUMP token is a meme coin themed around political figures, deployed on high-performance blockchains like Solana, favored by developers for its low transaction costs and convenient issuance mechanism. This token is based on the public image of the current U.S. President Donald Trump and is widely used in the PolitiFi (political finance) sector, combining community culture, hot events, and social media dissemination to successfully attract market attention.
- On-chain Activity
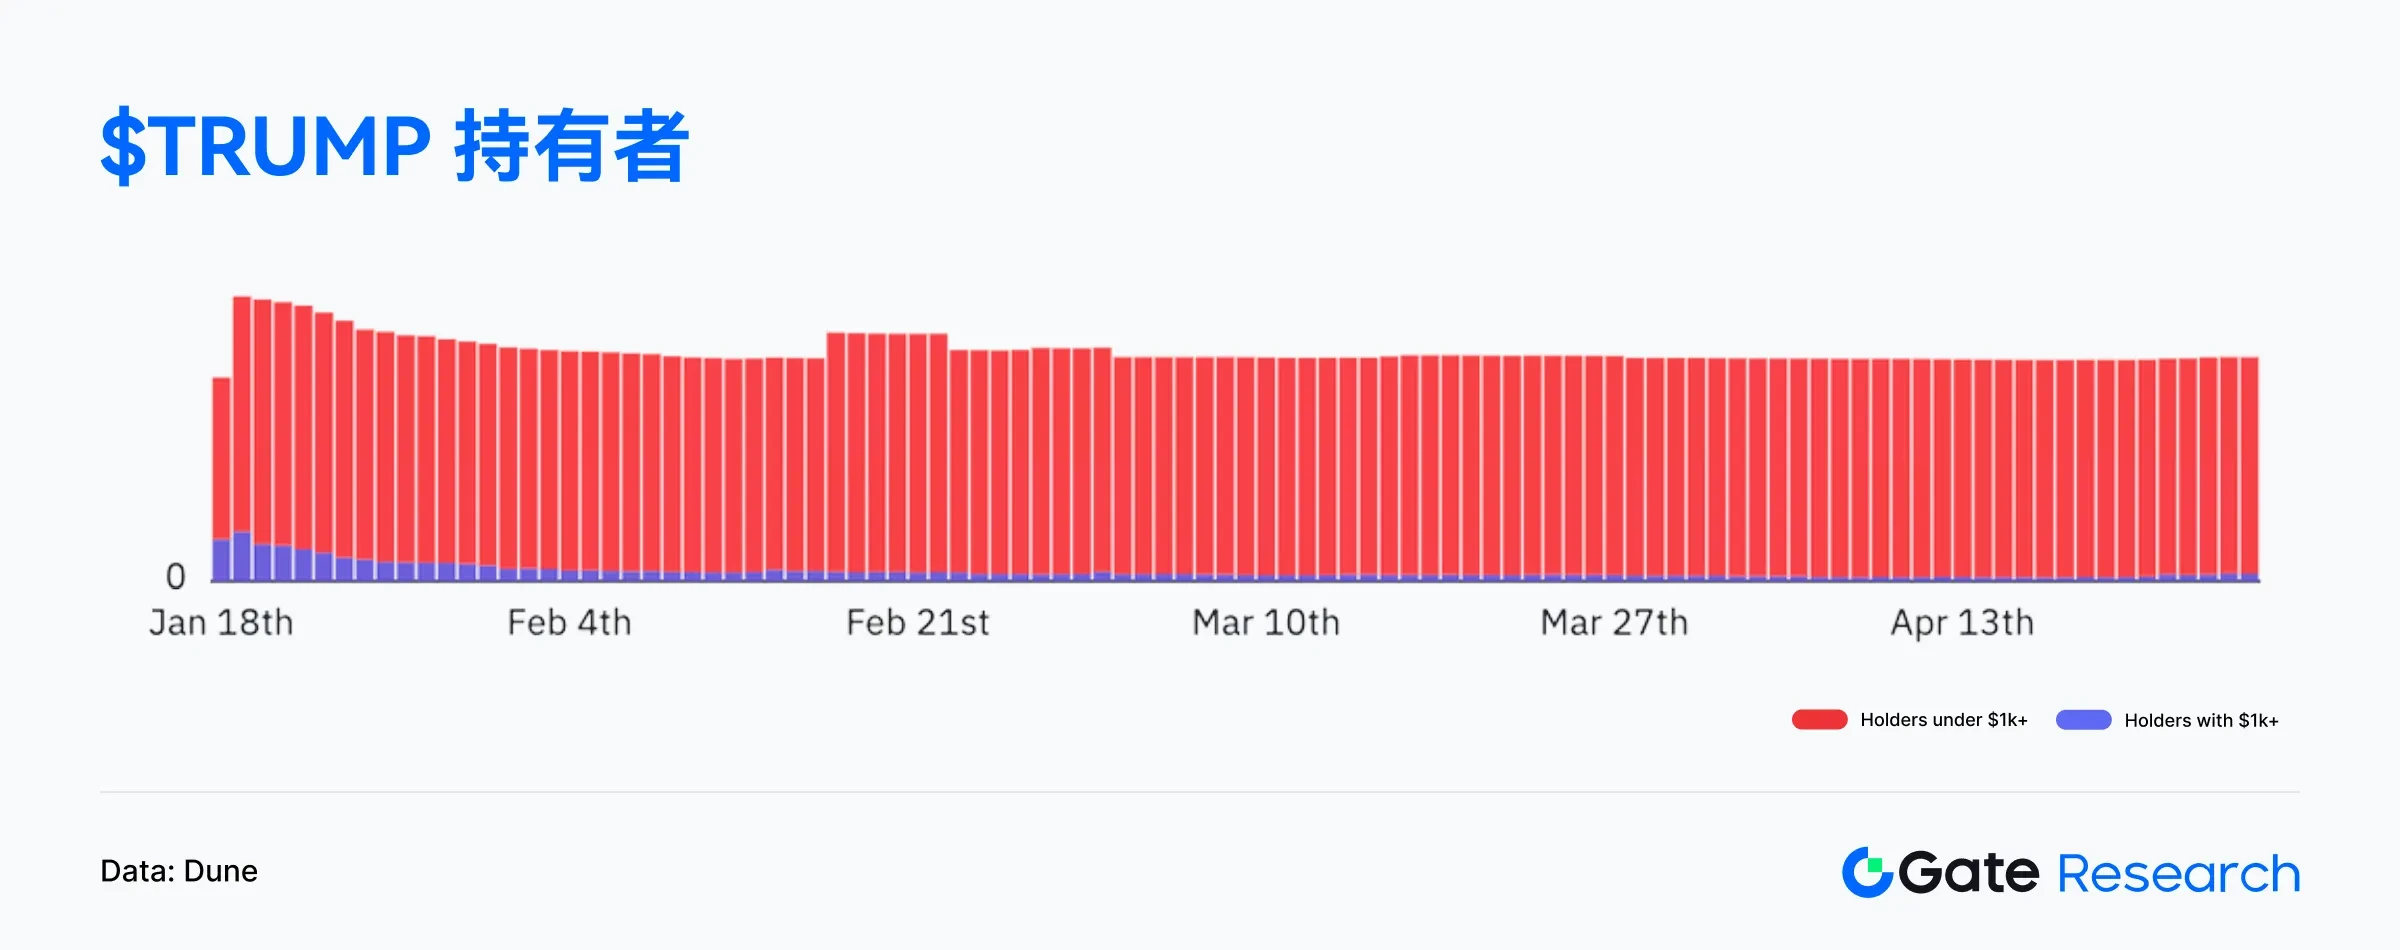
The recent price surge of $TRUMP was primarily driven by market news, as President Trump announced on April 24 that he would have dinner with the first 220 $TRUMP holders at a golf club near Washington in May, and specifically invited the top 25 holders to participate in a private reception and White House tour. This news quickly spread on social platforms, igniting market sentiment and pushing the price of $TRUMP up over 50% in a short time, making it one of the core hotspots in the recent meme coin market.【14】
This event not only significantly boosted the on-chain activity of $TRUMP but also rekindled market interest in the potential of the PolitiFi sector. Investors began actively participating in the ranking competition for holdings and paying attention to whether more similar incentive mechanisms would be introduced in the future. On-chain data shows that since the announcement on April 24, the number of $TRUMP addresses holding over $1,000 in value has increased from about 18,000 to 21,900, a growth of over 21%; the total number of holding addresses also rose from 640,000 to 643,000, further confirming that market enthusiasm has spread from the core community to a broader user base, showcasing the strong dissemination and attraction capabilities of political meme coins driven by topical events.【15】【16】
It is noteworthy that, according to Chainalysis data, since the launch of $TRUMP, its issuing team has accumulated over $320 million in revenue from transaction fees, reflecting that the project possesses strong capital-raising capabilities beyond mere speculation. On May 5, Trump also promoted the upcoming dinner scheduled for May 22, continuing to amplify market attention and topical discussions. This phenomenon highlights the diversification trend of capital flows in the crypto market and reminds investors to maintain risk awareness when facing such highly volatile assets, carefully assessing their long-term value and sustainability.【17】
Summary
The on-chain ecosystem in April 2025 showed clear differentiation. Solana, with an average daily transaction volume exceeding 93 million and over 4.5 million daily active addresses, continues to maintain its leading position as a main chain, with average daily gas revenue surpassing $1.2 million, indicating that its trading activity is built on a real user base and benefits from active ecological interactions and a surge in token issuance. Base and Sui also showed increased activity, demonstrating the growth momentum of emerging chains.
The on-chain structure of Bitcoin continues to improve, with large addresses accumulating, UTXO turning positive, and the proportion of profitable addresses rising (reaching 93%), collectively supporting the restoration of market confidence. However, the number of new addresses remains between 300,000 and 350,000 daily, indicating that the current rebound is still primarily driven by existing users, with widespread new capital yet to fully activate.
In terms of popular projects, LaunchLab in the Solana ecosystem quickly gathered creator resources, enriching the on-chain asset structure; the political meme coin $TRUMP achieved a short-term price surge of over 50% through offline topics and community incentives, significantly expanding the number of on-chain holders. According to Chainalysis data, its issuing team has accumulated over $320 million in transaction fee revenue, highlighting its dual advantages in dissemination and capital-raising capabilities.
Overall, on-chain activity and capital flows are synchronously rebounding, with ecological development gradually expanding from the foundational chain to the application layer. Coupled with the restoration of market sentiment and a rebound in risk appetite, it is worth continuously tracking the subsequent on-chain trends of mainstream assets and hot protocols.
References:
Artemis, https://app.artemisanalytics.com/chains
Artemis, https://app.artemisanalytics.com/chains
Artemis, https://app.artemis.xyz/project/solana?from=chains&tab=metrics
Artemis, https://app.artemisanalytics.com/flows
X, https://x.com/glassnode/status/1915315537657180420
Glassnode, https://studio.glassnode.com/dashboards/btc-addresses
Glassnode, https://studio.glassnode.com/charts/55872440-322a-49c4-7022-499d546b2f98?s=1729758433&u=1745483233
Glassnode, https://studio.glassnode.com/charts/addresses.NewNonZeroCount?ema=0&mAvg=0&mMedian=0&s=1730390400&u=1745809904&zoom=
Glassnode, https://studio.glassnode.com/charts/addresses.ProfitRelative?s=1729758967&u=1745483767&zoom=182
X, https://x.com/RaydiumProtocol/status/1912496080383799632
Dune, https://dune.com/maditim/raydium-launchpad
Dune, https://dune.com/cryptomancers/memecoins-cold-war
Dune, https://dune.com/cryptomancers/memecoins-cold-war
Bloomberg, https://www.bloomberg.com/news/articles/2025-04-23/president-trump-to-host-dinner-with-top-holders-of-his-memecoin
Dune, https://dune.com/gate_research/official-trump-token
Dune, https://dune.com/seoul/trump
Fortune, https://fortune.com/crypto/2025/05/06/trump-meme-coin-creators-320-million-fees-presidential-dinner-top-holders/
Gate Research Institute is a comprehensive blockchain and cryptocurrency research platform that provides readers with in-depth content, including technical analysis, hot insights, market reviews, industry research, trend forecasts, and macroeconomic policy analysis.
Disclaimer
Investing in the cryptocurrency market involves high risks, and users are advised to conduct independent research and fully understand the nature of the assets and products they are purchasing before making any investment decisions. Gate.io is not responsible for any losses or damages resulting from such investment decisions.
免责声明:本文章仅代表作者个人观点,不代表本平台的立场和观点。本文章仅供信息分享,不构成对任何人的任何投资建议。用户与作者之间的任何争议,与本平台无关。如网页中刊载的文章或图片涉及侵权,请提供相关的权利证明和身份证明发送邮件到support@aicoin.com,本平台相关工作人员将会进行核查。


