Let's take a look at today's market analysis. First, let's look at Bitcoin. Bitcoin has finally closed the monthly line, and from this monthly line, it has formed a large bullish candlestick with a long wick.
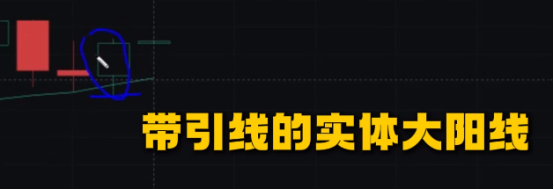
From the perspective of the monthly line, there is still potential for an upward movement this month. However, we can see from the monthly level that the upper area is a breakout point and has reached a key resistance level, so there is still considerable resistance above. At that time, while pushing upward, we need to be aware of the risk of a short-term pullback, which is viewed from the monthly line level.
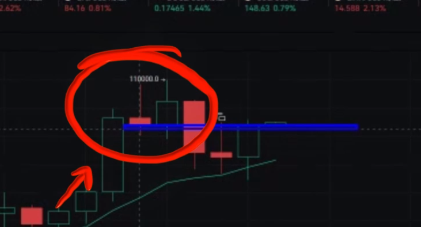
This risk mainly comes from the strong resistance zone around the 98,000-100,000 integer level. Since the monthly line has formed a bullish engulfing candlestick, we need to pay attention to a couple of key points below: one is the 84,000 level, and the other is the previously mentioned 88,000-90,000 range. These two key points, 84,000 and 86,000, are where the price broke out sideways and then made a quick surge. The 88,000-90,000 point is where the last surge confirmed a pullback, and this time there was no confirmation of a pullback. These two points are what we need to focus on. This is the Bitcoin analysis from the monthly line level. From the daily line perspective, Bitcoin is still consolidating at this high level, meaning there is still no significant direction in this area.
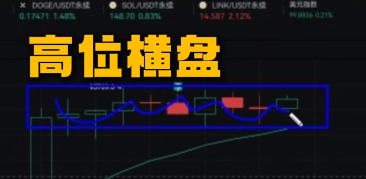
Last night, due to data reasons, there was a slight dip, but it recovered again later in the night. In short, we have been making high sell and low buy trades in this area for the past few days. In general, in a sideways market without a breakout, we can just focus on high sell and low buy.
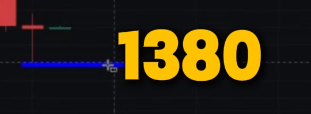
Now let's look at Ethereum from the monthly line level, which has formed a hammer candlestick with a lower shadow.
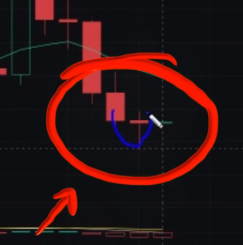
This indicates that the 1,380 level is a good support in the short term. From the monthly line perspective, Ethereum has experienced a decline for five consecutive months, and this is the sixth month. Currently, there is a slight rebound after the decline.
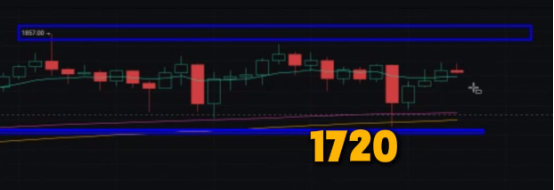
From an overall perspective, although there was a dip to 1,380, the overall closing price is still above 1,800 and 1,760. This is what we need to focus on, so from the monthly line perspective, there is still potential for an upward trend. There are a few strong support points below: the first point is the 1,580-1,600 range, and the second is the bottom at 1,380.
As long as it does not break below this point, from the monthly line perspective, there may be a process of a second pullback confirmation, and it will basically move upward. From the daily line perspective, Ethereum is still in a high-level consolidation situation, and there is not much change in the daily line. What we need to do is just high sell and low buy.
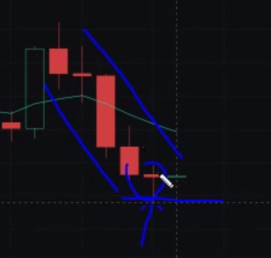
In the 4-hour level, due to data reasons, there was a quick drop, but it still did not break below the 1,720 point we mentioned. We can still focus on trading long positions around the short-term 1,720 point, and for short positions, we can target the 1,560 point.
Ethereum has not changed much, and May will still focus on low long positions. If you feel confused about trading, you can follow our public account: KK Strategy.
免责声明:本文章仅代表作者个人观点,不代表本平台的立场和观点。本文章仅供信息分享,不构成对任何人的任何投资建议。用户与作者之间的任何争议,与本平台无关。如网页中刊载的文章或图片涉及侵权,请提供相关的权利证明和身份证明发送邮件到support@aicoin.com,本平台相关工作人员将会进行核查。


