**Major Institutions Entering the Market: *BTC* ETF Net Inflows of $4 Billion for Eight Consecutive Days, Approaching the Outflow Amount of the Previous Four Months!**
Macroeconomic Interpretation: The current cryptocurrency market is experiencing a complex situation intertwined with multiple forces, including retail investors and major institutions. On one hand, traditional financial institutions are accelerating their layout of Bitcoin ETFs, driving capital migration towards crypto assets; on the other hand, global monetary policy adjustments and regulatory dynamics continue to influence market expectations. We will reveal the core driving forces behind Bitcoin's price and its potential market impact by integrating the latest industry trends and on-chain data analysis.
Institutional capital is entering the market at an accelerated pace, with Bitcoin ETFs becoming a value anchor. The ETF fund flow data disclosed by BlackRock confirms the transformative change of Bitcoin as an institutional-grade asset. Data shows that the initial funding for Bitcoin ETFs mainly came from retail investors, but starting in the second quarter of 2024, top financial institutions including Merrill Lynch, Morgan Stanley, Wells Fargo, and UBS began systematic allocations, with a total managed asset scale exceeding $10 trillion. Notably, the entry of traditional conservative institutional investors such as the Texas Teacher Retirement System and Emory University marks that Bitcoin has broken through the cognitive boundary of being a "high-risk speculative product" and is gradually entering the mainstream asset allocation framework.
This trend resonates with on-chain data—Bitcoin's realized market capitalization broke through the historical peak of $882.2 billion in late April. This metric is derived by calculating the price-weighted last on-chain transfer price of each Bitcoin, reflecting the "real cost" actually put into the market. When the realized market capitalization crosses a critical threshold, it often triggers a market reassessment of price support levels. Current data indicates that even though Bitcoin's price has not yet surpassed previous highs, the average cost for holders has built a solid foundation, which is highly similar to the characteristics seen at the beginning of the bull markets in 2017 and 2021.
The market is also facing regulatory games and liquidity restructuring: the U.S. SEC's approval strategy for crypto ETFs shows significant differentiation. Bloomberg data indicates that the approval rate for mainstream crypto asset-related products continues to rise, with the approval probability for crypto index ETFs reaching 90%, while competing coin ETFs such as Solana and XRP face stricter scrutiny. This regulatory layering has objectively accelerated the capital accumulation towards Bitcoin. As of the end of April, Bitcoin ETFs saw net inflows of $4 billion, although lower than the same period last year, the holding structure has undergone a qualitative change: the long-term holding proportion of asset management giants like BlackRock has increased to 67%, a rise of 21 percentage points compared to the same period last year.
It is noteworthy that the shift in the Bank of Japan's monetary policy has unexpectedly catalyzed the crypto market. The tariff policy introduced by the Trump administration in early April forced Japan to delay its interest rate hike plans, and the increasing pressure of yen depreciation has prompted local institutions to seek Bitcoin as a hedging tool. Historical data shows that whenever the yen to dollar exchange rate falls below 150, the trading volume on Japanese cryptocurrency exchanges typically surges by an average of 38%. This cross-border capital flow is reshaping the crypto market landscape in the Asia-Pacific region.
The price breaking through critical points and the market leverage reset are also worth our attention, as the technical and derivatives markets are sending strong signals. Coinank's liquidation heatmap shows that if Bitcoin's price breaks through $96,000, it will trigger the liquidation of $1.168 billion in short positions, marking the largest potential short squeeze threshold since 2021. The on-chain position distribution indicates that $97,530 has become a key battleground for bulls and bears, corresponding to the cost line of 462,000 Bitcoins accumulated near the historical high in November 2021. A breakthrough may lead the market into a resistance-free zone.
The new high in realized market capitalization and the divergence from futures funding rates reveal the current market's uniqueness. Although Bitcoin's price has not yet surpassed previous highs, the continuous rise in realized market capitalization indicates that new funds are digesting early profit-taking, a "slow bull" accumulation that differs from the past leverage-driven surges. Options data shows that the maximum pain point for Bitcoin options expiring in May is concentrated in the $92,000 to $95,000 range. If the price stabilizes above this area, it could trigger a revaluation of options contracts worth up to $3.4 billion.
The trust crisis in the traditional financial system has given rise to alternatives. Eric Trump, Vice President of the Trump Organization, sharply criticized the traditional financial system at the Dubai Crypto Summit, reflecting the systemic challenges faced by it. His criticism of the inefficiency of the SWIFT system and unequal banking services resonates with BlackRock's research report—average global cross-border remittance costs in Q1 2024 still stand at 6.2%, while blockchain solutions can compress this figure to below 1%. This efficiency gap is driving more institutions to explore crypto infrastructure. A recent survey by Fidelity Investments shows that 83% of institutional investors list "reducing trading friction" as the primary motivation for allocating to cryptocurrencies.
The market evolution path is becoming clearer. Bitcoin, with its censorship resistance and fixed supply mechanism, has become a strategic reserve for institutions to cope with monetary overissuance; Ethereum and Layer 2 ecosystems are accommodating the demand for smart contract innovation; while high-performance chains like Solana focus on vertical scenarios such as payment settlements. This value stratification strengthens the fundamental support for Bitcoin's "digital gold" narrative. Grayscale's research report estimates that if the U.S. M2 money supply maintains a 4.3% annual growth rate, Bitcoin's market capitalization ratio is expected to exceed 50% by 2025.
The investment logic under structural changes also needs to be transformed. The essential difference between the current market and previous cycles lies in the qualitative change in the participant structure. When long-term capital holders such as hedge funds, university endowment funds, and sovereign wealth funds account for more than 35%, Bitcoin's price volatility shows a convergence trend. The average 30-day volatility of Bitcoin in 2024 is 42%, a decrease of 19 percentage points compared to the 2021 bull market, and this stability, in turn, attracts more conservative capital to enter.
For the subsequent market trends, two major catalysts need to be closely monitored: first, the timing of the Federal Reserve's policy shift and the overlapping effect of Bitcoin ETF options products. The Chicago Mercantile Exchange plans to launch Bitcoin ETF options, which could bring an additional $15 billion in liquidity; second, the dynamic relationship between miners' holding costs and spot prices after Bitcoin's halving. When prices maintain above 2.5 times the cost line, historically, this is usually accompanied by a relaxation of hash rate competition and miners' reluctance to sell. If the above conditions resonate, Bitcoin is expected to test new highs in the future, opening a new era for crypto assets as macro hedging tools. However, without significant positive developments, a deep correction may also be on the horizon.
BTC Data Analysis:
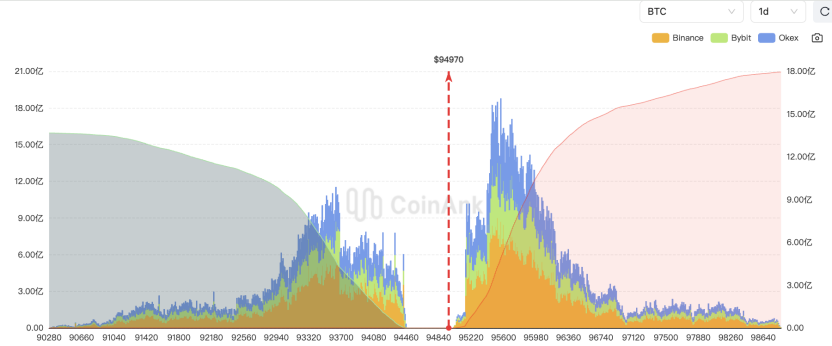
Coinank data shows that Bitcoin's price is currently facing a key liquidity threshold zone of $94,000 to $96,000. The on-chain liquidation heatmap indicates that breaking through $96,000 will trigger a liquidation impact of approximately $1.17 billion in short positions, while falling below $94,000 will lead to a wave of strong liquidations of $450 million in long positions. This data essentially reflects the distribution of market fragility—short liquidation intensity is 2.6 times that of longs, exposing the asymmetric risk exposure of current leveraged funds at resistance levels. The derivatives structure shows that the main liquidation pressure is concentrated on Binance (58%) and OKX (23%), with the short position cost center concentrated in the $95,500 to $96,500 range.
Such liquidation-intensive areas often create a price magnet effect: if a key level is broken, the buying pressure from short covering will self-reinforce the price trend, forming a "liquidation-driven bull market"; conversely, it may trigger a long squeeze. Currently, Bitcoin's volatility surface shows extreme distortion, with call option premiums above $96,000 surging by 47%, indicating that market makers have anticipated a breakout probability. For the crypto ecosystem, this high elasticity structure may accelerate market style switching—if a successful breakout occurs, small and mid-cap tokens may welcome a catch-up window; if it is blocked and falls back, institutions may turn to volatility arbitrage strategies, driving a surge in demand for Bitcoin ETF inverse shorting tools. Historical data shows that when similar liquidation intensity thresholds are triggered, the volatility center typically rises by an average of 62% within 72 hours, suggesting attention to cross-exchange arbitrage opportunities and stablecoin market cap fluctuations.
免责声明:本文章仅代表作者个人观点,不代表本平台的立场和观点。本文章仅供信息分享,不构成对任何人的任何投资建议。用户与作者之间的任何争议,与本平台无关。如网页中刊载的文章或图片涉及侵权,请提供相关的权利证明和身份证明发送邮件到support@aicoin.com,本平台相关工作人员将会进行核查。


