In the Wyckoff price-volume analysis method, the relationship between price movement and trading volume is key to determining market trends and the intentions of major players. Simply put, it tells us: how the price moves is not important; the key is whether the volume keeps up! Among them, a combination of three consecutive increasing volume candlesticks often indicates the continuation of market trends or possible reversals. Today, we will systematically interpret this phenomenon in the simplest way!
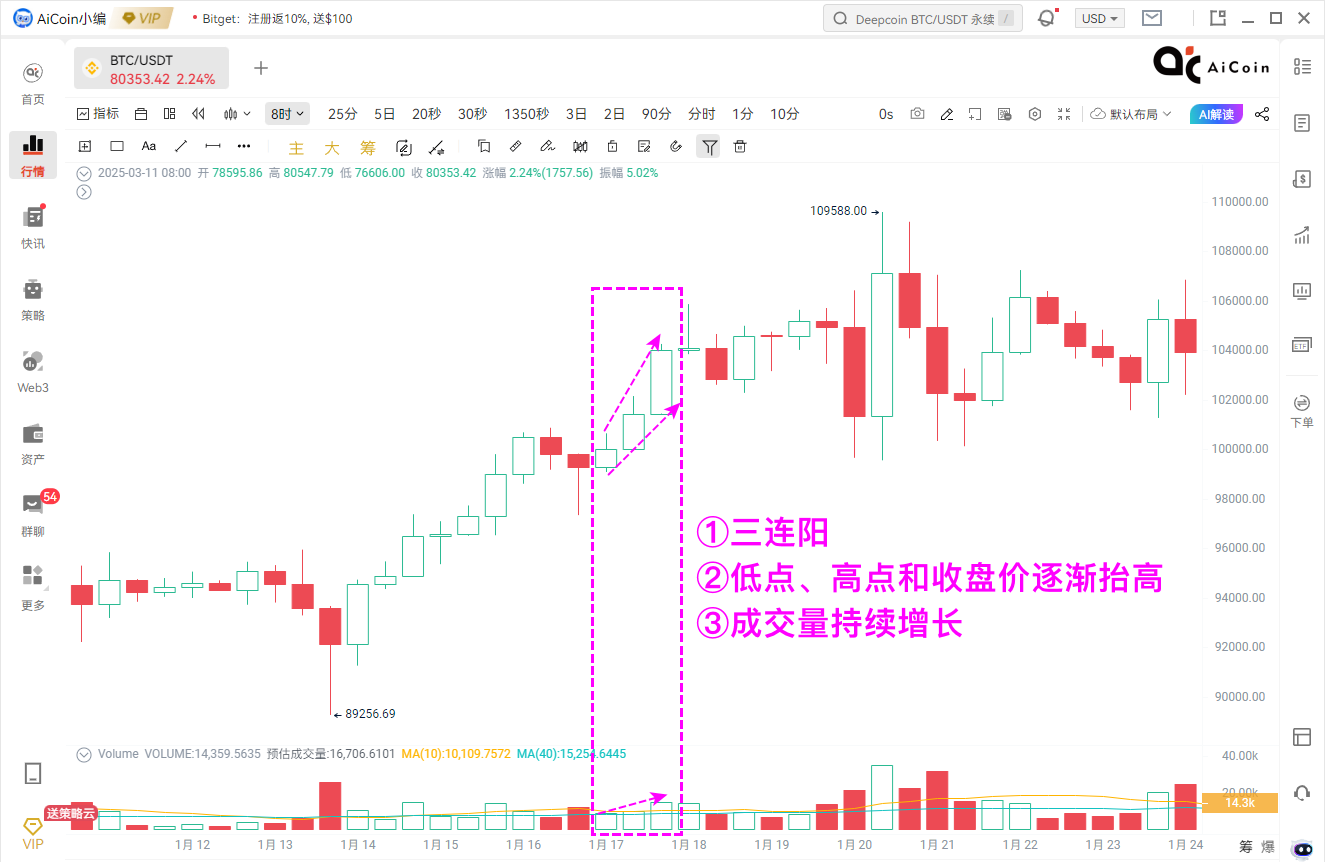
1. Demand Expansion Type Three Consecutive Up Candles
When the market shows three consecutive lower lows, higher highs, and closing prices progressively rising in a candlestick combination, and the trading volume exhibits a stair-step increase, it signifies a fundamental shift in the market supply-demand structure.

Typically, this type of pattern releases the following three signals:
1. Major Funds Actively Entering the Market
Continuously increasing volume in up candlesticks indicates a significant influx of buying pressure, pushing prices higher. The accelerated entry of funds suggests a high level of market confidence in the current trend.
2. Trend Continuation Signal
If this phenomenon occurs in an upward trend, it indicates that the market is in a strong phase, and the trend may continue to rise. In this case, investors can follow the trend and consider entering.
3. Possible Overbought Risk
If prices rise rapidly in a short period, a temporary overbought state may occur, necessitating caution against profit-taking or major players' washout actions. At this time, it is essential to observe the subsequent candlestick patterns; if there is a volume increase with stagnation or high-volume down candlesticks, it may signal an impending adjustment.
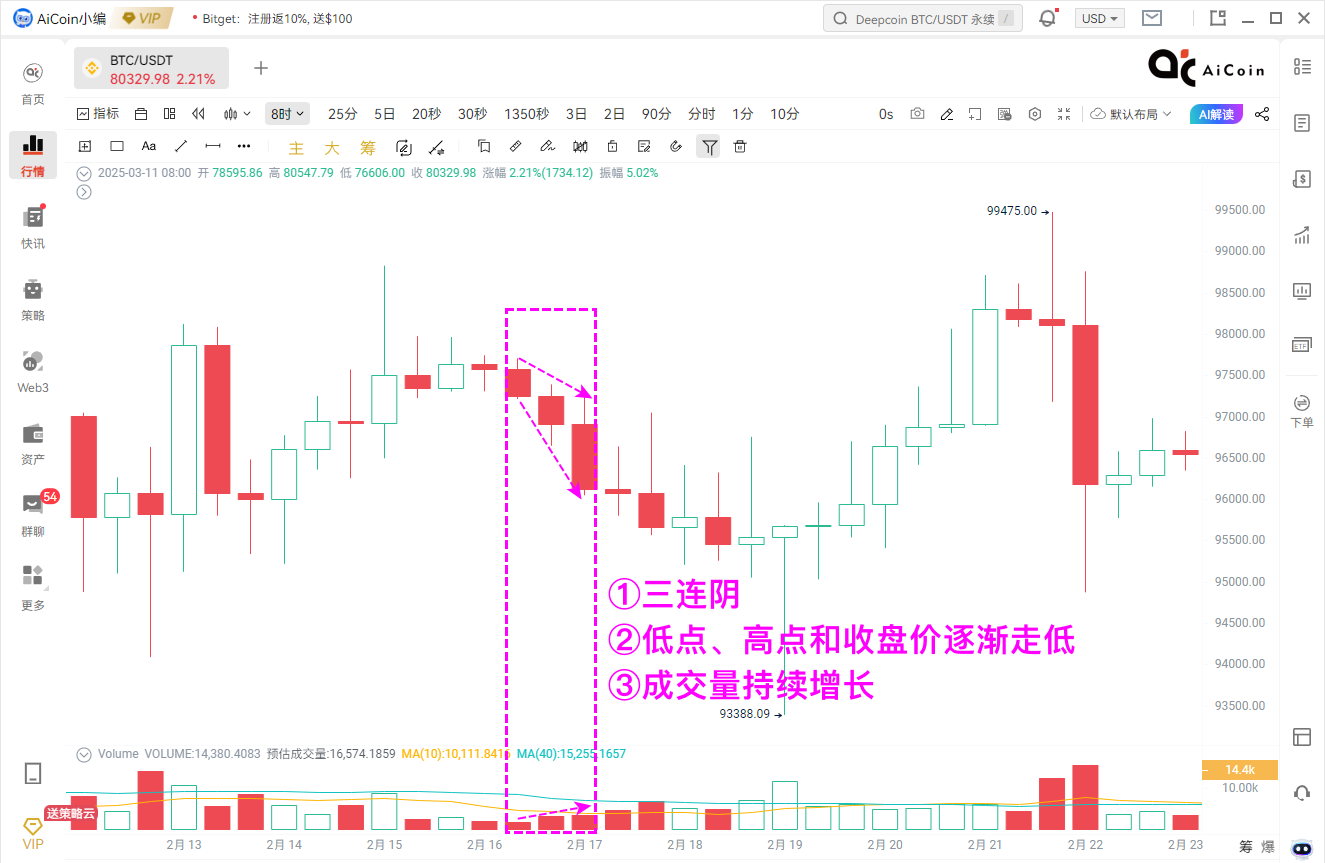
2. Supply Control Loss Type Three Consecutive Down Candles
In contrast to the demand-driven pattern, a combination of three consecutive higher highs, lower lows, and closing prices moving down along with continuously increasing trading volume often indicates an impending liquidity crisis in the market.

This "price and volume both falling" pattern usually signifies:
- Panic Selling or Major Player Distribution
Continuously increasing volume in down candlesticks reflects significant selling pressure in the market, which may enter a state of panic. If this phenomenon occurs at high levels, it could be a signal of major players distributing their holdings, requiring special caution.
2. Trend Reversal or Continued Decline
If it appears in the high area after an upward trend, it may indicate a trend reversal, with the market entering a phase of divergence. If this phenomenon occurs in a downward trend, it indicates that the market is weak, with bearish forces dominating, and prices may continue to decline.
3. Possible Rebound After Short-Term Emotional Release
In some cases, if continuous increasing volume in down candlesticks leads to short-term overselling in the market, a technical rebound may occur. However, if the rebound lacks strength, it may only be a weak rebound, and caution should still be exercised regarding the continuation of the downward trend.
3. How to Combine Wyckoff Theory for Judgment?
The Wyckoff theory emphasizes four stages of market accumulation, markup, distribution, and markdown. Combining the above phenomena allows for the following analysis:
1. In the Accumulation Phase (Buying Period)
- If there are consecutive increasing volume up candlesticks, it indicates that major players may have completed their accumulation, and the market may enter an upward phase.
2. In the Markup Phase (Rally Period)
- If there are consecutive increasing volume up candlesticks, it indicates that major players are still pushing prices higher, and the trend is strong, allowing for continued holding or adding positions.
- If there are consecutive increasing volume down candlesticks, caution is needed as the trend may enter a consolidation or reversal phase.
3. In the Distribution Phase (Selling Period)
- If there are consecutive increasing volume up candlesticks, it is necessary to observe whether there is a pullback after a rise, as this may indicate that major players are making their final distribution using market sentiment.
- If there are consecutive increasing volume down candlesticks, it may indicate a downward phase after major players have distributed their holdings, requiring timely risk avoidance.
4. In the Markdown Phase (Decline Period)
- If there are consecutive increasing volume down candlesticks, it indicates that bearish forces dominate, and prices may accelerate downward.
- If trading volume gradually decreases after down candlesticks, it may indicate that panic selling is nearing its end, and attention should be paid to any signs of a bottom.
Mnemonic: Don’t rush with one up candlestick; three up with volume shows momentum rise; don’t panic with one big down candlestick; three down breaking the line means quick liquidation; three up in a bull market is the starting point; three down in a bear market shows no bottom!
4. Custom Indicators — Smart Tracking of Increasing Volume Three Up & Three Down Candles
While monitoring candlesticks and trading volume on the chart can give a general trend, the market changes rapidly, and relying solely on the naked eye can easily miss key signals. At this time, you can utilize custom indicators to make trading smarter!
💡 The Four Major Advantages of AiCoin Custom Indicators:
- Real-Time Signals: Clear entry and exit points to avoid chasing highs and cutting losses;
- Alert Reminders: Automatic notifications when key price levels are triggered, ensuring no market opportunities are missed;
- Professional Backtesting: Practice with zero cost, strategies validated before real trading;
- Live Trading: Automated execution of buy and sell orders, reducing emotional interference and eliminating the need to monitor the market constantly.
1. Create the “Increasing Volume Three Up” Indicator:
Condition 1: Three consecutive up candlesticks (closing price > opening price), with each candlestick's low, high, and closing prices greater than the previous one;
Condition 2: Trading volume gradually increases, with each candlestick's volume greater than the previous one.
2. Create the “Increasing Volume Three Down” Indicator:
Condition 1: Three consecutive down candlesticks (closing price < opening price), with each candlestick's low, high, and closing prices less than the previous one;
Condition 2: Trading volume gradually increases, with each candlestick's volume greater than the previous one.

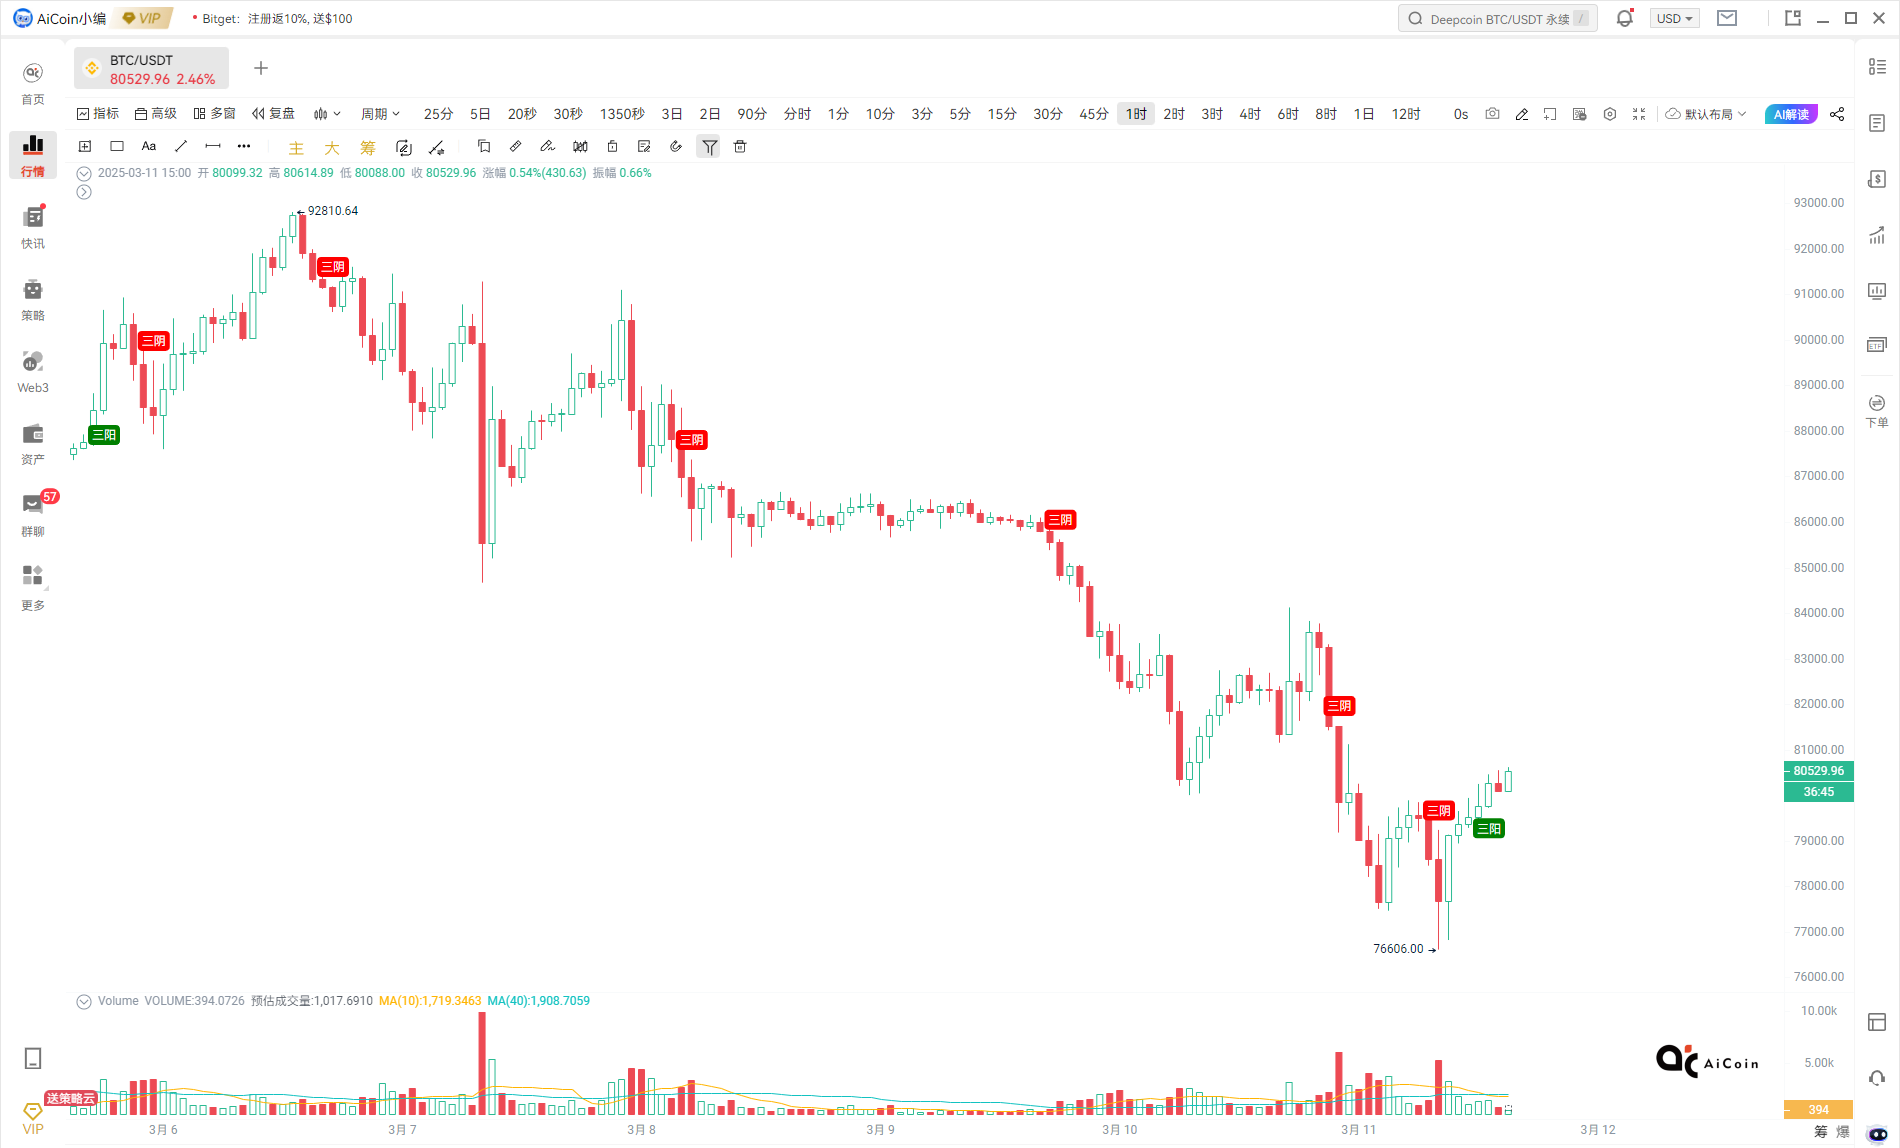
Usage: When the three up signal is triggered, the system can alert you that the trend is strengthening; when the three down signal is triggered, the system can alert you that the market is experiencing increasing volume selling pressure.
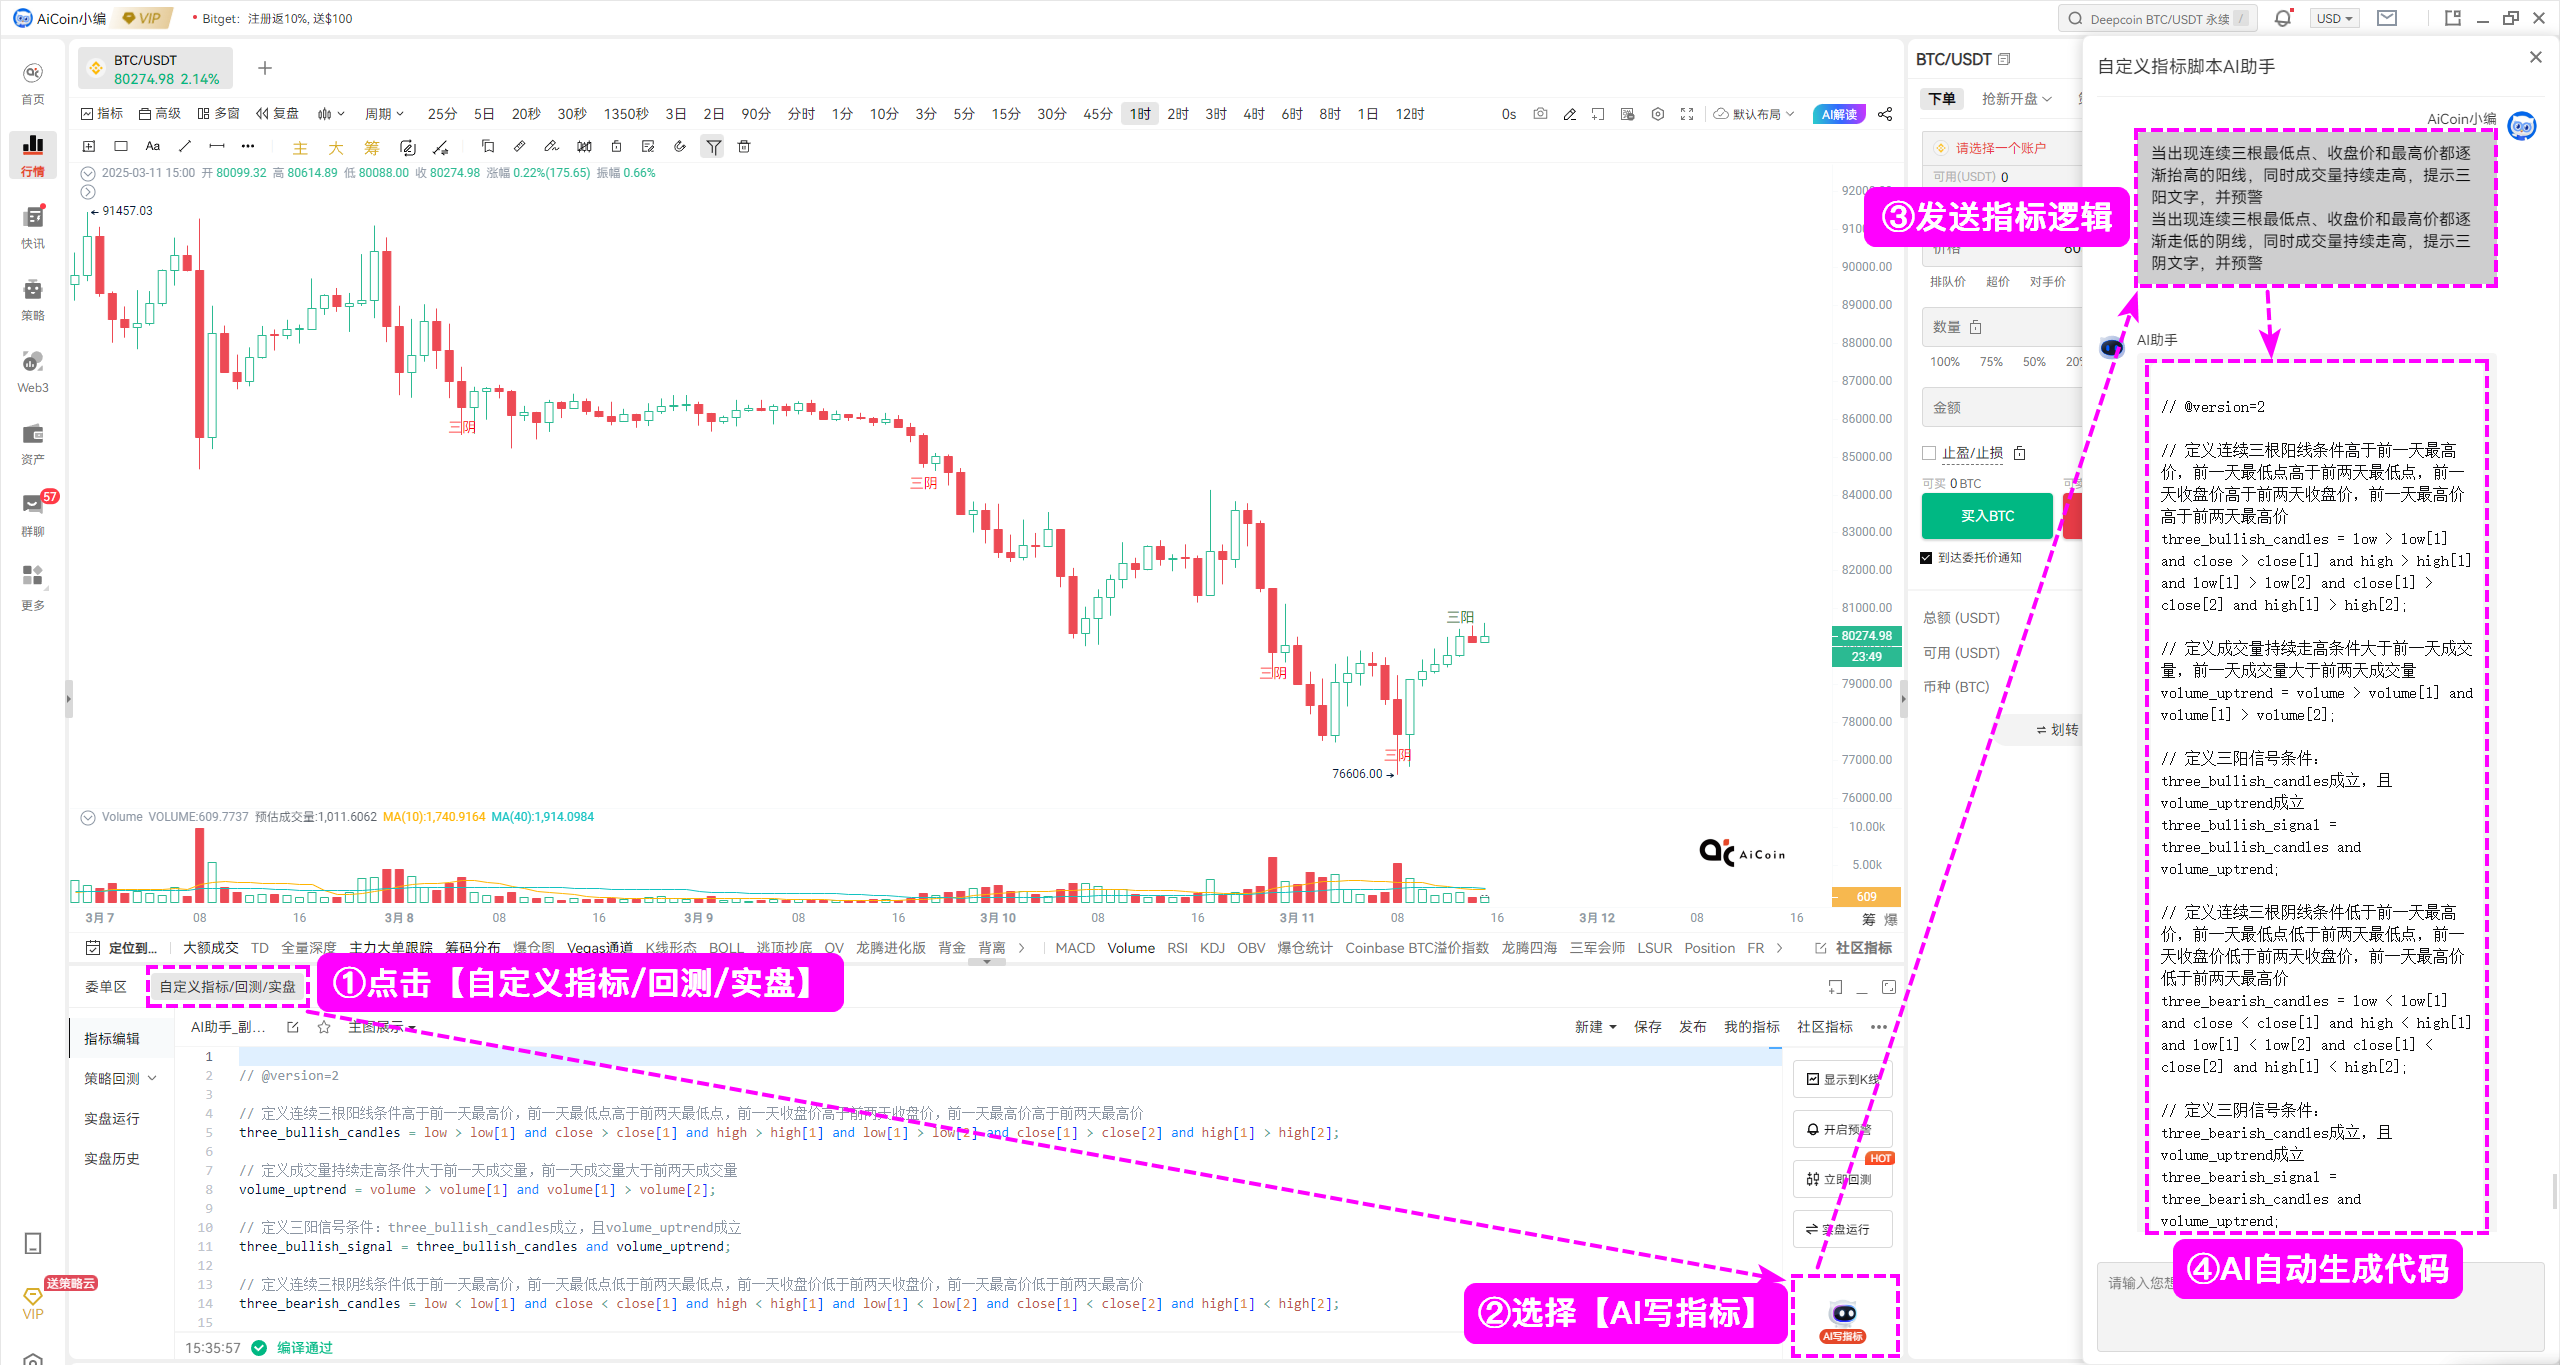
Quickly obtain the same indicators: AI Write Indicator
Path: PC K-line bottom → Custom Indicators → AI Write Indicator → Send Indicator Logic
Experience AI Write Indicator now: https://www.aicoin.com/vip/chartpro

5. Conclusion
Three consecutive increasing volume candlesticks are typical critical signals for bulls and bears. The next time you see continuous increasing volume in an up or down trend, you’ll know whether to grab a seat and watch the show or to get ready to take action!
The above content is for sharing purposes only and is for reference only, not constituting any investment advice. If you have any questions, feel free to join the 【PRO CLUB】 group to discuss with the editor~
Please recognize AiCoin's official website: www.aicoin.com
免责声明:本文章仅代表作者个人观点,不代表本平台的立场和观点。本文章仅供信息分享,不构成对任何人的任何投资建议。用户与作者之间的任何争议,与本平台无关。如网页中刊载的文章或图片涉及侵权,请提供相关的权利证明和身份证明发送邮件到support@aicoin.com,本平台相关工作人员将会进行核查。


