Master Discusses Hot Topics:
This morning, Bitcoin briefly dipped to a low of 79,300, breaking below 80k seemed like a false alarm. It bounced back above 80k, but the resistance level is right there, with the maximum pressure shifting down to 82.3 to 83k. Currently, Master sees that if it drops again, it will be a real break, and the space from 79k to 75k will open up first.
The one-sided decline is so obvious, yet Master sees some people still shouting that the bull market is ongoing, which is quite frustrating. Who doesn't hope for a bull market? Spot traders are looking to break even and make some profit, while short-term bulls are preparing to go back to the factory to tighten screws.
Short positions at high levels are making small profits, with major support levels taking some profits. Maintaining cost advantages allows one to capture a profit of 10,000 to 20,000 points from the decline. Speaking of which, the several million dollars defending around 80k is just a drop in the bucket; pulling back to 85k would require 500 million dollars.
Meanwhile, 70k is the lower Bollinger Band on the weekly chart and a strong support level, with a short-term bottom here. The upper levels of 76k and 73k will see short pauses, providing short-term long opportunities, but don’t shout about bottom fishing; it’s just a short-term bottom, not the end of the year.
Additionally, Master personally believes that Bitcoin will oscillate in the range of 70k to 85k in the future, and if expectations for interest rate cuts cool down, there will be another wave of main declines. For those with short positions in Bitcoin at costs above 85.7k, they can try to hold until around 73.3k; for Ethereum with costs above 2500, they can try to hold until around 1666, and if there’s a rebound in between, they can directly add to their positions.
Currently, the bearish trend is like driving downhill, with support points acting as a buffer zone; if they can’t hold, it can only slow down. The direction will only be clear at the short-term bottom; the bears haven’t really gained strength yet. When institutions start massive sell-offs, that will be the main decline, and we’ll see the outcome by March next year at the latest.
This year has seen alternating bull and bear markets; it’s crucial to run when the price is high to protect capital. Before the bear market, avoid those marketing coins that seem lively but can bury you at any moment. Bear market bubbles can drop by 90-99%, and many small exchange junk coins go to zero. Remember, bottom fishing is just for short-term longs; the overall trend is downward, like a treadmill—if you run slowly, you’ll fall.
For spot traders, it’s essential to be prepared for both scenarios: 1. If the market doesn’t rise this year, it will oscillate between 90k and 60k. If it drops to 20k in a deep bear market by 2026, can you hold on? 2. Do you have the capital to guard against the bear market and stock up for the next bull market?
There’s also considerable disagreement about whether the bull market has ended or not. Those who say it hasn’t ended will surely mention that the previous three halving bull markets lasted 16-17 months, and a pullback is normal. The Federal Reserve may cut rates by 25 basis points in June, and the market is reacting in advance after May; the weekly MACD is still far from zero.
On the other hand, those who say it has ended will likely believe that the current pullback is due to the halt in rate cuts and the impact of new policies, with no significant positive news. The market is undergoing a large-scale adjustment, with no signs of stopping the decline. A rebound after the June rate cut will be limited, and the probability of new highs in the second half of the year is low; if it declines from March to November, it will be considered over. What does everyone think?
Master Looks at Trends:
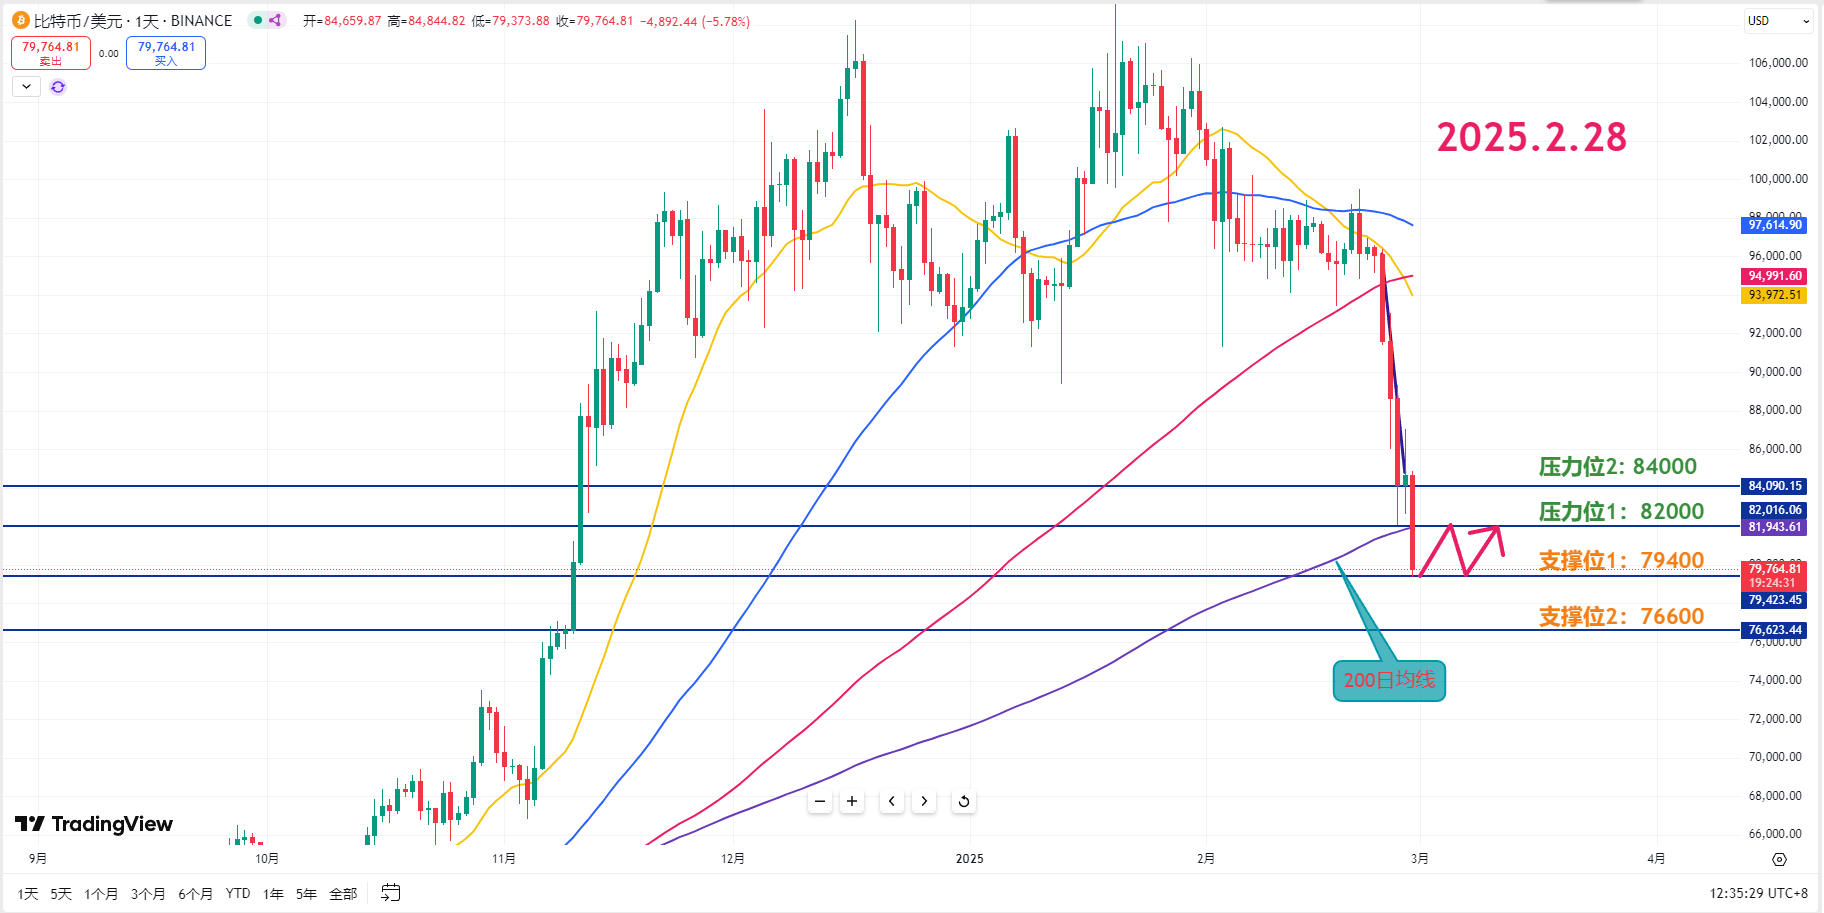
Resistance Levels Reference:
First Resistance Level: 84000
Second Resistance Level: 82000
Support Levels Reference:
First Support Level: 79400
Second Support Level: 76600
Today's Suggestions:
There’s no need to panic about the market decline; stay calm and observe the situation. For short-term traders, there will also be many opportunities. First, the first resistance level coincides with the 200-day moving average; if a long lower shadow appears and stabilizes at the 200-day moving average, a rebound can be expected in the short term.
Currently, attention should be paid to the strength of the rebound; if the rebound is weak after a decline and then falls again, caution is needed for further downside. A strong bullish candle is needed to raise the low points and increase the probability of breaking through resistance.
At the lowest point reached, the first support serves as a short-term low for ultra-short-term trading. If it breaks again, it will continue to open up downward space.
2.28 Master’s Wave Strategy:
Long Entry Reference: Not currently referenced
Short Entry Reference: 84000-84800-85400 in batches, Target: 82000-79400
This article is exclusively planned and published by Master Chen (public account: Coin God Master Chen), with the same name across the internet. For more real-time investment strategies, solutions, spot trading, short, medium, and long-term contract trading techniques, operational skills, and knowledge about candlesticks, you can join Master Chen for learning and communication. A free experience group for fans has been opened, along with community live broadcasts and other quality experience projects!

Warm Reminder: This article is only written by Master Chen on the official account (as shown above); other advertisements at the end of the article and in the comments section are unrelated to the author!! Please be cautious in distinguishing authenticity, and thank you for reading.
免责声明:本文章仅代表作者个人观点,不代表本平台的立场和观点。本文章仅供信息分享,不构成对任何人的任何投资建议。用户与作者之间的任何争议,与本平台无关。如网页中刊载的文章或图片涉及侵权,请提供相关的权利证明和身份证明发送邮件到support@aicoin.com,本平台相关工作人员将会进行核查。


