Table of Contents:
This week's large token unlock data;
Overview of the crypto market, a quick read on the weekly rise and fall of popular coins/fund flows in sectors;
Inflow and outflow situation of spot ETF funds;
The correlation between Bitcoin and the S&P 500 index has dropped to zero;
Key macro events and economic data forecasts for this week.
1. This week's large token unlock data;
Data unlock forecast: Tokens such as MURA, MELANIA, FTN, etc., will experience large unlocks this week, including:
Murasaki (MURA) will unlock approximately 20 million tokens at 8:00 AM on February 23, accounting for 2.00% of the current circulating supply, valued at approximately $85.4 million;
Melania Meme (MELANIA) will unlock approximately 61.25 million tokens at 8:00 AM on February 20, accounting for 40.83% of the current circulating supply, valued at approximately $81.5 million;
Fasttoken (FTN) will unlock approximately 20 million tokens at 8:00 AM on February 18, accounting for 4.66% of the current circulating supply, valued at approximately $78.6 million;
QuantixAI (QAI) will unlock approximately 565,700 tokens at 8:00 AM on February 18, accounting for 10.88% of the current circulating supply, valued at approximately $48.2 million;
Metars Genesis (MRS) will unlock approximately 10 million tokens at 8:00 AM on February 21, accounting for 11.87% of the current circulating supply, valued at approximately $29.2 million;
Immutable (IMX) will unlock approximately 24.52 million tokens at 8:00 AM on February 21, accounting for 1.41% of the current circulating supply, valued at approximately $20.1 million;
ApeCoin (APE) will unlock approximately 15.6 million tokens at 8:30 PM on February 17, accounting for 2.16% of the current circulating supply, valued at approximately $11.4 million;
Pixels (PIXEL) will unlock approximately 91.18 million tokens at 6:00 PM on February 19, accounting for 11.83% of the current circulating supply, valued at approximately $6.3 million;
SPACE ID (ID) will unlock approximately 18.49 million tokens at 8:00 AM on February 22, accounting for 4.29% of the current circulating supply, valued at approximately $5.9 million;
Echelon Prime (PRIME) will unlock approximately 750,000 tokens at 8:00 AM on February 17, accounting for 1.37% of the current circulating supply, valued at approximately $5 million.
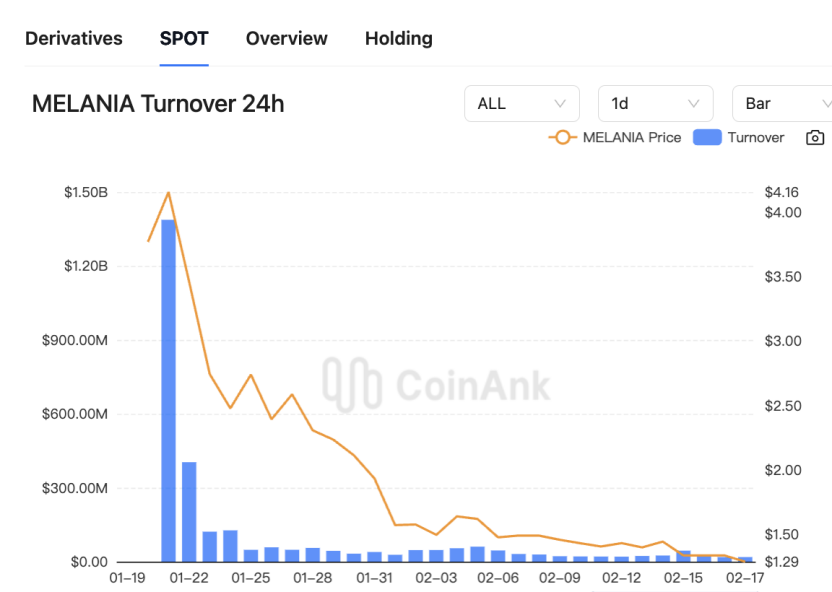
The above times are in UTC+8. This week, pay attention to the negative effects brought by the unlocking of these tokens, avoid spot trading, and seek shorting opportunities in contracts. The chart shows data from CoinAnk, where the unlocking circulation ratios and scales of MURA, MELANIA, FTN, and QAI are relatively large, warranting extra attention.

2. Overview of the crypto market, a quick read on the weekly rise and fall of popular coins/fund flows
According to CoinAnk data, in the past week, the crypto market's net fund inflows were concentrated in several major sectors, including the Avalanche ecosystem, Arbitrum ecosystem, Optimism ecosystem, Solana ecosystem, and fan token sector. In the past week, many tokens have also experienced rotational increases. The following are the top 500 by market capitalization: CROK, CAKE, COQ, XVS, BAKE, and USTC have seen relatively high increases and can continue to be prioritized for trading opportunities in strong tokens.

3. Inflow and outflow situation of spot ETF funds.
According to CoinAnk data, in the past week, the cumulative net outflow from U.S. Bitcoin spot ETFs was $580.2 million. The total on-chain holdings of U.S. spot Bitcoin ETFs have surpassed 1.2 million BTC, currently reaching about 1.205 million BTC, accounting for 6.08% of the current BTC supply, with the on-chain holding value reaching approximately $117.7 billion. Regarding ETFs, well-known analyst PlanB also disclosed that he has transferred Bitcoin into ETFs, making it more convenient to manage Bitcoin in the same way as stocks and bonds. Moreover, there is no need to worry about private keys, which is more reassuring. He is no longer just a simple Bitcoin believer.
In the past week, the cumulative net outflow from U.S. Ethereum spot ETFs was $26.3 million.
We believe that the recent fund flows in U.S. Bitcoin spot ETFs show significant short-term pressure and long-term allocation differentiation. Although the on-chain holdings have surpassed 1.2 million BTC (accounting for 6.08% of the circulating supply), the net outflow of $580 million in the past week reflects that some institutional investors may choose to take profits or adjust their positions at the current high price. This phenomenon may be related to market fluctuations in expectations regarding the Federal Reserve's monetary policy, with funds temporarily withdrawing from risk assets.
It is noteworthy that the public shift of well-known analyst PlanB towards Bitcoin ETFs highlights the reconstruction of traditional financial tools' appeal to crypto-native believers. His choice to manage Bitcoin in a stock and bond model essentially reflects the accelerated institutionalization process—investors are more inclined towards liquidity (such as the risk of private key management) over security, which may lead to further concentration of Bitcoin ownership in compliant products.
In contrast, the net outflow of $26.3 million from Ethereum spot ETFs during the same period may be related to market concerns about the regulatory uncertainty of its staking mechanism. Although the technological upgrades of the Ethereum ecosystem continue to advance, the differentiation in fund flows indicates that investors have different risk pricing for BTC and ETH, with the former being viewed more as a "digital gold" type of asset, while the latter is still influenced by the progress of ecological applications. The current market may be in a structural adjustment phase in the mid-cycle of a bull market, with the trend of funds migrating from high-beta assets to core assets likely to continue.
4. The correlation between Bitcoin and the S&P 500 index has dropped to zero.
According to CoinAnk data, the correlation between Bitcoin and the S&P 500 index has dropped to zero, indicating that there is currently no connection between the two. The last time we saw such a low correlation was on November 5, 2024, just before Bitcoin soared to the $100,000 mark.
We believe that the recent phenomenon of the correlation between Bitcoin and the S&P 500 index dropping to zero has drawn deep attention from market researchers. This phenomenon indicates that the linkage logic between the cryptocurrency market and traditional financial markets is undergoing a structural change. From the driving factors, Bitcoin's current trend is more dominated by policy expectations and endogenous variables within the crypto ecosystem: expectations of regulatory easing promoted by the Trump administration, the acceleration of the compliance process brought about by the change in SEC chairmanship, and the continuous inflow of funds into institutional tools such as Bitcoin ETFs, all constitute the foundation of its independent market performance. Meanwhile, the S&P 500 index remains constrained by traditional macro factors such as U.S. real economy data and corporate earnings expectations.
Historical data is enlightening: after the low correlation point in November 2024, Bitcoin broke through $100,000, reflecting that crypto assets often release greater price elasticity when detached from traditional market constraints. The current pattern may indicate that Bitcoin is evolving from a "risk asset" to an "independent asset class," with its value storage attributes and policy sensitivity reshaping market pricing logic. If this trend continues, Bitcoin may initiate a differentiated new cycle compared to traditional financial assets.
5. Key macro events and economic data forecasts for this week.
Short-term market sentiment volatility outlook: In the coming week, several key central bank officials will speak intensively, which may trigger significant short-term market volatility. On Monday, ECB Governing Council member Nagel, Fed Governor Bowman, and Harker will speak; on Tuesday, Bank of England Governor Bailey and Fed's Daly will also express their views; on Thursday, Fed's Goolsbee and others will join in. The statements of these officials involve core topics such as monetary policy direction and economic outlook judgments. If they release signals that differ from market expectations, such as changes in the Fed officials' attitudes towards interest rate hikes or cuts, the foreign exchange market, bond market, and stock market will react.
Additionally, U.S. stocks will be closed on Monday due to Presidents' Day, and some contracts under CME will end trading early, which will reduce market liquidity and make prices more susceptible to sudden news or small trades, increasing market uncertainty. The Reserve Bank of Australia will announce its interest rate decision and hold a press conference on Tuesday, and its interest rate adjustments and future policy guidance will significantly impact the Australian dollar exchange rate and the Australian stock market. Tightening policies may drive the Australian dollar to appreciate and put pressure on the stock market, while easing policies will have the opposite effect.
Economic trend insights and long-term market direction: Data released later this week will more comprehensively reflect the economic conditions of several major economies. On Thursday, the U.S. API crude oil inventory data for the week will affect international oil price trends, with inventory increases or decreases reflecting changes in crude oil supply and demand, also reflecting the vitality of the U.S. economy and energy demand. If inventories increase significantly, oil prices may come under pressure, subsequently affecting energy companies' stock prices and related industry chains.
The numerous economic data released on Friday will be a key window for insights into the current state and future trends of the global economy. Japan's January CPI data will show domestic inflation levels, influencing the Bank of Japan's monetary policy path. The UK's February GfK consumer confidence index and January adjusted retail sales data reflect the vitality of the UK consumer market, while the preliminary values of February's manufacturing and services PMIs can reflect the growth momentum and structural changes in the UK economy. The preliminary values of February's manufacturing and services PMIs in the Eurozone and the U.S. also reflect the economic prosperity levels of these two major economies. The final value of the University of Michigan's consumer confidence index for February and the final value of the one-year inflation rate expectation are crucial for the Fed's monetary policy adjustments. If inflation expectations rise, the Fed may maintain a tightening policy to control inflation, which will subsequently affect global financial market asset pricing and fund flows.
免责声明:本文章仅代表作者个人观点,不代表本平台的立场和观点。本文章仅供信息分享,不构成对任何人的任何投资建议。用户与作者之间的任何争议,与本平台无关。如网页中刊载的文章或图片涉及侵权,请提供相关的权利证明和身份证明发送邮件到support@aicoin.com,本平台相关工作人员将会进行核查。