Today's homework needs to be discussed. I saw many friends saying that the decline was caused by the JOLTs job openings data released at 11 PM Beijing time, and of course, there was also the ISM Non-Manufacturing PMI data. The main reason is that both of these data points were too good; job openings indicate that the unemployment rate may decrease, leading to more job opportunities, and a PMI exceeding expectations also signifies economic growth. The rise in both data points suggests that the Federal Reserve is unlikely to change its pace of interest rate cuts, meaning two times or even less.
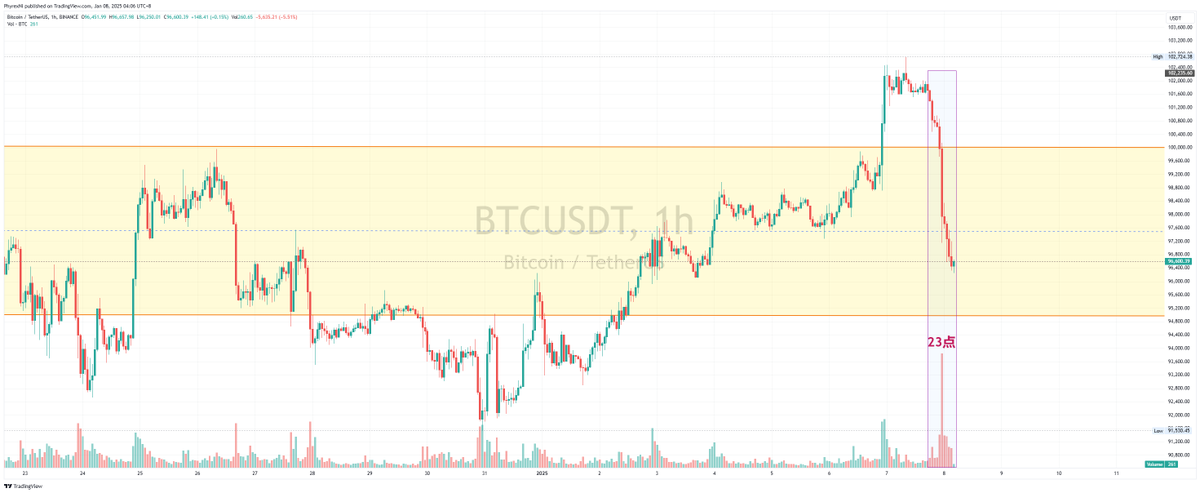
So, some friends believe that this is the reason for the decline. Indeed, from the candlestick chart, the drop at 11 PM had the largest trading volume, while before 11 PM, there might have been a missed opportunity for risk aversion? I'm not very certain. From the hourly chart, the decline started at 5 PM. Before that, my personal view was that the JOLTs job openings data would not have a significant impact, but it seems I might have been wrong.
The reason I had this thought is that JOLTs job openings do not equate to the unemployment rate and non-farm payroll data. Although there is a correlation, it is not a 100% association, including the small non-farm data as well. Of course, it is indeed possible that I was wrong, and I need to be more cautious in the future. I have always believed that the more important game will be in the non-farm data, not in JOLTs. However, the market gave the most direct reaction, and the performance of the US stock market does not look good.
Next, on Wednesday night at 9:15 PM, there will be the small non-farm data. The US stock market will be closed on Thursday, but there will be the Challenger job cuts data. Then on Friday, we will have the non-farm data. Following this trend, if today's decline was indeed caused by JOLTs, then the employment data in the next two days may have an impact on the market. The final game will still be on Friday's non-farm data.
There is no point in analyzing the non-farm data too much now; let's talk about it again on Thursday or Friday. For now, let's see if the sentiment will turn around in the next two days. After all, the current decline has returned to the levels seen after Christmas. Currently, the panic selling may be more pronounced, and the sentiment may readjust.
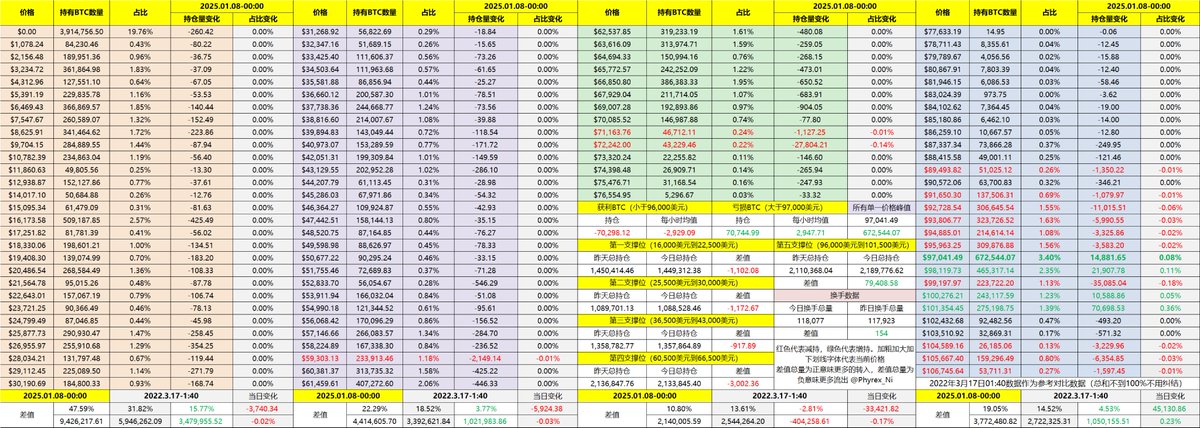
Looking back at the #BTC data, there are indeed some signs of panic. Both short-term profit-taking and loss-making investors show clear signs of exiting. It seems that the sudden drop broke many investors' belief that it was the beginning of a significant rise. The extent of the decline has indeed exceeded my expectations, which is why I believe the panic sentiment may undergo adjustment. For now, let's see how far it can drop.
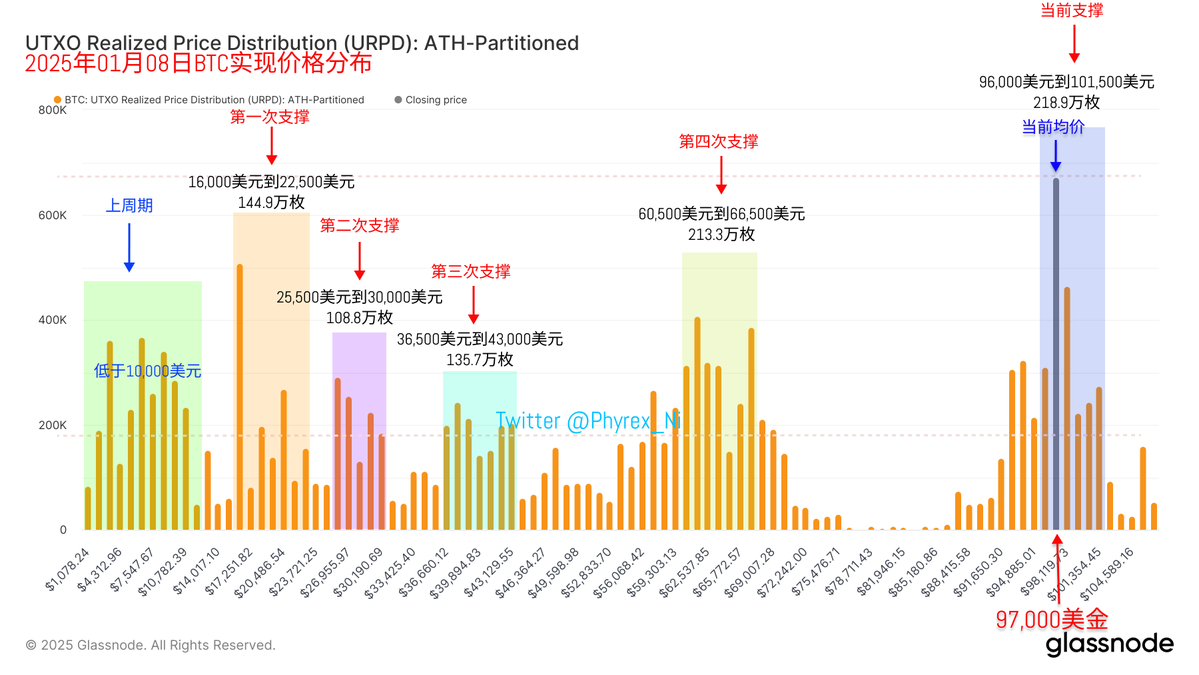
For the time being, support remains very strong, with a large amount of chips concentrated around $97,000. The support around $95,000 is still very solid, and it is possible that price stabilization will have to wait until after the non-farm data.
This time, I was indeed a bit subjective and careless, and I apologize. I overlooked the potential impact of JOLTs. However, regarding the overall trend for Q1, I still remain optimistic.
The data has been updated, address: https://docs.google.com/spreadsheets/d/1E9awSVwrVOxKOiaMdYT5YZvfveeFd9ENU-iO6dVcGj0/edit?usp=sharing
This post is sponsored by @ApeXProtocolCN | Dex With ApeX
免责声明:本文章仅代表作者个人观点,不代表本平台的立场和观点。本文章仅供信息分享,不构成对任何人的任何投资建议。用户与作者之间的任何争议,与本平台无关。如网页中刊载的文章或图片涉及侵权,请提供相关的权利证明和身份证明发送邮件到support@aicoin.com,本平台相关工作人员将会进行核查。


