Trading Philosophy: Look for trends in the long term, find entry points in the short term;
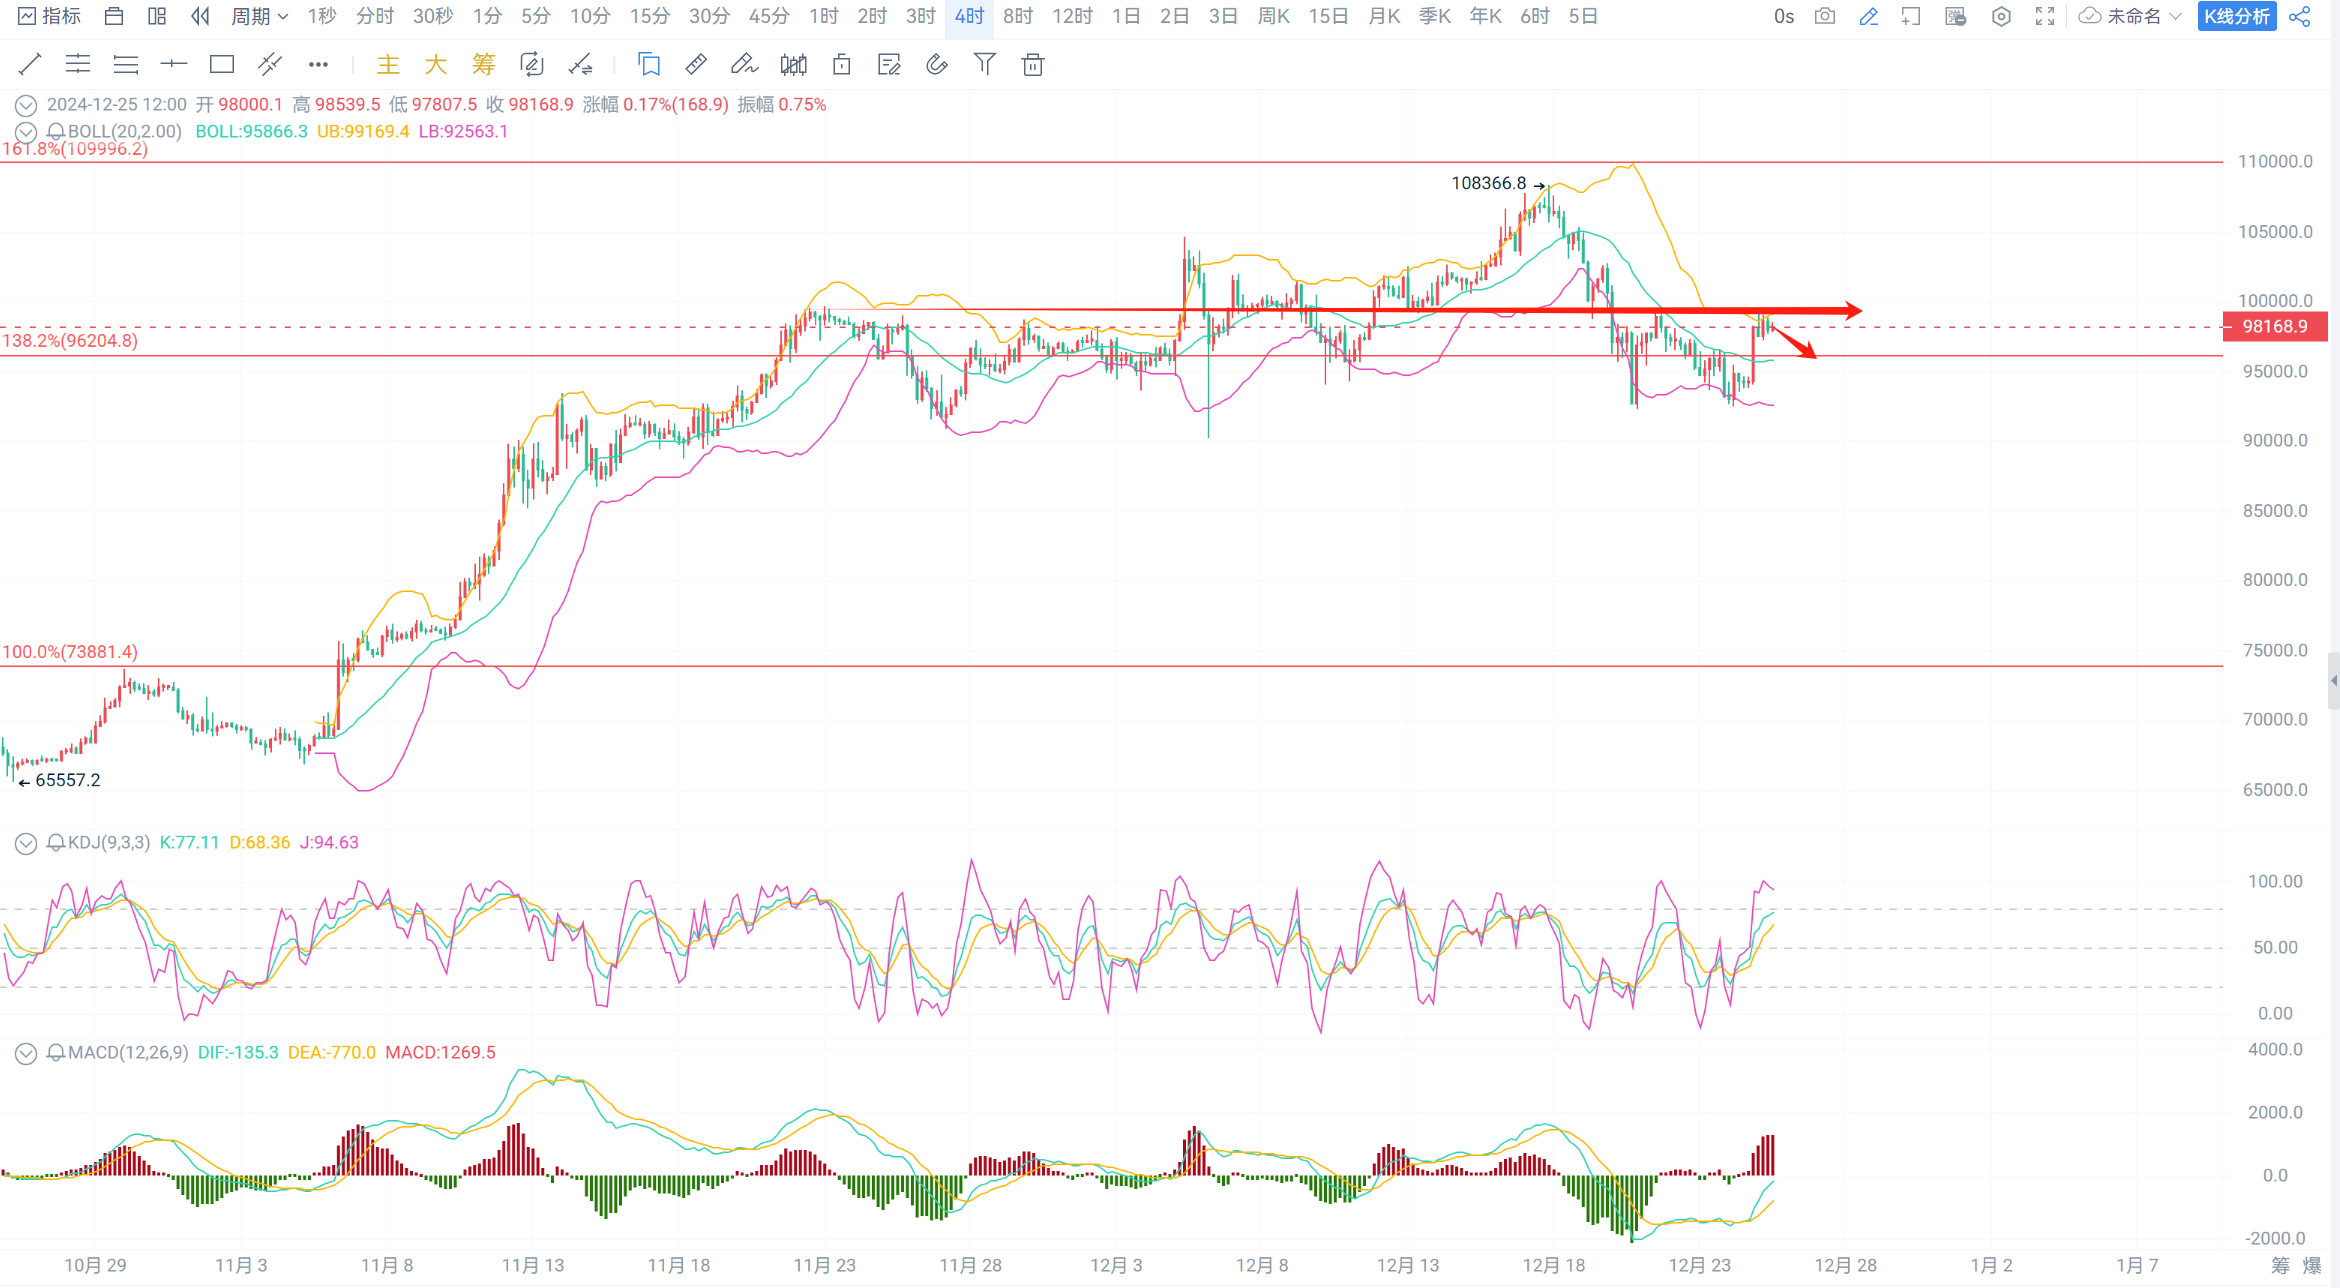
Technical Analysis: For Bitcoin, the daily chart has started to close with a bullish candle, the Bollinger Bands are still running flat, the MACD moving average continues to move downward, bearish volume is beginning to decrease, and the KDJ line is starting to move upward. On the 4-hour chart, the Bollinger Bands are beginning to open upward, the price has rebounded to the upper band, the MACD moving average continues to move upward, bullish volume is increasing, and the KDJ line is moving upward;
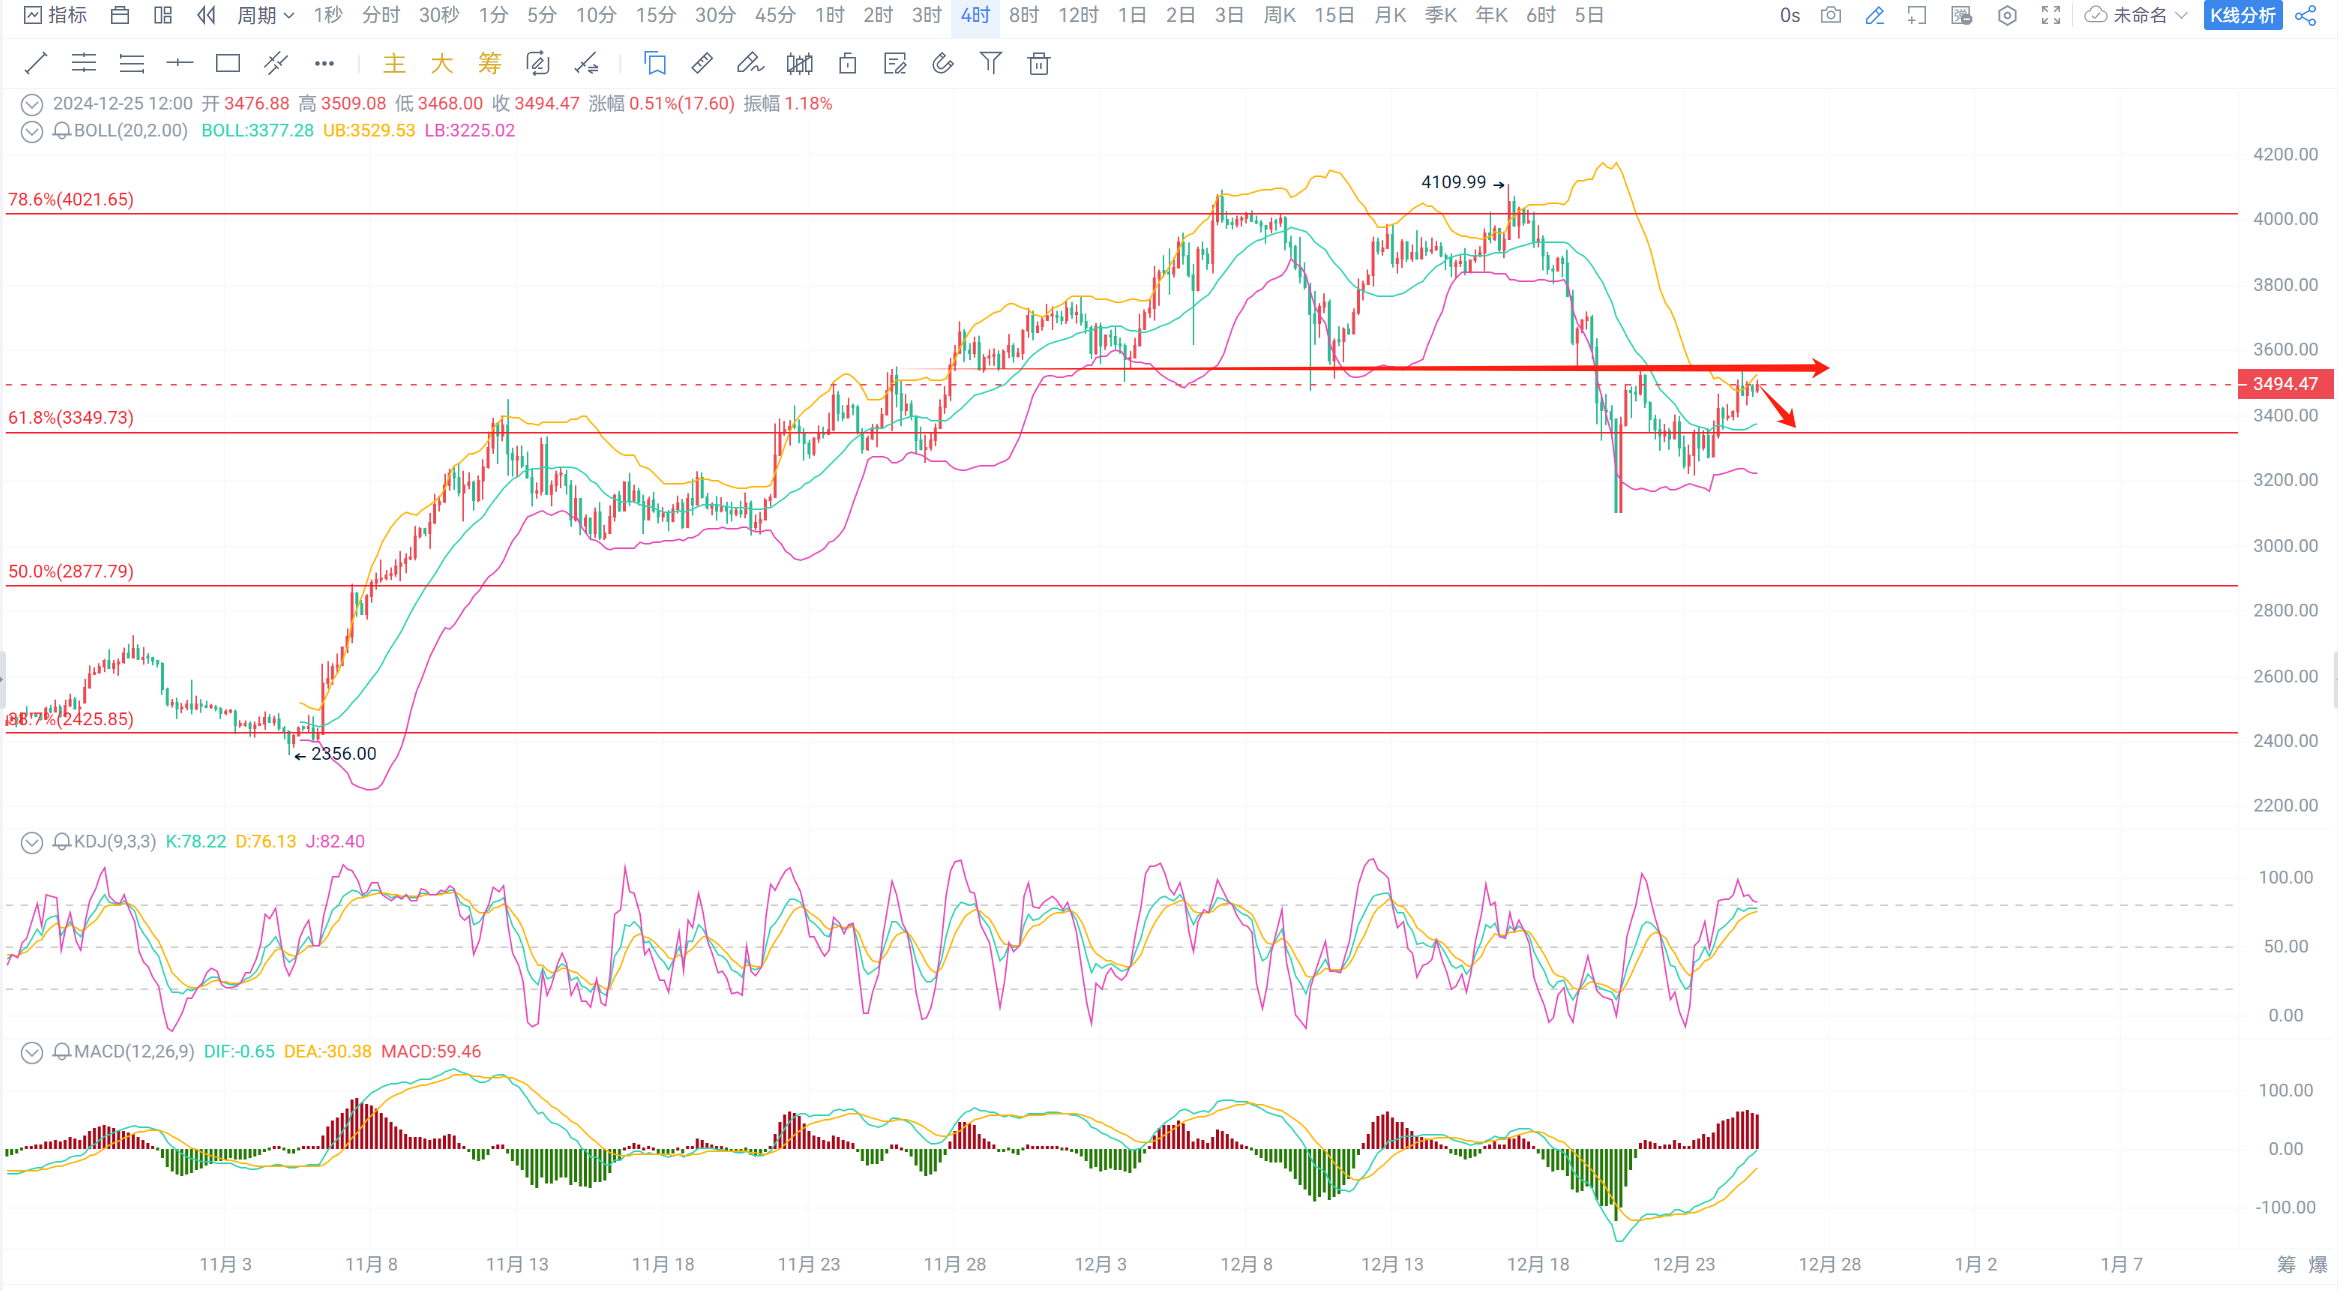
For Ethereum, the daily chart continues to close with a bullish candle, the Bollinger Bands continue to open downward, the MACD moving average continues to move downward, bearish volume is beginning to decrease, and the KDJ line is gradually moving upward. On the 4-hour chart, the Bollinger Bands are beginning to open upward, the MACD moving average is moving upward, bullish volume is increasing, and the KDJ line is gradually moving upward;
In summary, the overall market has been in a downward trend adjustment phase. The anticipated warming trend has emerged, and the market has now re-entered a range structure. The aggressive long positions laid out yesterday have exceeded expectations for profit-taking, and the market is currently at a high point in the range. It is recommended to short based on resistance levels!
Trading Advice: Short at resistance levels!
Short Bitcoin in the 99000-99500 range, target 98000-96500, stop loss at 100500;
Short Ethereum in the 3520-3550 range, target 3450-3400, stop loss at 3580;
The strategy is time-sensitive; please refer to private real-time guidance for specifics!

免责声明:本文章仅代表作者个人观点,不代表本平台的立场和观点。本文章仅供信息分享,不构成对任何人的任何投资建议。用户与作者之间的任何争议,与本平台无关。如网页中刊载的文章或图片涉及侵权,请提供相关的权利证明和身份证明发送邮件到support@aicoin.com,本平台相关工作人员将会进行核查。


