Top Escape Guide 2.0 Part Two: Stablecoin Supply
The day before yesterday, I wrote about the relationship between long-term holders and the price of #BTC. This data is a highly recommended indicator for escaping peaks and bottom fishing, especially since historically, this data has never been wrong. Of course, starting from 2024, it will be the first time that the BTC halving coincides with the Federal Reserve's monetary tightening, so I cannot guarantee that previous references will still be useful. Therefore, a multi-faceted comparison is necessary.
Aside from the long-term holder data, the amount of capital is one of the least manipulated and most measurable indicators of market sentiment. It can even be said to be the ceiling of sentiment indicators, as the state of the market is most directly related to capital. There are possibly two metrics to consider:
- The amount of money in the market
- The utilization rate of capital
Compared to other risk assets, the biggest advantage of cryptocurrencies is transparency. Although in the past two years, fiat currency has gradually allowed direct purchases of cryptocurrencies, stablecoins pegged to the dollar remain the main players in the market, especially $USDT and $USDC, which are the leaders among them. We have also verified from multiple sources that starting in 2024, it is already evident that USDC is more applicable in the cryptocurrency space compared to USDT. Although USDT has a larger scale, its applications outside the cryptocurrency industry are more prevalent.
We also know that after the approval of spot ETFs, the proportion of American investors in the market has been rising, especially during the main trading hours in the U.S., when the trading volume and depth of #Bitcoin and #Ethereum are at their highest. Therefore, USDC, as a compliant stablecoin in the U.S., can better represent the sentiment of American investors. Of course, USDT and USDC also represent the sentiments of Asian and European-American investors, respectively.
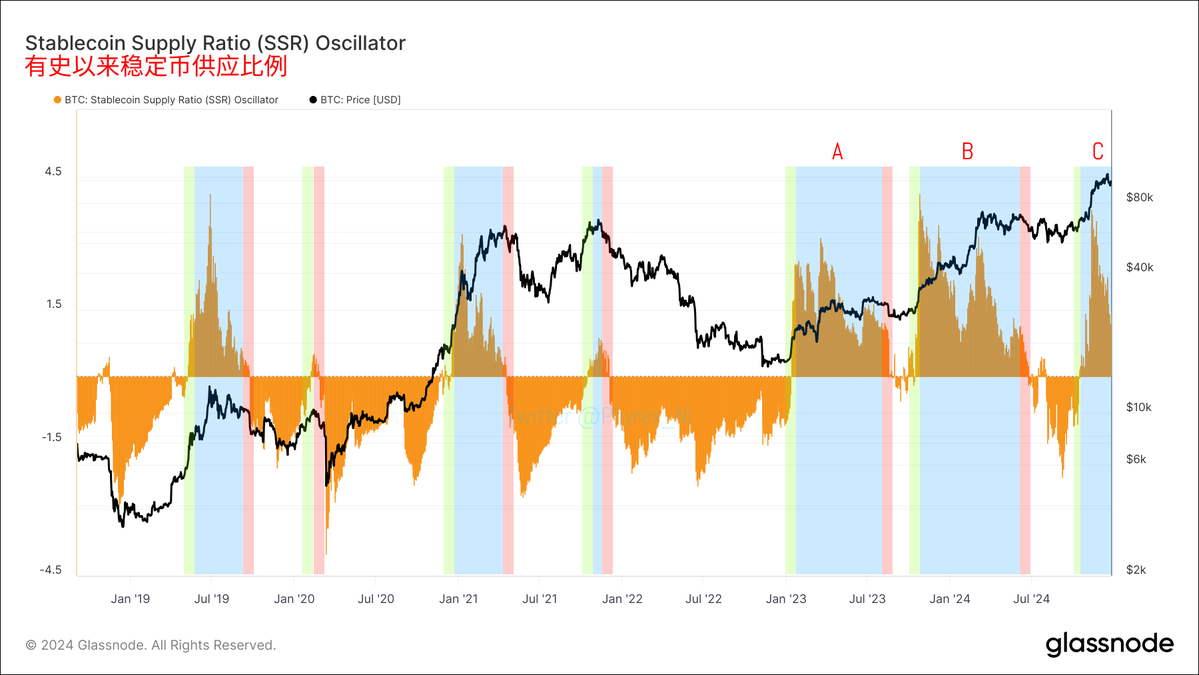
Now, let’s look at the first data point: "The Supply Ratio of Stablecoins."
I have used three colors to distinguish this data: green represents the total supply of stablecoins (including mainstream stablecoins like USDT, USDC, DAI, etc., but with a focus on USDT and USDC) transitioning from underwater to above water; blue represents the above-water range of total stablecoin supply; and red represents the process of stablecoin supply transitioning from above water to underwater.
In simpler terms, green indicates that investor sentiment is positive and ready to invest; blue represents the process of investor speculation; and red indicates that investors are gradually starting to exit.
We can clearly see that when investor sentiment begins to shift from negative to positive (green), it is a buying opportunity. While it may not be the best time, it certainly offers decent profits. Red, on the other hand, is the time to "escape the peak." Relatively speaking, buying in the green zone and selling in the red zone can yield certain profits, and historically, this has never been wrong. This represents investor sentiment, which is driven either by significant positive news or by price increases. It can be said that the longer the blue zone lasts, the greater the profit margin between green and red, making it safer.
From the current trend, it is indeed in a phase where capital is still in FOMO, entering in large amounts. It is important to note that the capital entering at this time does not necessarily translate into purchasing power, so price peaks often do not correspond to the most FOMO moments. According to past views, we are currently in the "first wave," and there should be at least two more opportunities ahead, with prices likely to continue rising. Only when sentiment (the total supply of stablecoins) gradually shifts from excitement to doubt (red) is it the final selling point.
Compared to the long-term holder data from the first part, the stablecoin supply data is more suitable for mid-term users. It is clear that after entering 2023, there have been distinct indicators:
A: The first buying point at $17,000 and the first selling point at $26,000.
B: The second buying point at $27,000 and the second selling point at $60,000.
C: The third buying point at $67,000, with no new selling point appearing until now.
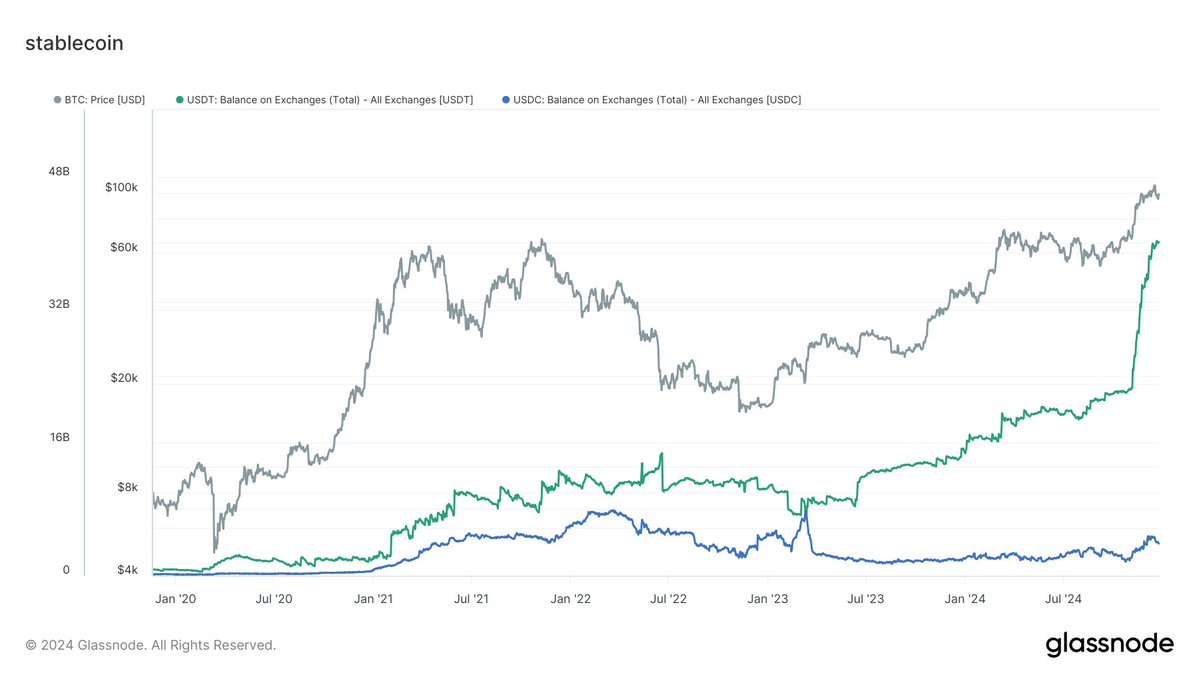
Advanced Data — Capital Utilization Rate: This data is quite difficult to use as an escape peak indicator, as it is very hard to quantify. However, it can be assessed through the stock data of USDT and USDC on exchanges.
From this data, we can see that the gray line represents the price trend of BTC, the green line represents the stock of USDT on exchanges, and the blue line represents the stock of USDC on exchanges. Although the amount of capital flowing into exchanges via USDT is the largest and the stock is higher, there are no signs of this stock turning into purchasing power. All the capital is piling up without significant turnover, and USDT often represents the peak of the altcoin season. Therefore, when USDT is not heavily involved in turnover, it can be considered that we have not yet reached the peak of the altcoin season (though it could be the beginning of the altcoin season).
In contrast to USDT, USDC shows more obvious turnover. Although there are signs of capital accumulation, the utilization rate is somewhat higher, and USDC represents mainstream tokens like #BTC and #ETH.
This post is sponsored by @ApeXProtocolCN | Dex With ApeX
免责声明:本文章仅代表作者个人观点,不代表本平台的立场和观点。本文章仅供信息分享,不构成对任何人的任何投资建议。用户与作者之间的任何争议,与本平台无关。如网页中刊载的文章或图片涉及侵权,请提供相关的权利证明和身份证明发送邮件到support@aicoin.com,本平台相关工作人员将会进行核查。


