Whether you are a short-term or long-term trader, you need to be a "friend of time."
Investing should not be rushed; the key is to persistently adhere to your trading system!
Congratulations to Bitcoin for reaching the 100,000 milestone!
Teacher J will guide you through this historic moment using the simplest volume-price relationship!
The volume-price relationship is one of the essential skills for every cryptocurrency trader!
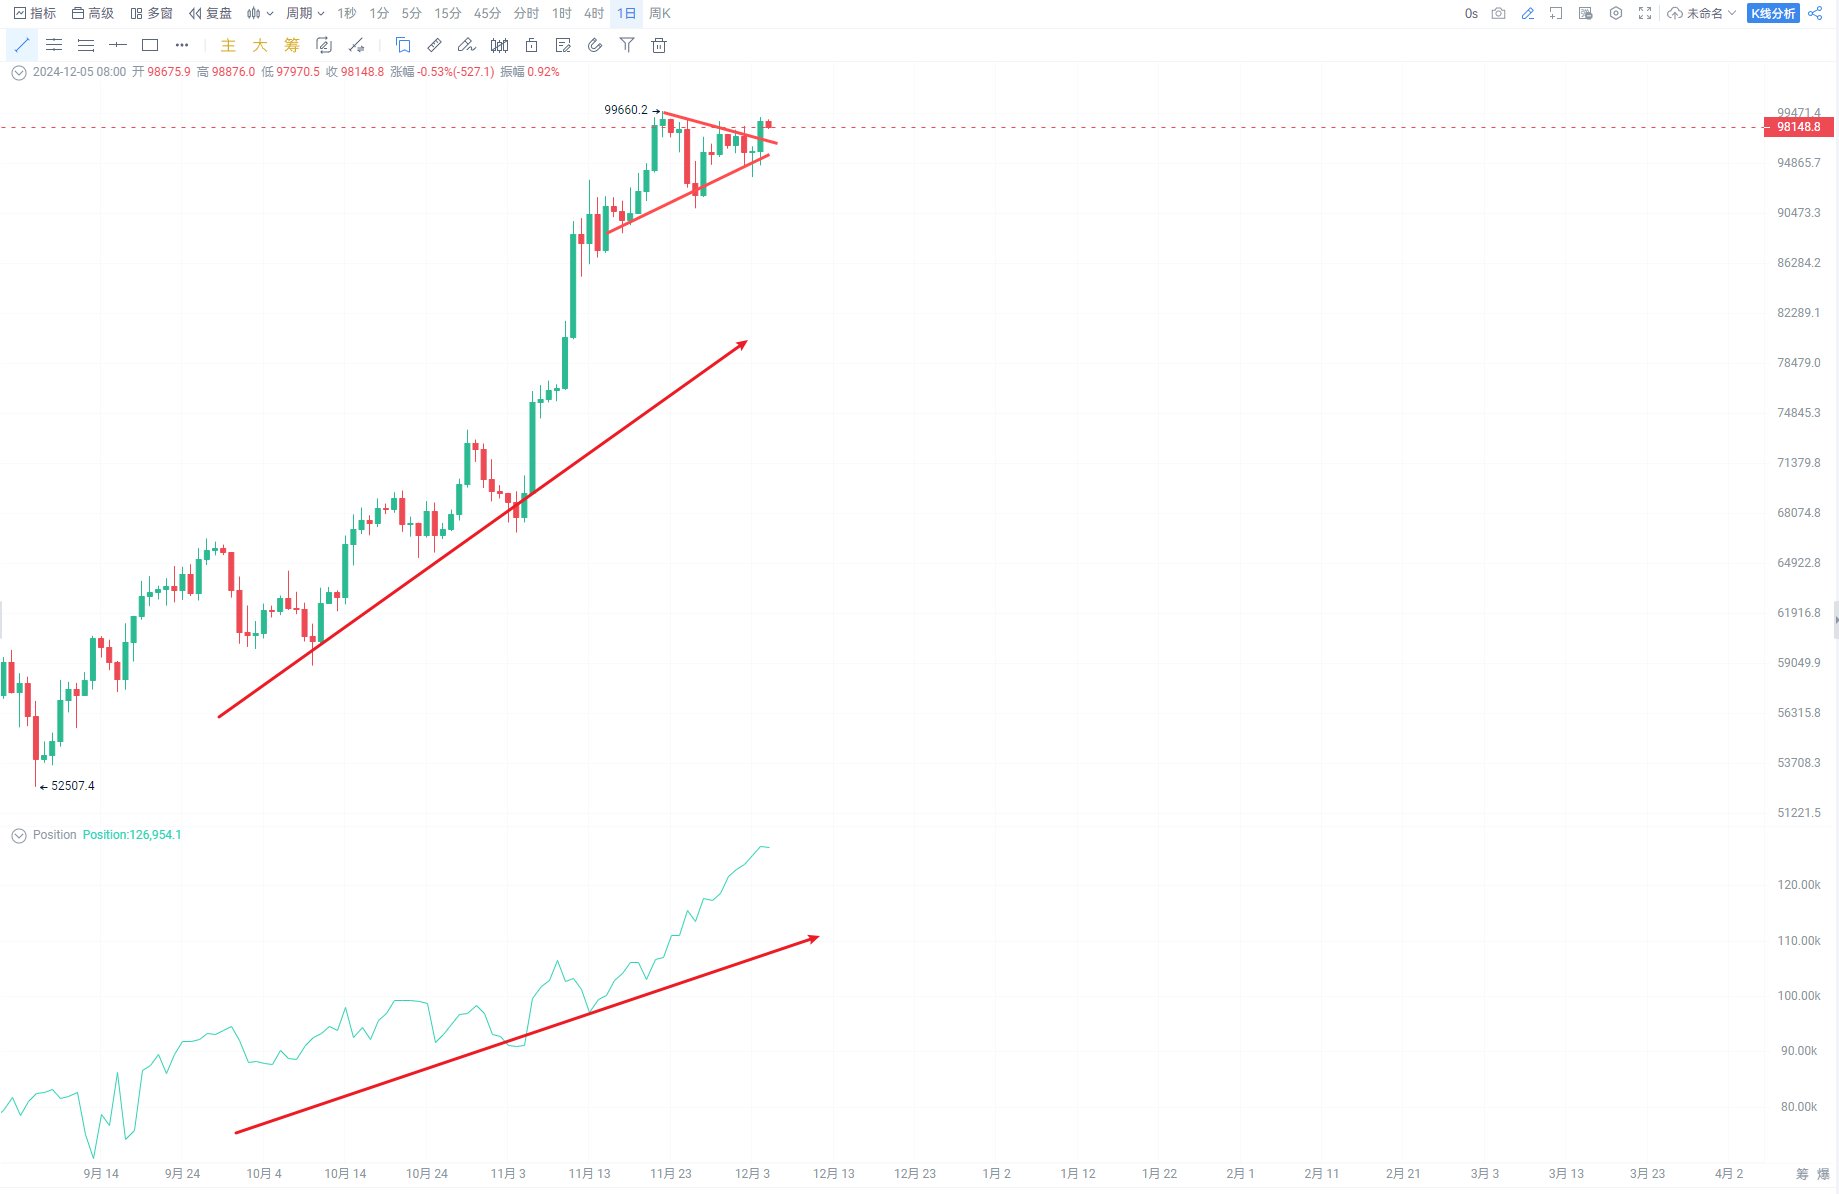
- Position Continues to Rise
From the position curve, we can see that during the price increase, the overall position shows a steady upward trend.
This indicates that funds are continuously flowing into the market, and more funds are choosing to continue building long positions after the price breakout.
This situation of rising position alongside price most often suggests that bullish sentiment is dominant, and the price trend is likely to continue further.
- Capital Flow Analysis
Capital flow (Net Volume Flow) refers to the net inflow or outflow of funds in the market, which usually reflects changes at the exchange level or on-chain funds. A decrease in funds means that more money is flowing out of the market rather than into it.
Comparing with the above chart, we find a divergence between the two; here we present two possible reasons:
Although position increases, due to capital outflow, this may be caused by "counterparty" actions, such as short-term speculators increasing short positions rather than large funds buying long.
Major funds may be taking profits at high levels, while retail or short funds are increasing their positions, causing the overall position to continue rising.
Hedging to mitigate risk (for example, buying futures or contracts short). New short and hedging actions may not increase actual fund inflow but only change the market's position structure.
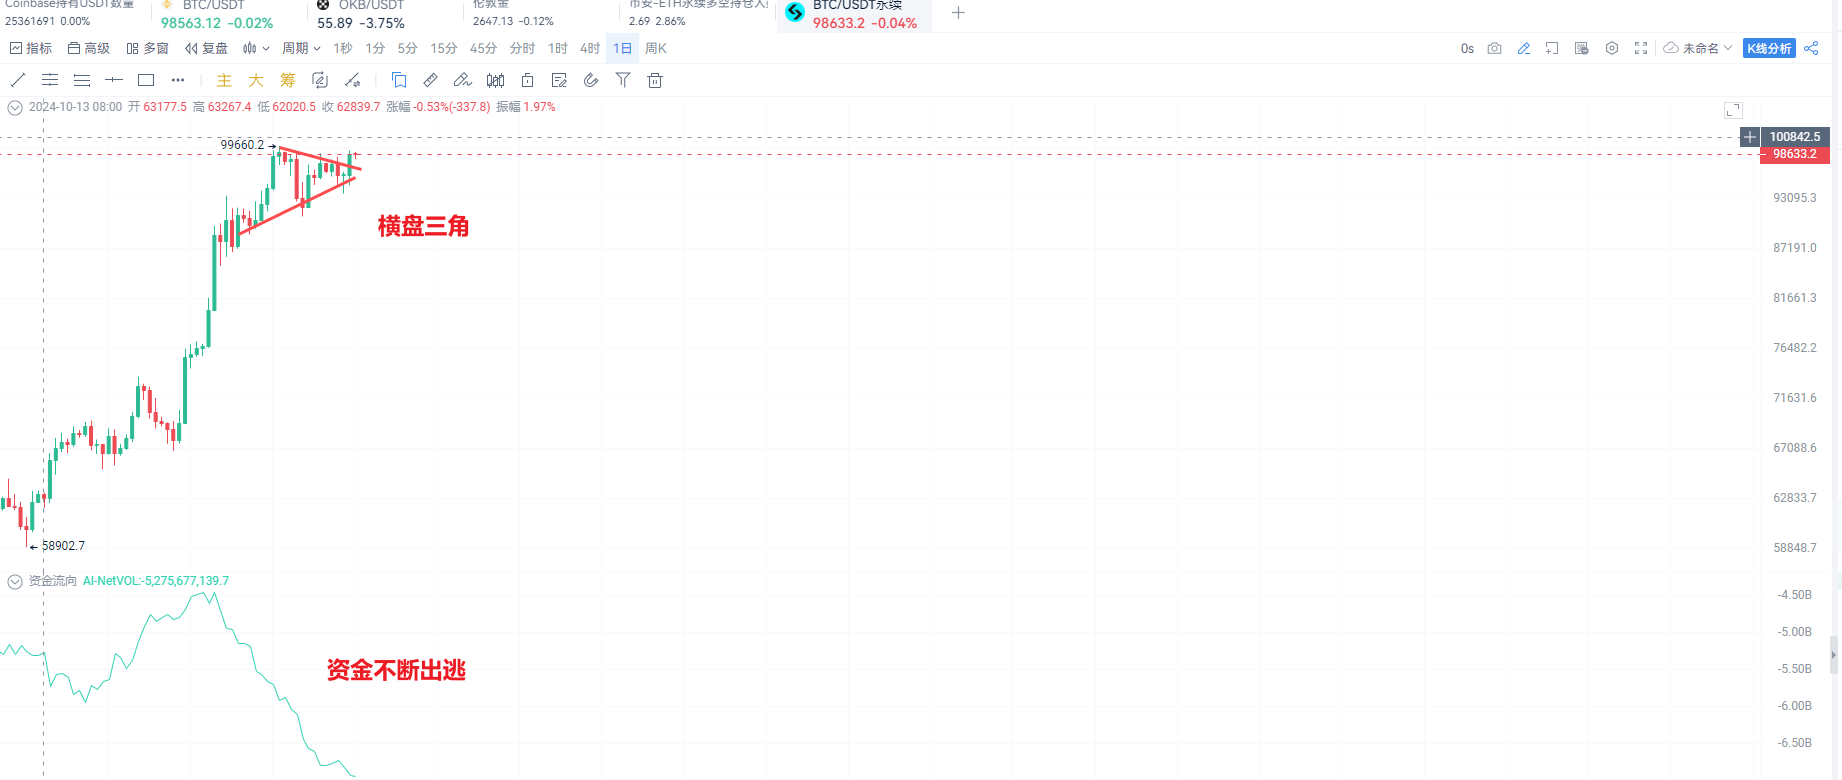
An increase in position indicates an increase in market counterparties, but a net outflow of capital may suggest that major funds are exiting or short positions are increasing. The divergence indicates a growing disagreement between bulls and bears, and the market may enter a consolidation phase or face the risk of false breakouts.
- Traditional Volume-Price + Pattern Analysis for Auxiliary Analysis
We see that on December 5, Bitcoin's price broke through a triangular flag (the volume below also experienced a breakout, achieving "volume and price rise together"), and through AICoin's "chip distribution," we can see that a large number of chips are located at the previous K-line before the breakout (95,000), providing strong support for the breakout, increasing the probability of success!
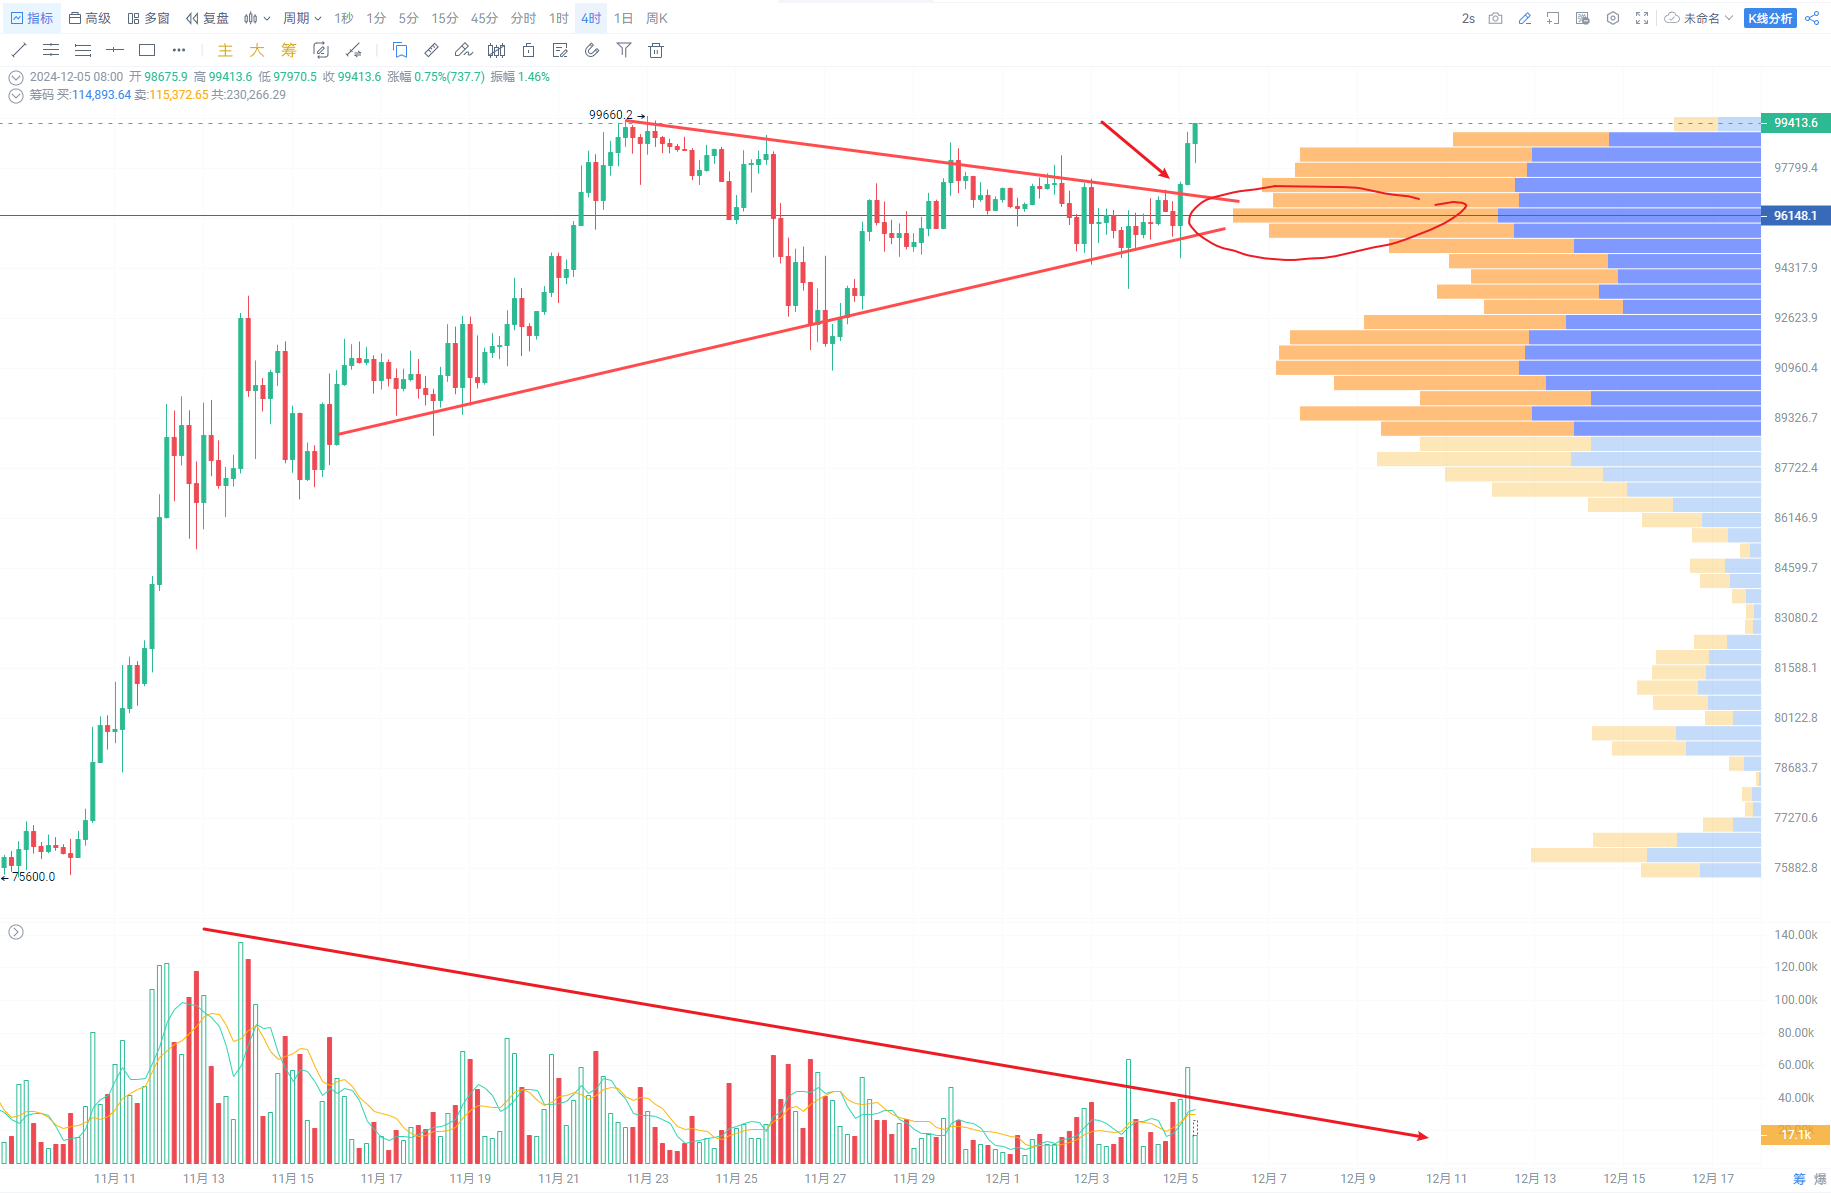
If you are a traditional "line-drawing" trader, entering a position at the breakout means you are currently in a profit state!
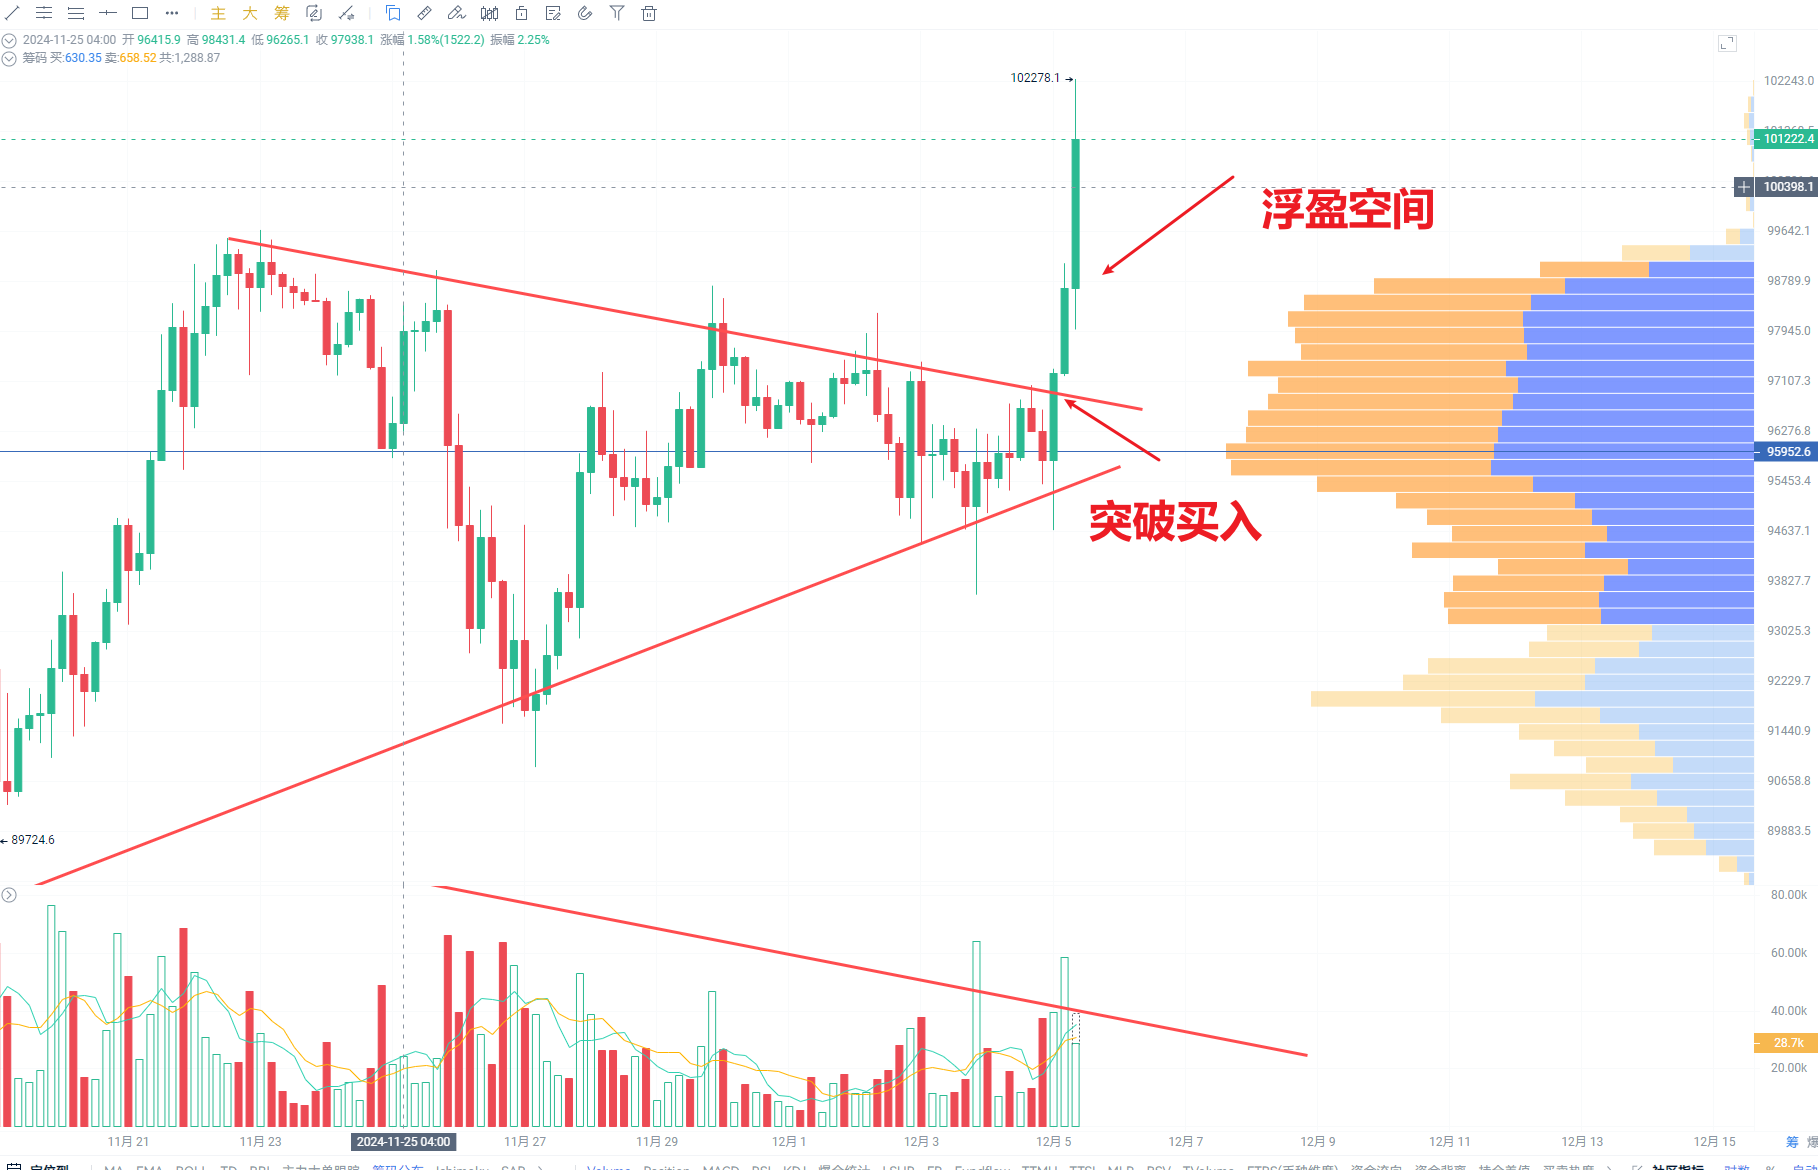
Pay attention to changes in capital flow and the accompanying trading volume. If subsequent capital inflow and price breakout are synchronized, it can confirm an upward trend; otherwise, be cautious of a pullback and set stop-losses to avoid risks.
⚠ Note: The above operational suggestions do not constitute investment advice and do not recommend any cryptocurrency. All investors should trade rationally within their capabilities!
免责声明:本文章仅代表作者个人观点,不代表本平台的立场和观点。本文章仅供信息分享,不构成对任何人的任何投资建议。用户与作者之间的任何争议,与本平台无关。如网页中刊载的文章或图片涉及侵权,请提供相关的权利证明和身份证明发送邮件到support@aicoin.com,本平台相关工作人员将会进行核查。


