10.21 Live Summary
On October 21 at 16:00, the AICoin editor conducted a graphic and text sharing session titled "Reversing the Situation, Locking in These Reversal Signals" in the 【AICoin PC - Group Chat - Live】. Below is a summary of the live content.
How to Confirm Reversal Signals
Method 1: Liquidation Statistics Indicator
① During an uptrend, concentrated liquidations of short positions are likely to lead to a price pullback.
② During a downtrend, concentrated liquidations of long positions are likely to lead to a price rebound.
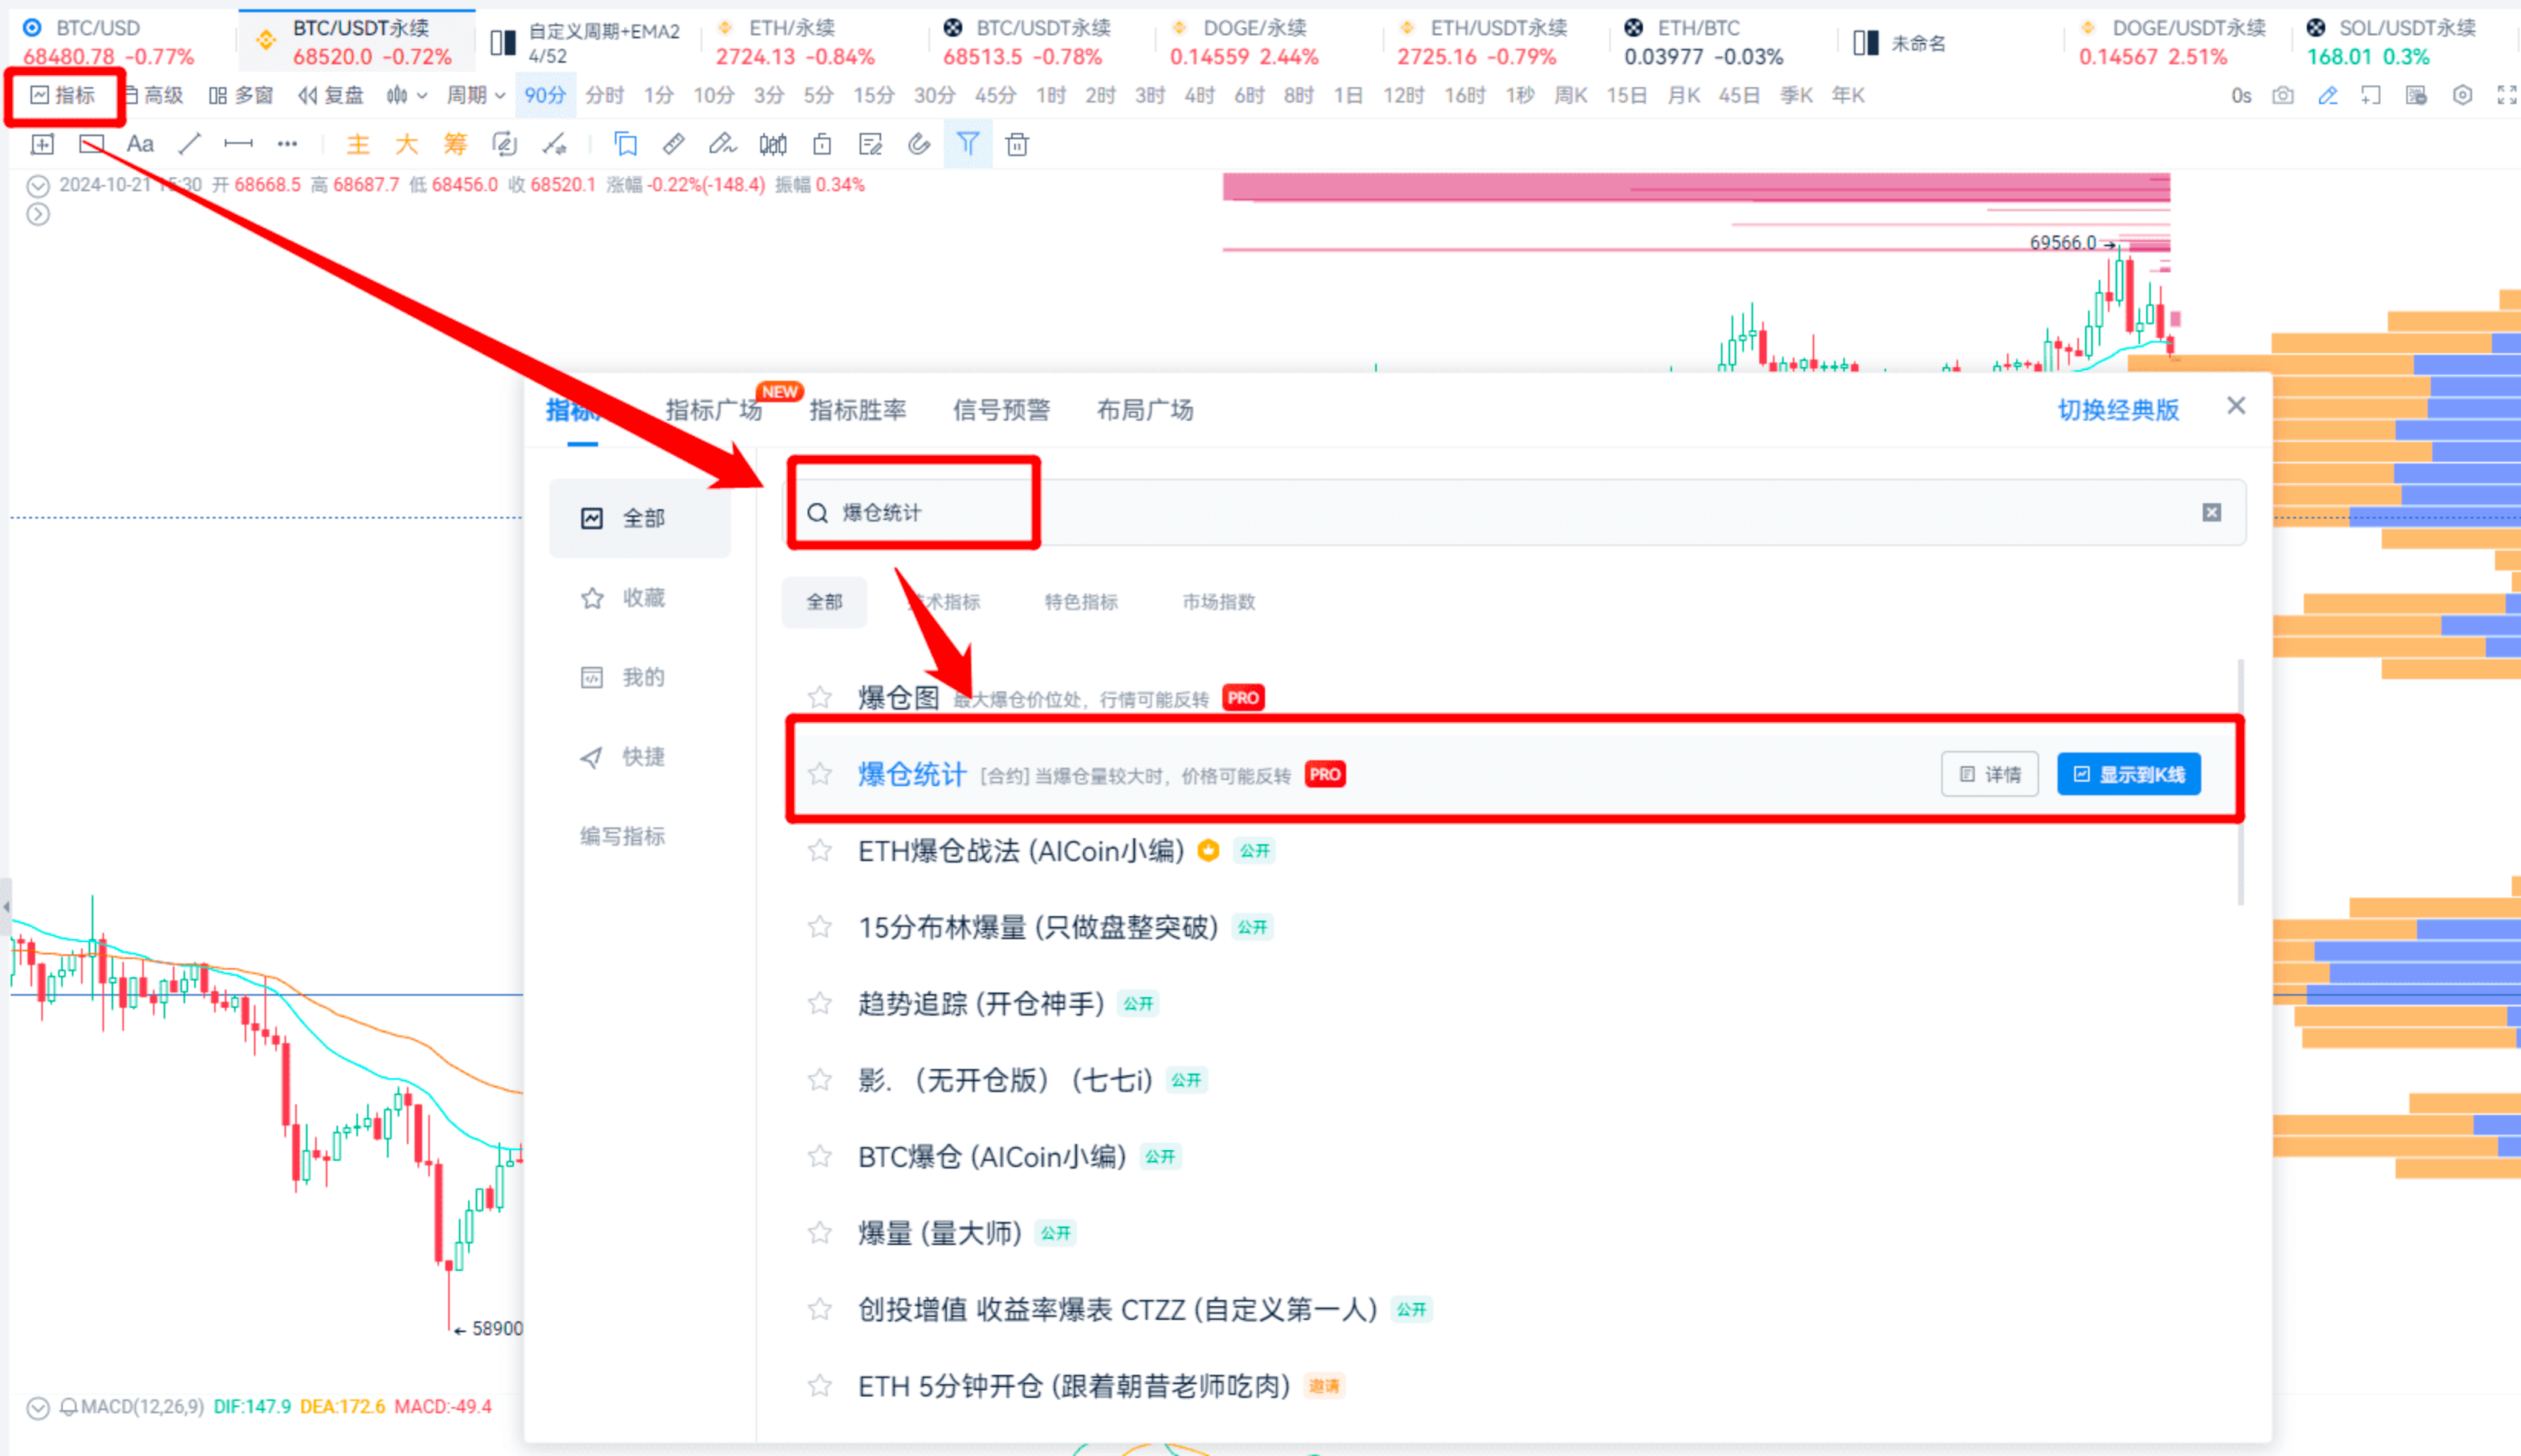
You can set a threshold for judgment
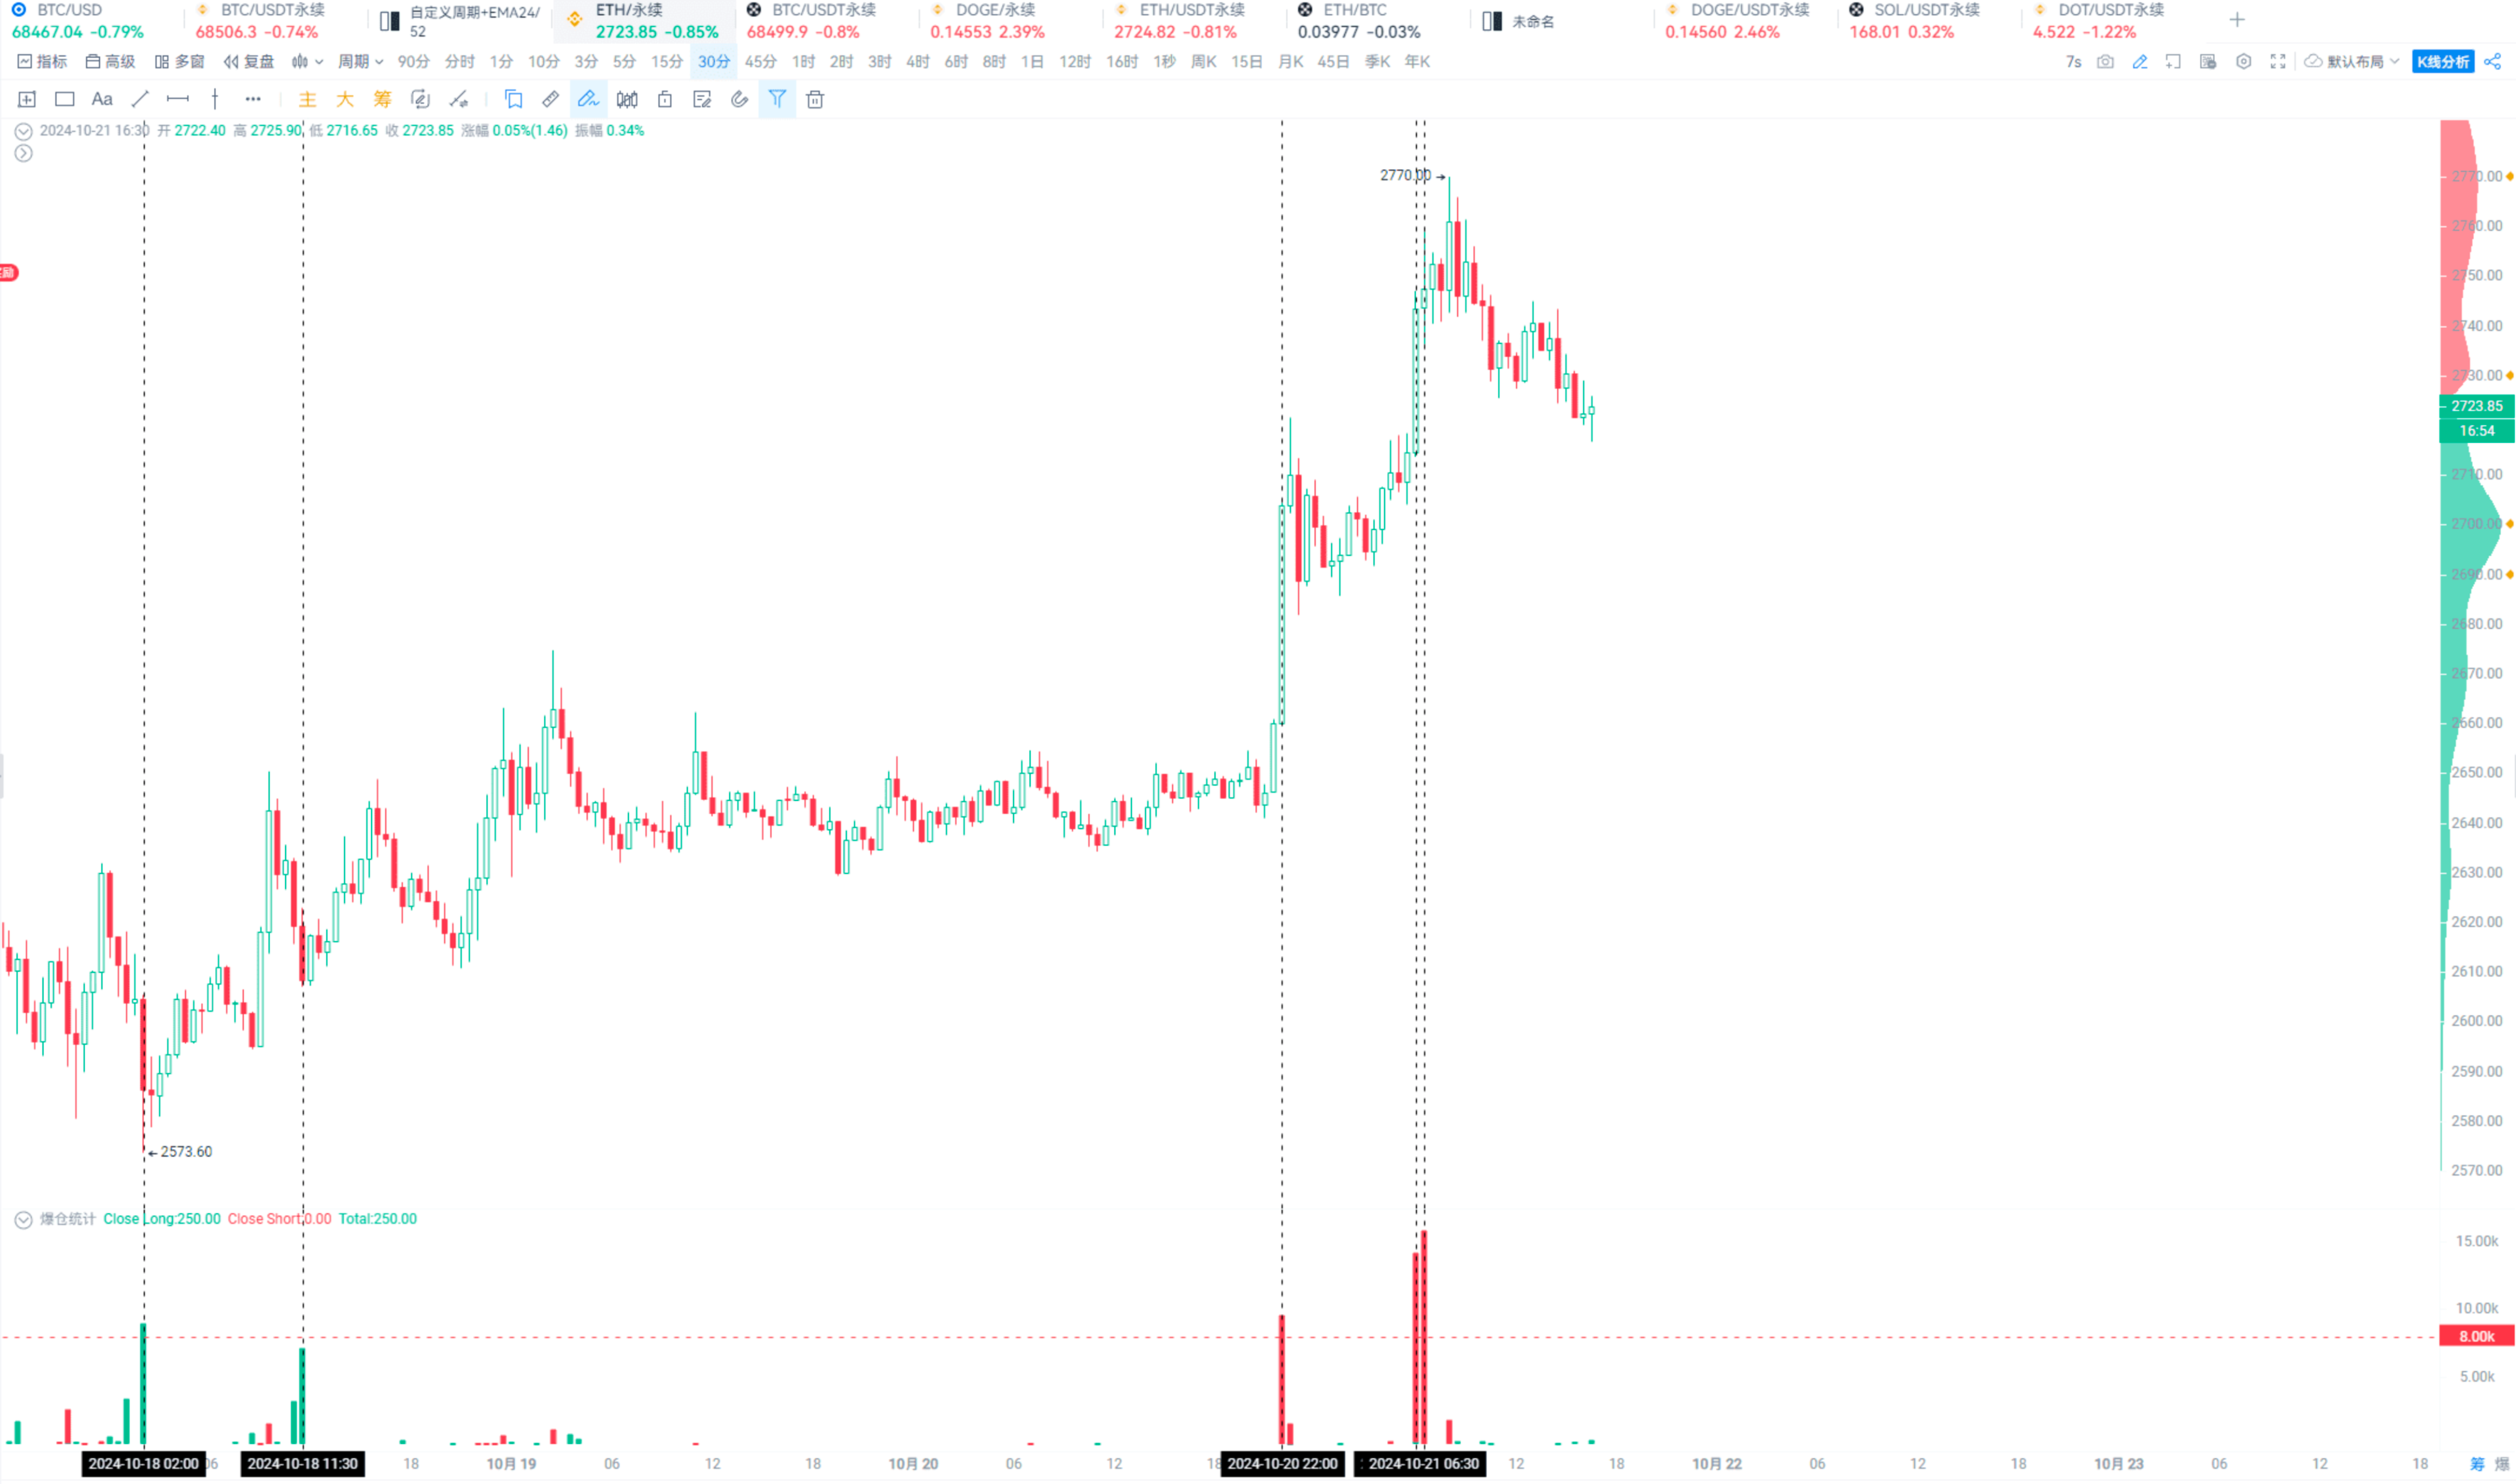
For example: For Binance's DOGE perpetual contracts, pay attention when it exceeds 12,000 contracts.
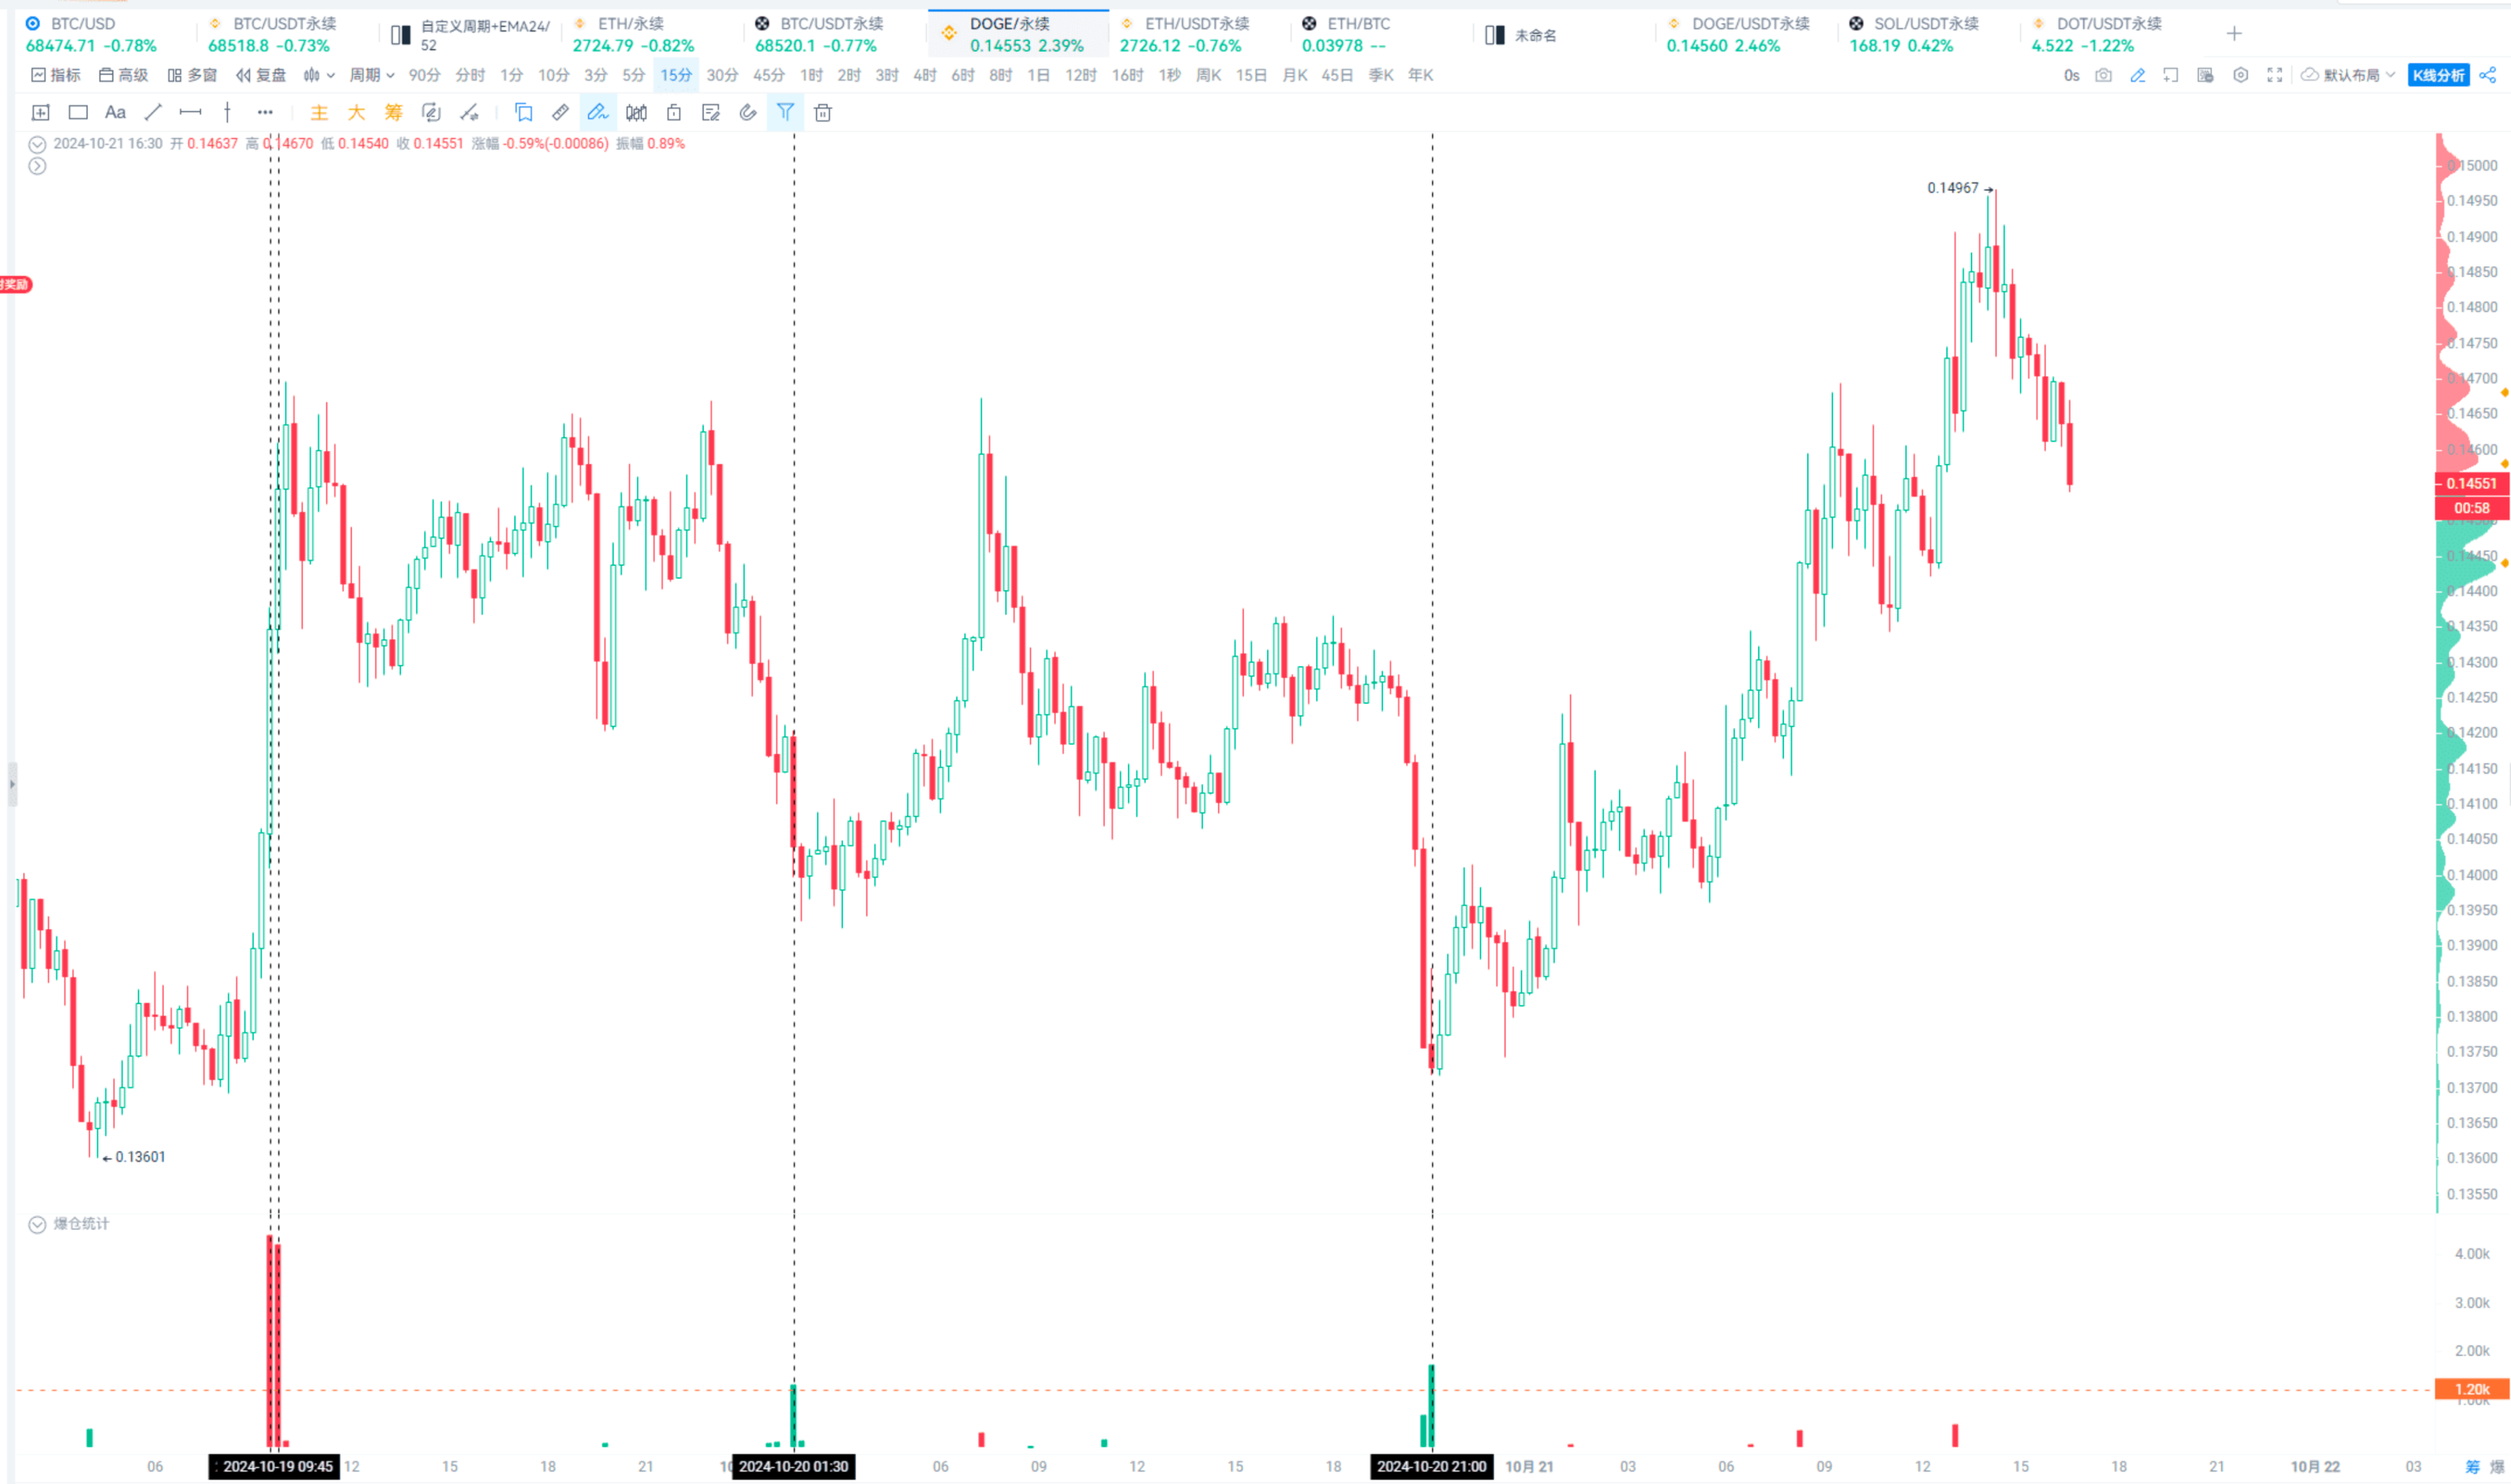
The effect is quite good, on a 15-minute cycle.
For example: For OKX's BTC/USDT perpetual contracts, pay attention when it exceeds 2,000 contracts.
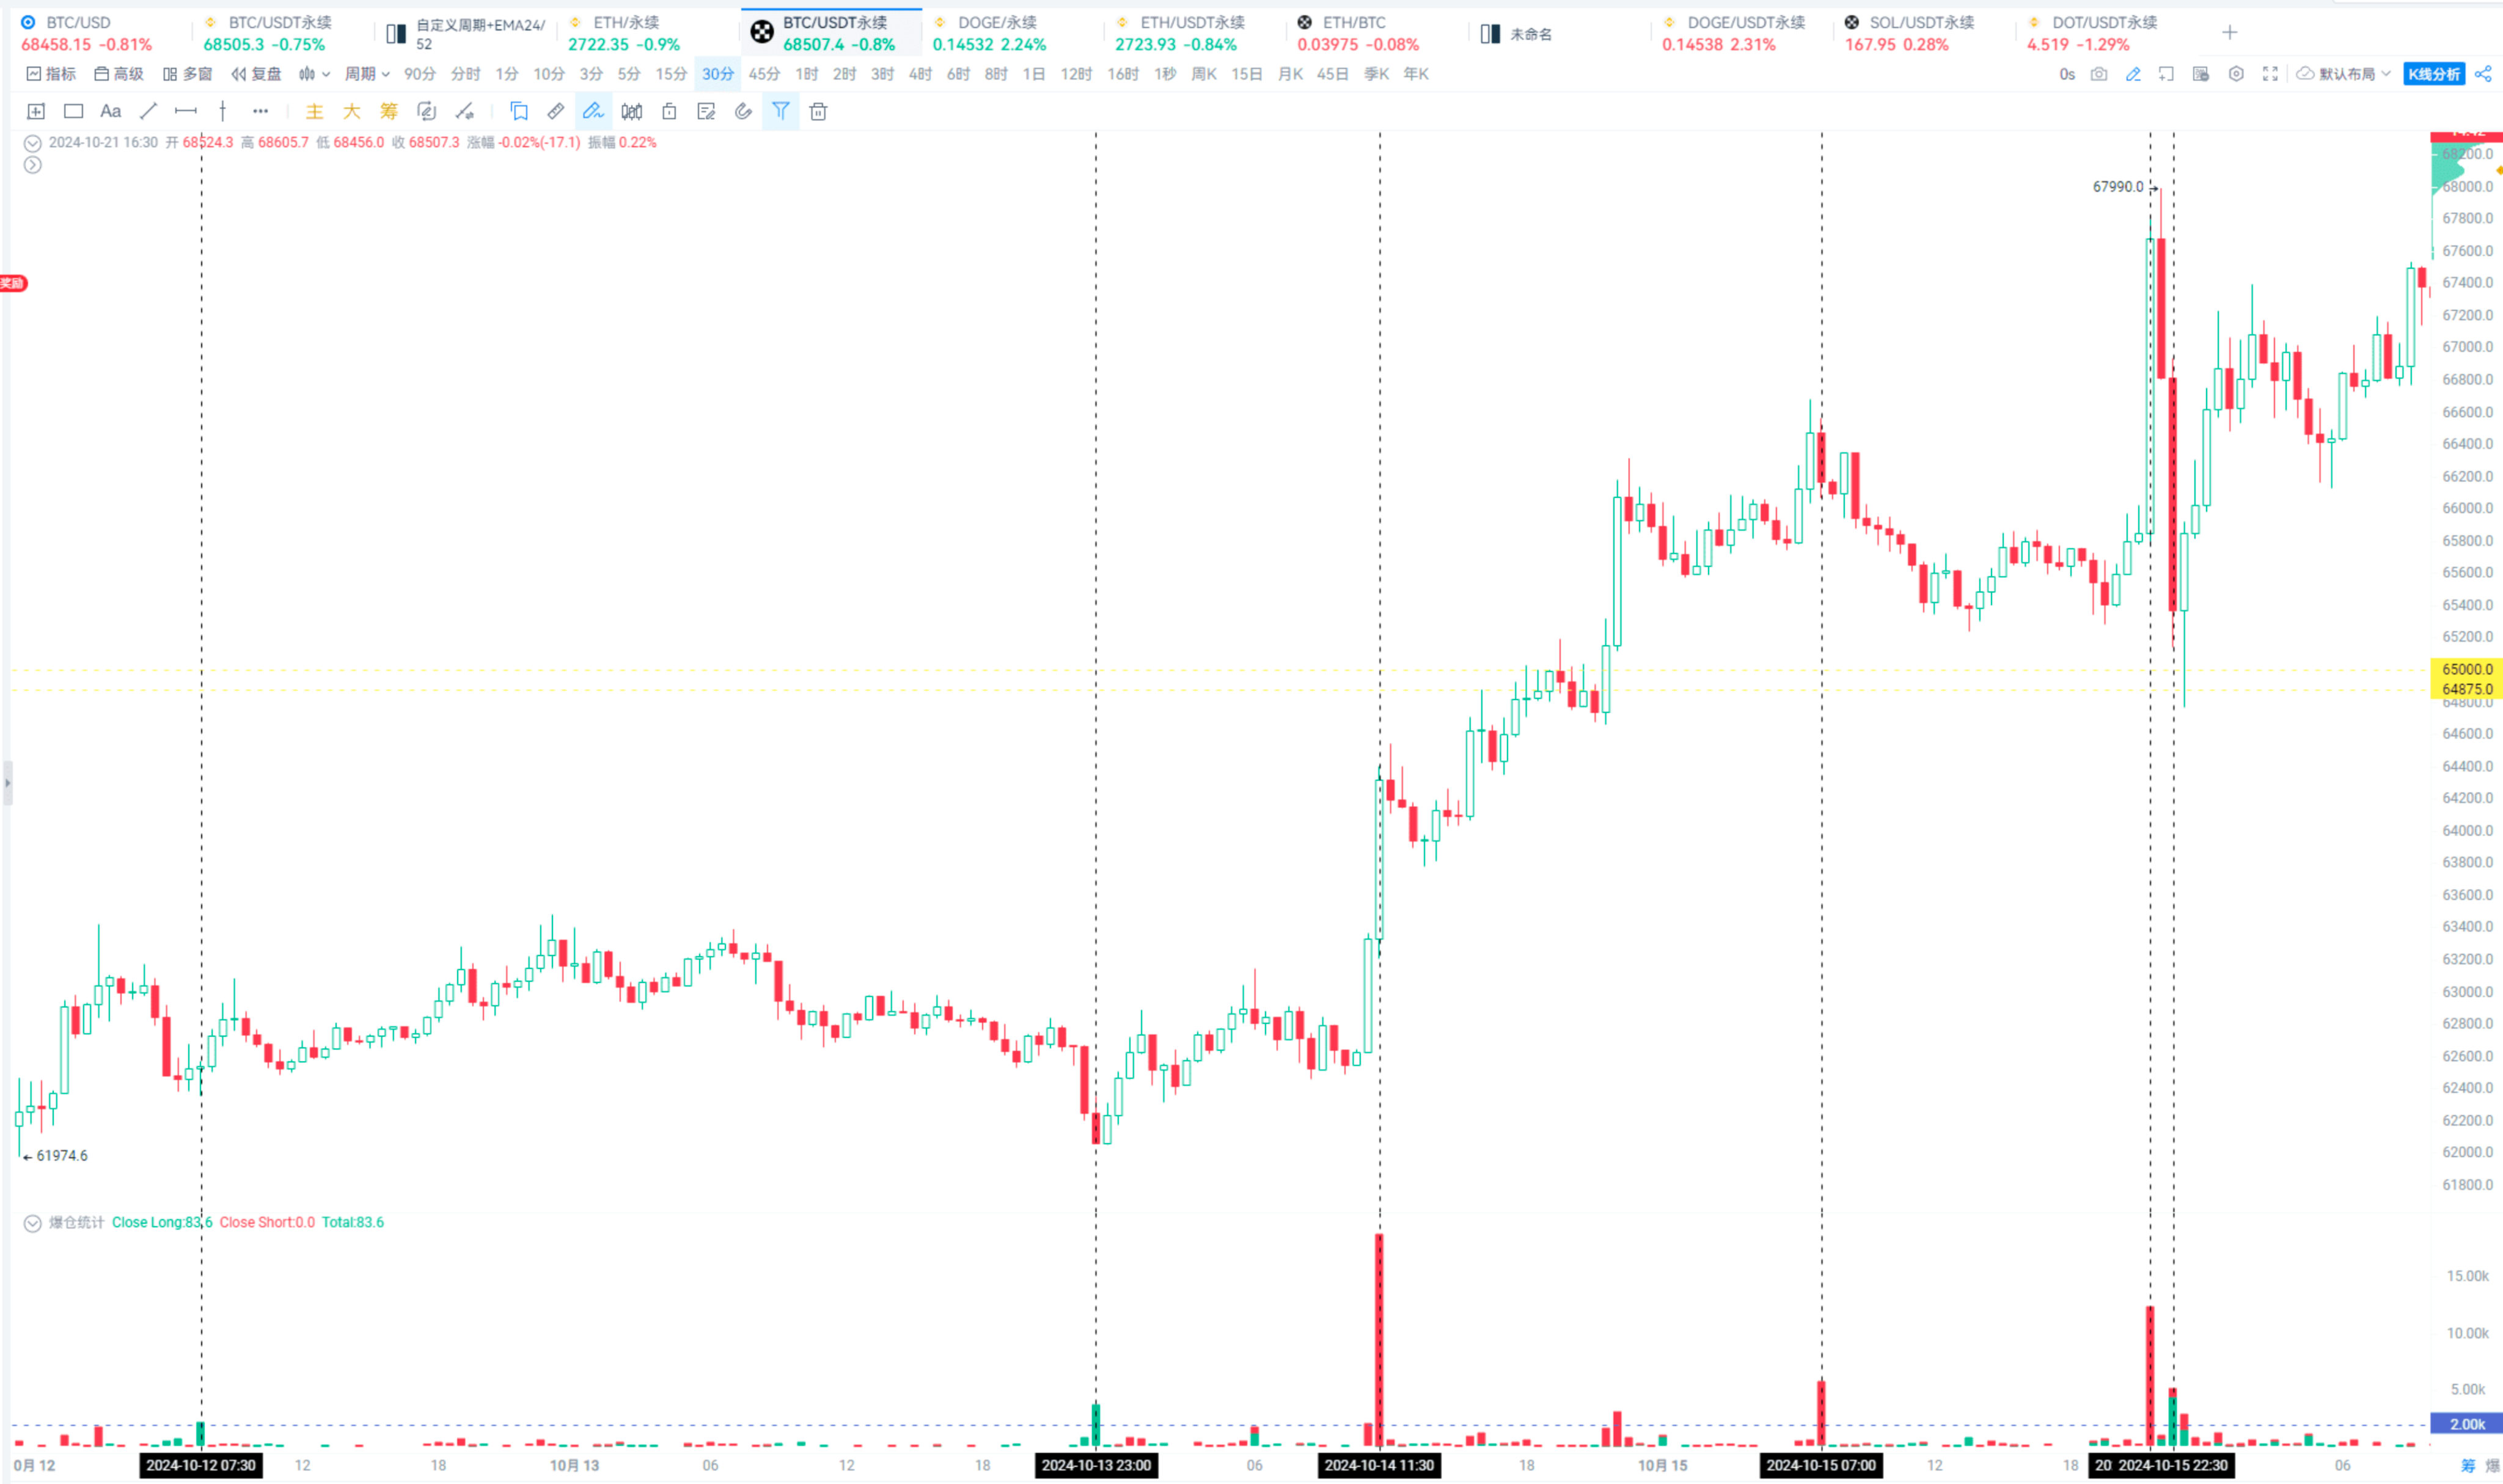
Once a liquidation threshold is determined, you can monitor it using a custom indicator.
As shown, the green arrow indicates long position liquidations, and the red arrow indicates short position liquidations.
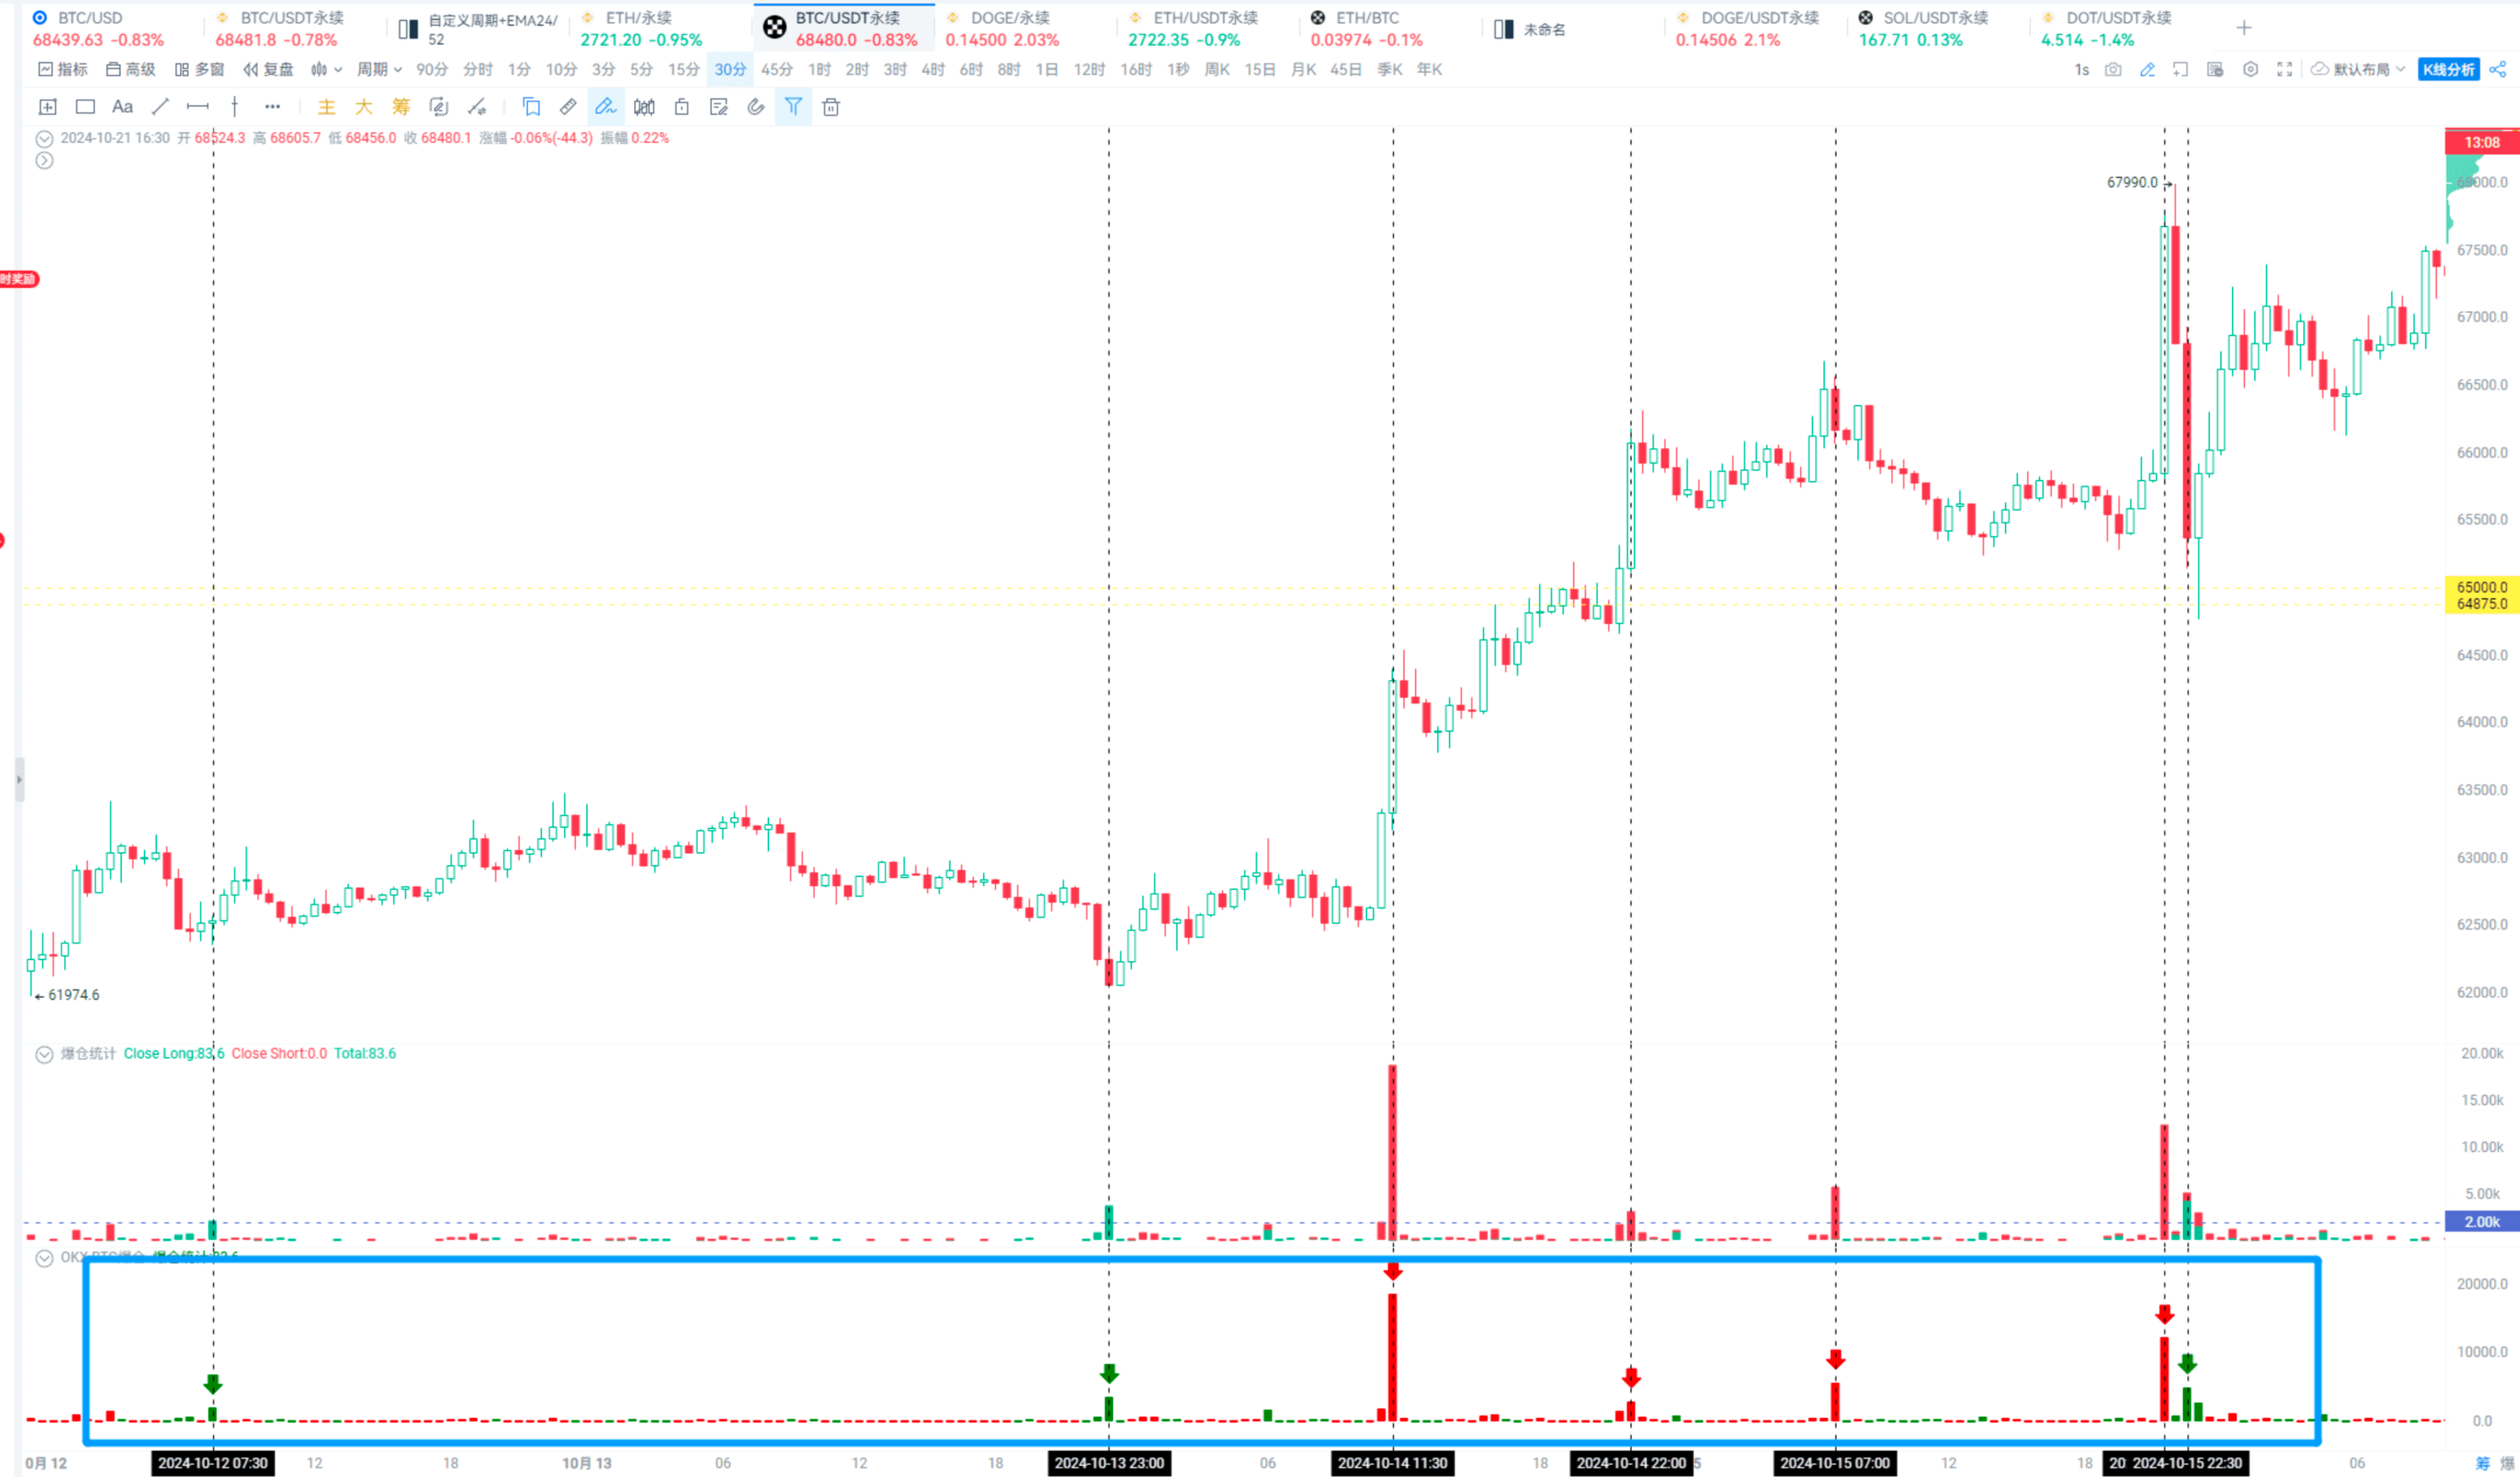
It's very convenient; for different trading pairs, you only need to change the threshold or function name.
// @version=2
// This indicator was created by the AICOIN Research Institute. If you encounter any usage issues, you can join the indicator community for consultation.
// Calculation and
totalliquidation = liqlongsize + liqshort_size; // Define alert conditions
alertcondition = totalliquidation >= 2000 and liqlongsize >= 2000 or liqshortsize >= 2000; // Plot on the chart
plotShape(liqlongsize >= 2000, title='Long Liquidation', shape='arrowDown', refSeries=total_liquidation, color='green', fill=true, placement='top', display=true);
plotShape(liqshortsize >= 2000, title='Short Liquidation', shape='arrowDown', refSeries=total_liquidation, color='red', fill=true, placement='top', display=true);
// plotColumn(total_liquidation, title='Liquidation Statistics', color='green', fill=true, display=true);
// plotColumn(liqshortvol, title='Short Liquidation Statistics', color='red', fill=true, display=true); // alertcondition(alert_condition, title='Liquidation');
alertcondition(liqlongsize >= 2000, title='Long Liquidation', direction='sell');
alertcondition(liqshortsize >= 2000, title='Short Liquidation', direction='buy'); plotColumn(totalliquidation, title='Liquidation Statistics', color=liqlongsize > liqshort_size ? 'green' : 'red', fill=true, display=true);
【If needed, you can take the code.】
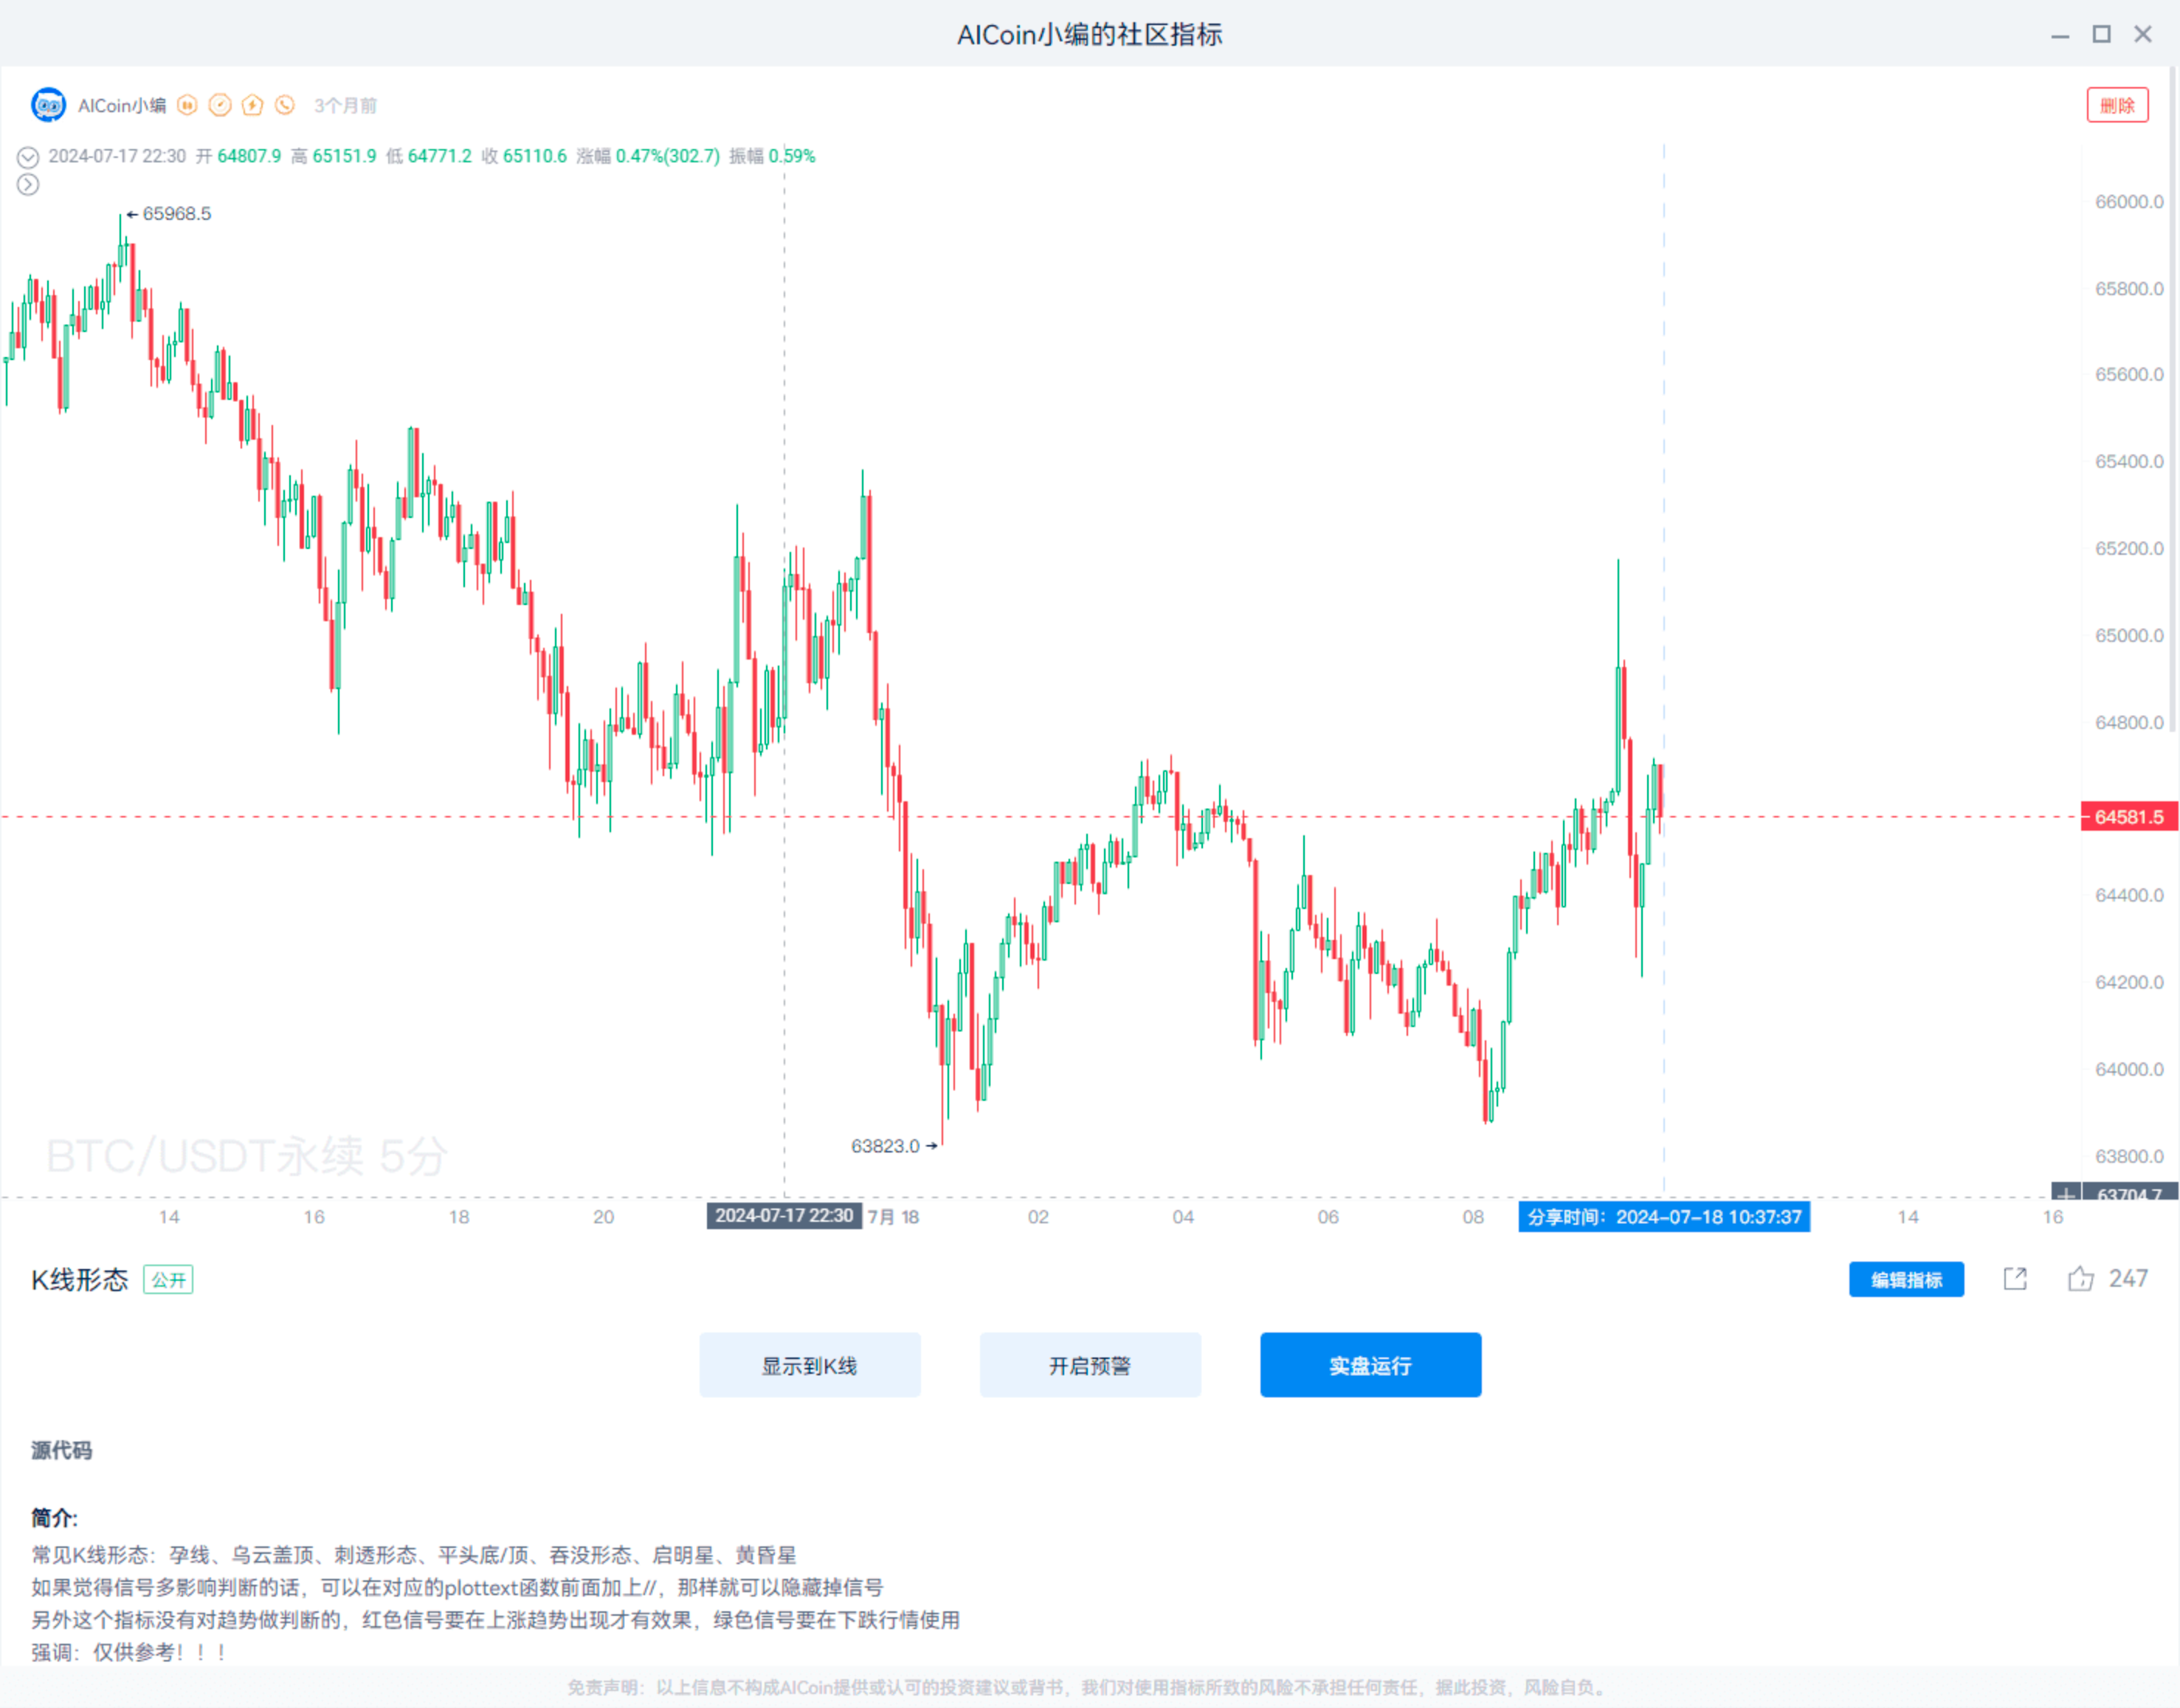
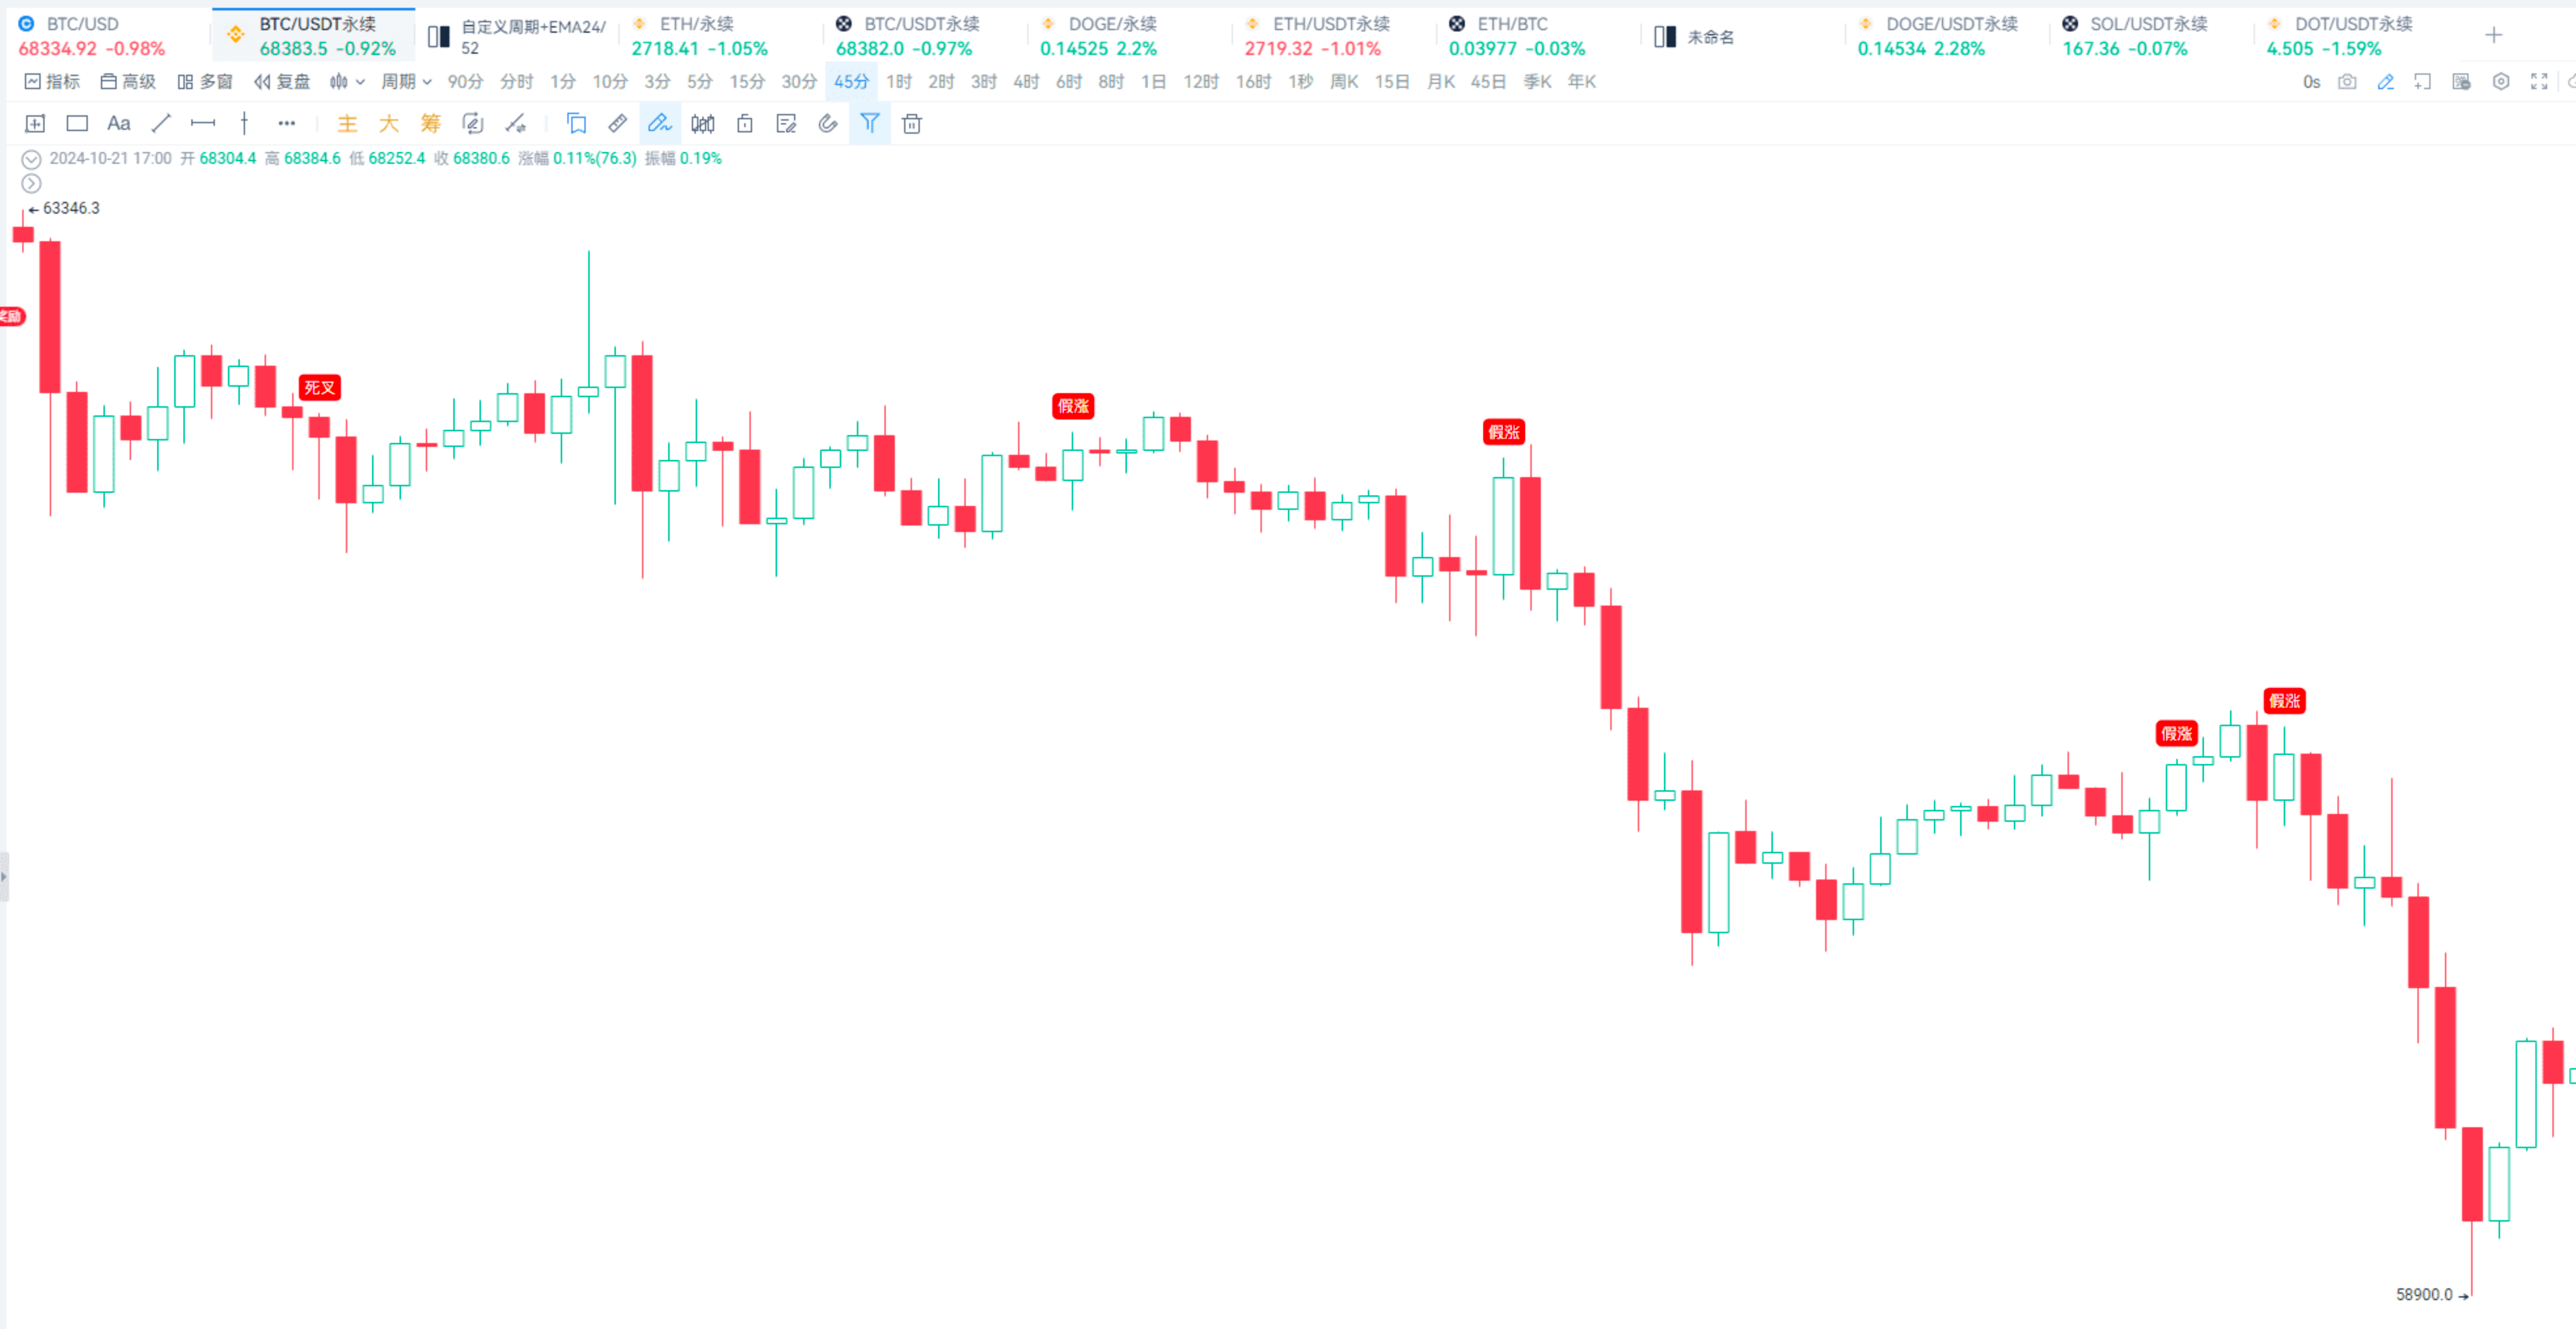
Method 2: Candlestick Patterns
Take the shooting star as an example; it is a top reversal signal that appears in an uptrend, forming an inverted hammer candlestick pattern. Other reversal candlestick patterns include morning star, evening star, pin bar, and dark cloud cover.
If you don't understand how to judge, that's okay; you can refer to this indicator.
This indicator is a summary of some common reversal patterns but requires manual intervention for trend judgment: https://www.aicoin.com/link/script-share/details?shareHash=Q4WOyYKX5Rkpabjz
For example, a friend asked: "Many times when a shooting star appears, it still goes up a bit more."
My judgment method is: do not look at short-term cycles; look at cycles above 45 minutes, or add a threshold judgment, such as an amplitude exceeding 0.8%, while the upper shadow is 2-3 times the body.
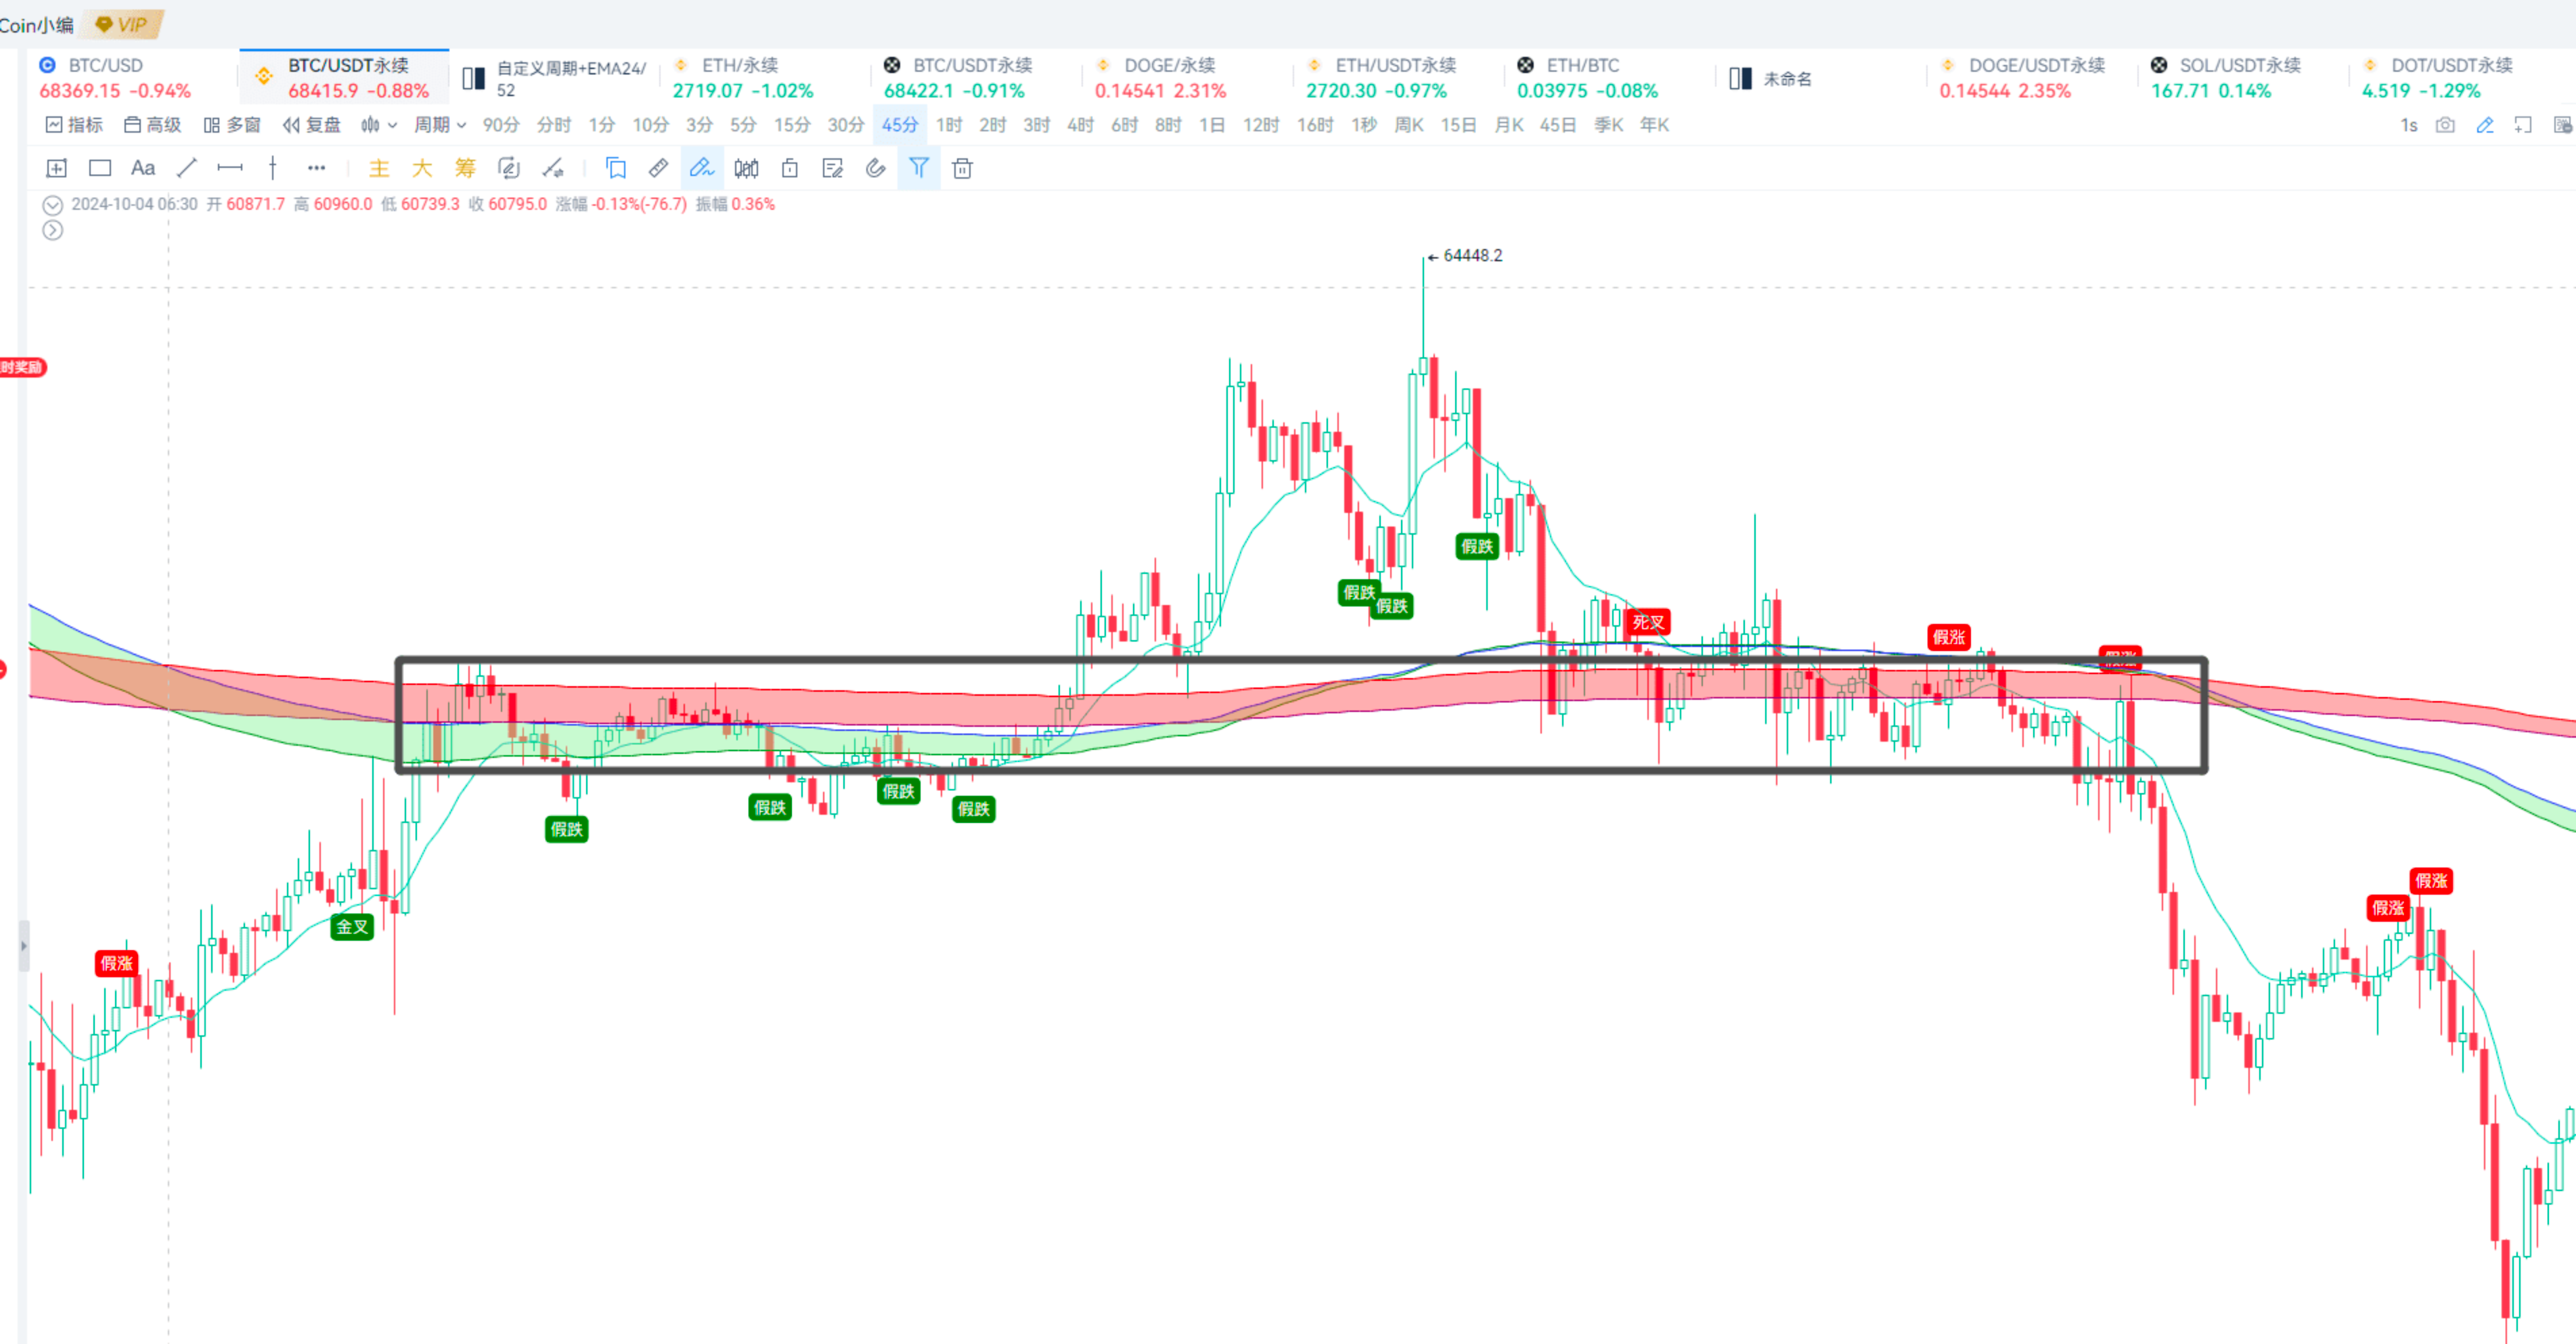
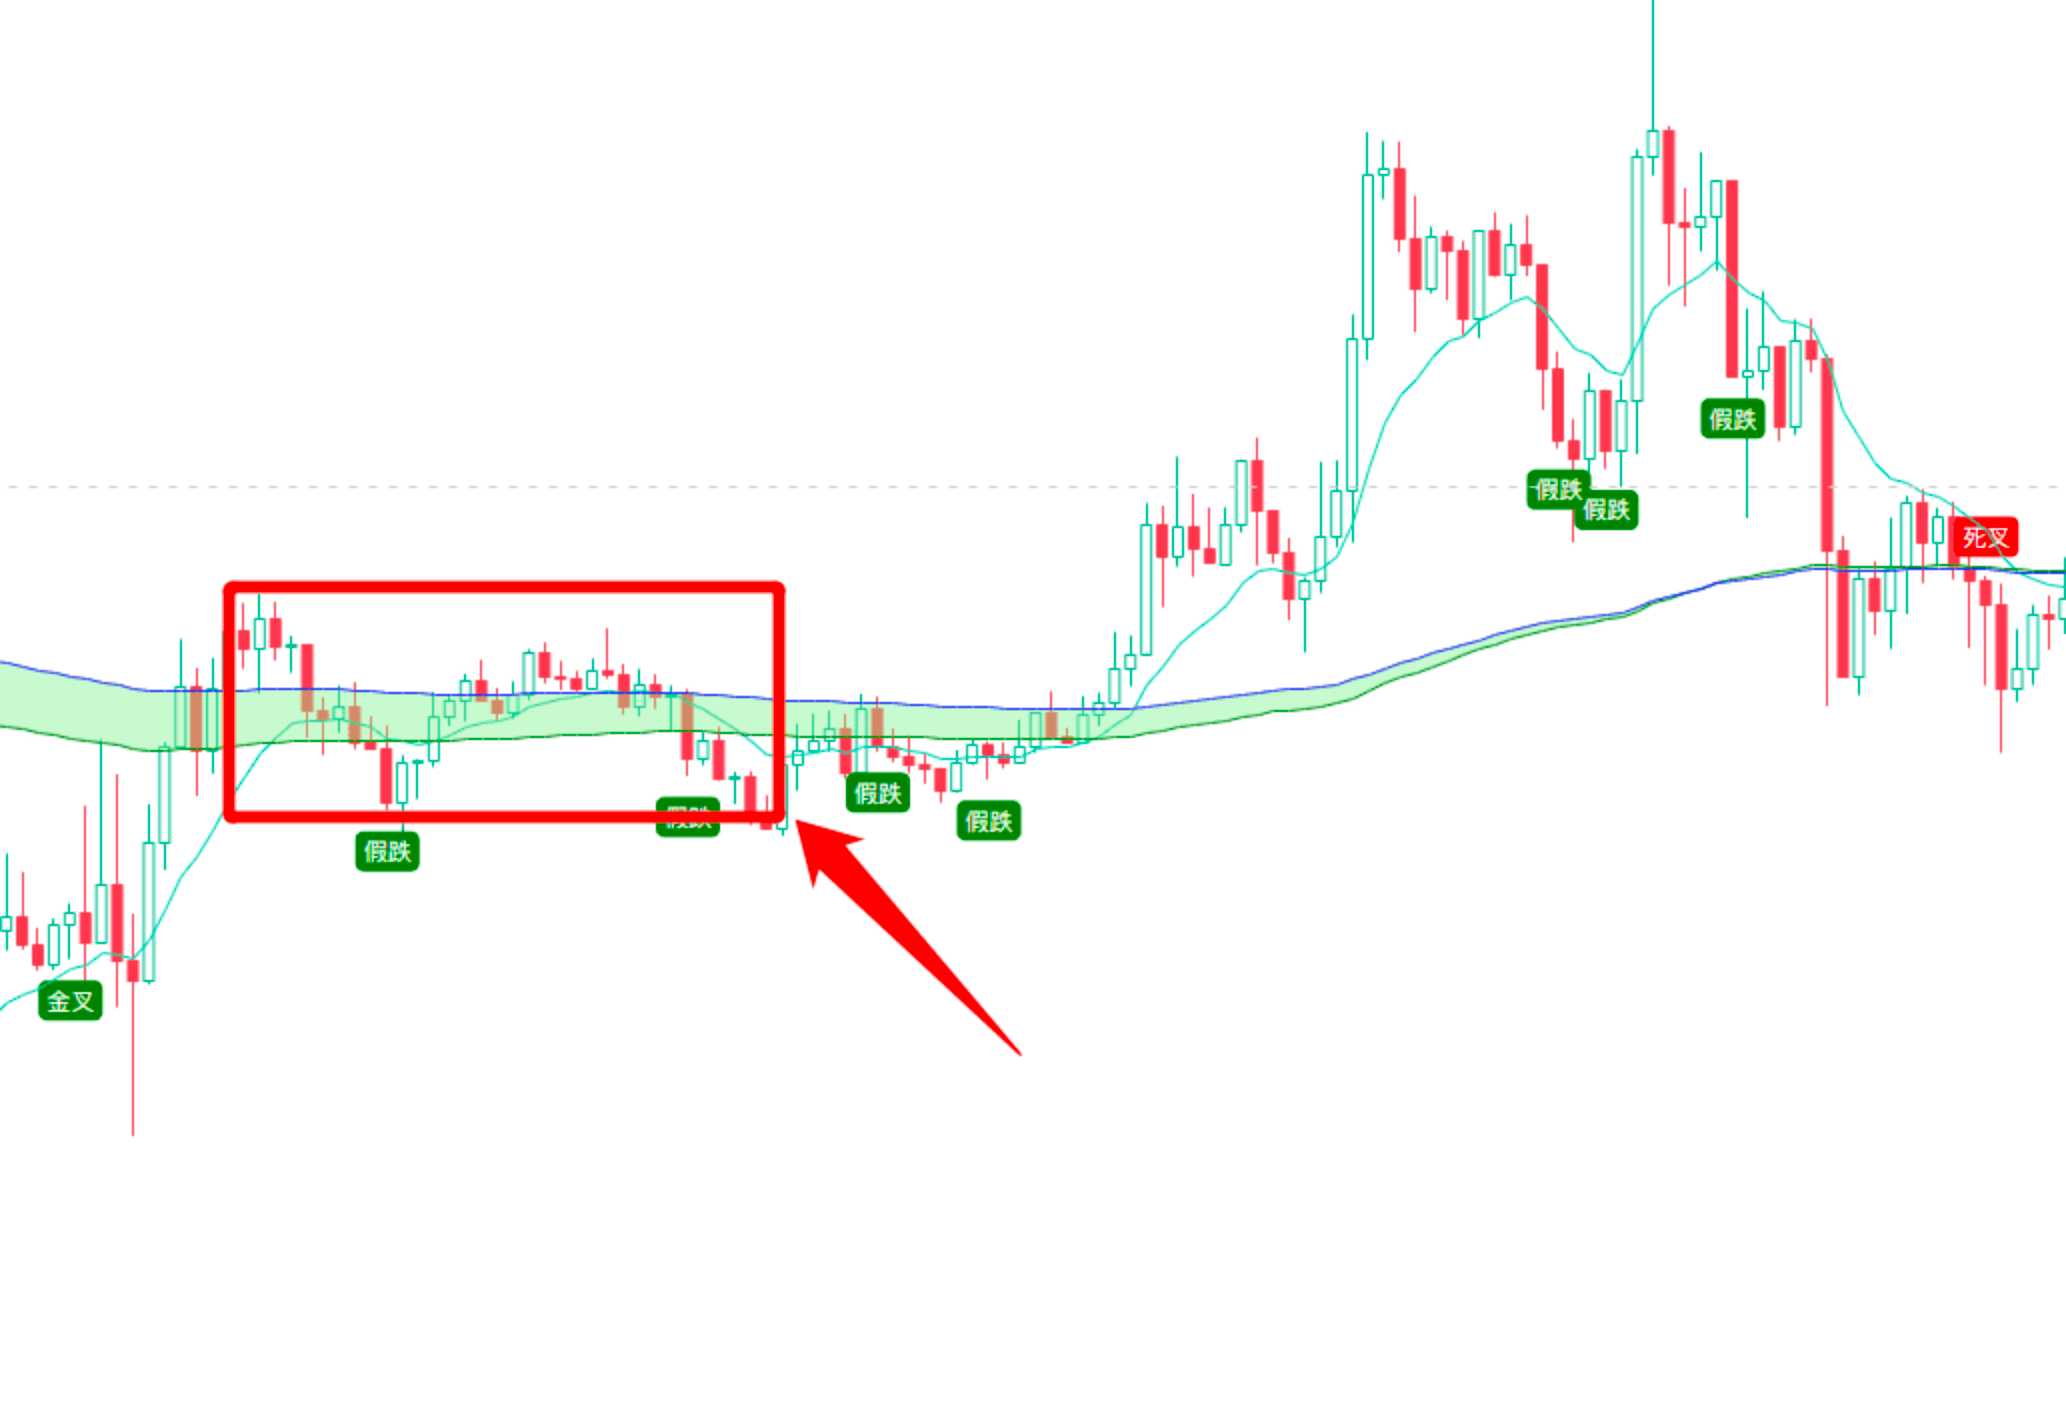
Method 3: Multi-Cycle + EMA Moving Averages
This mainly helps to identify false breakouts/breakdowns.
Using an example from a previous news update I shared, everyone can understand:
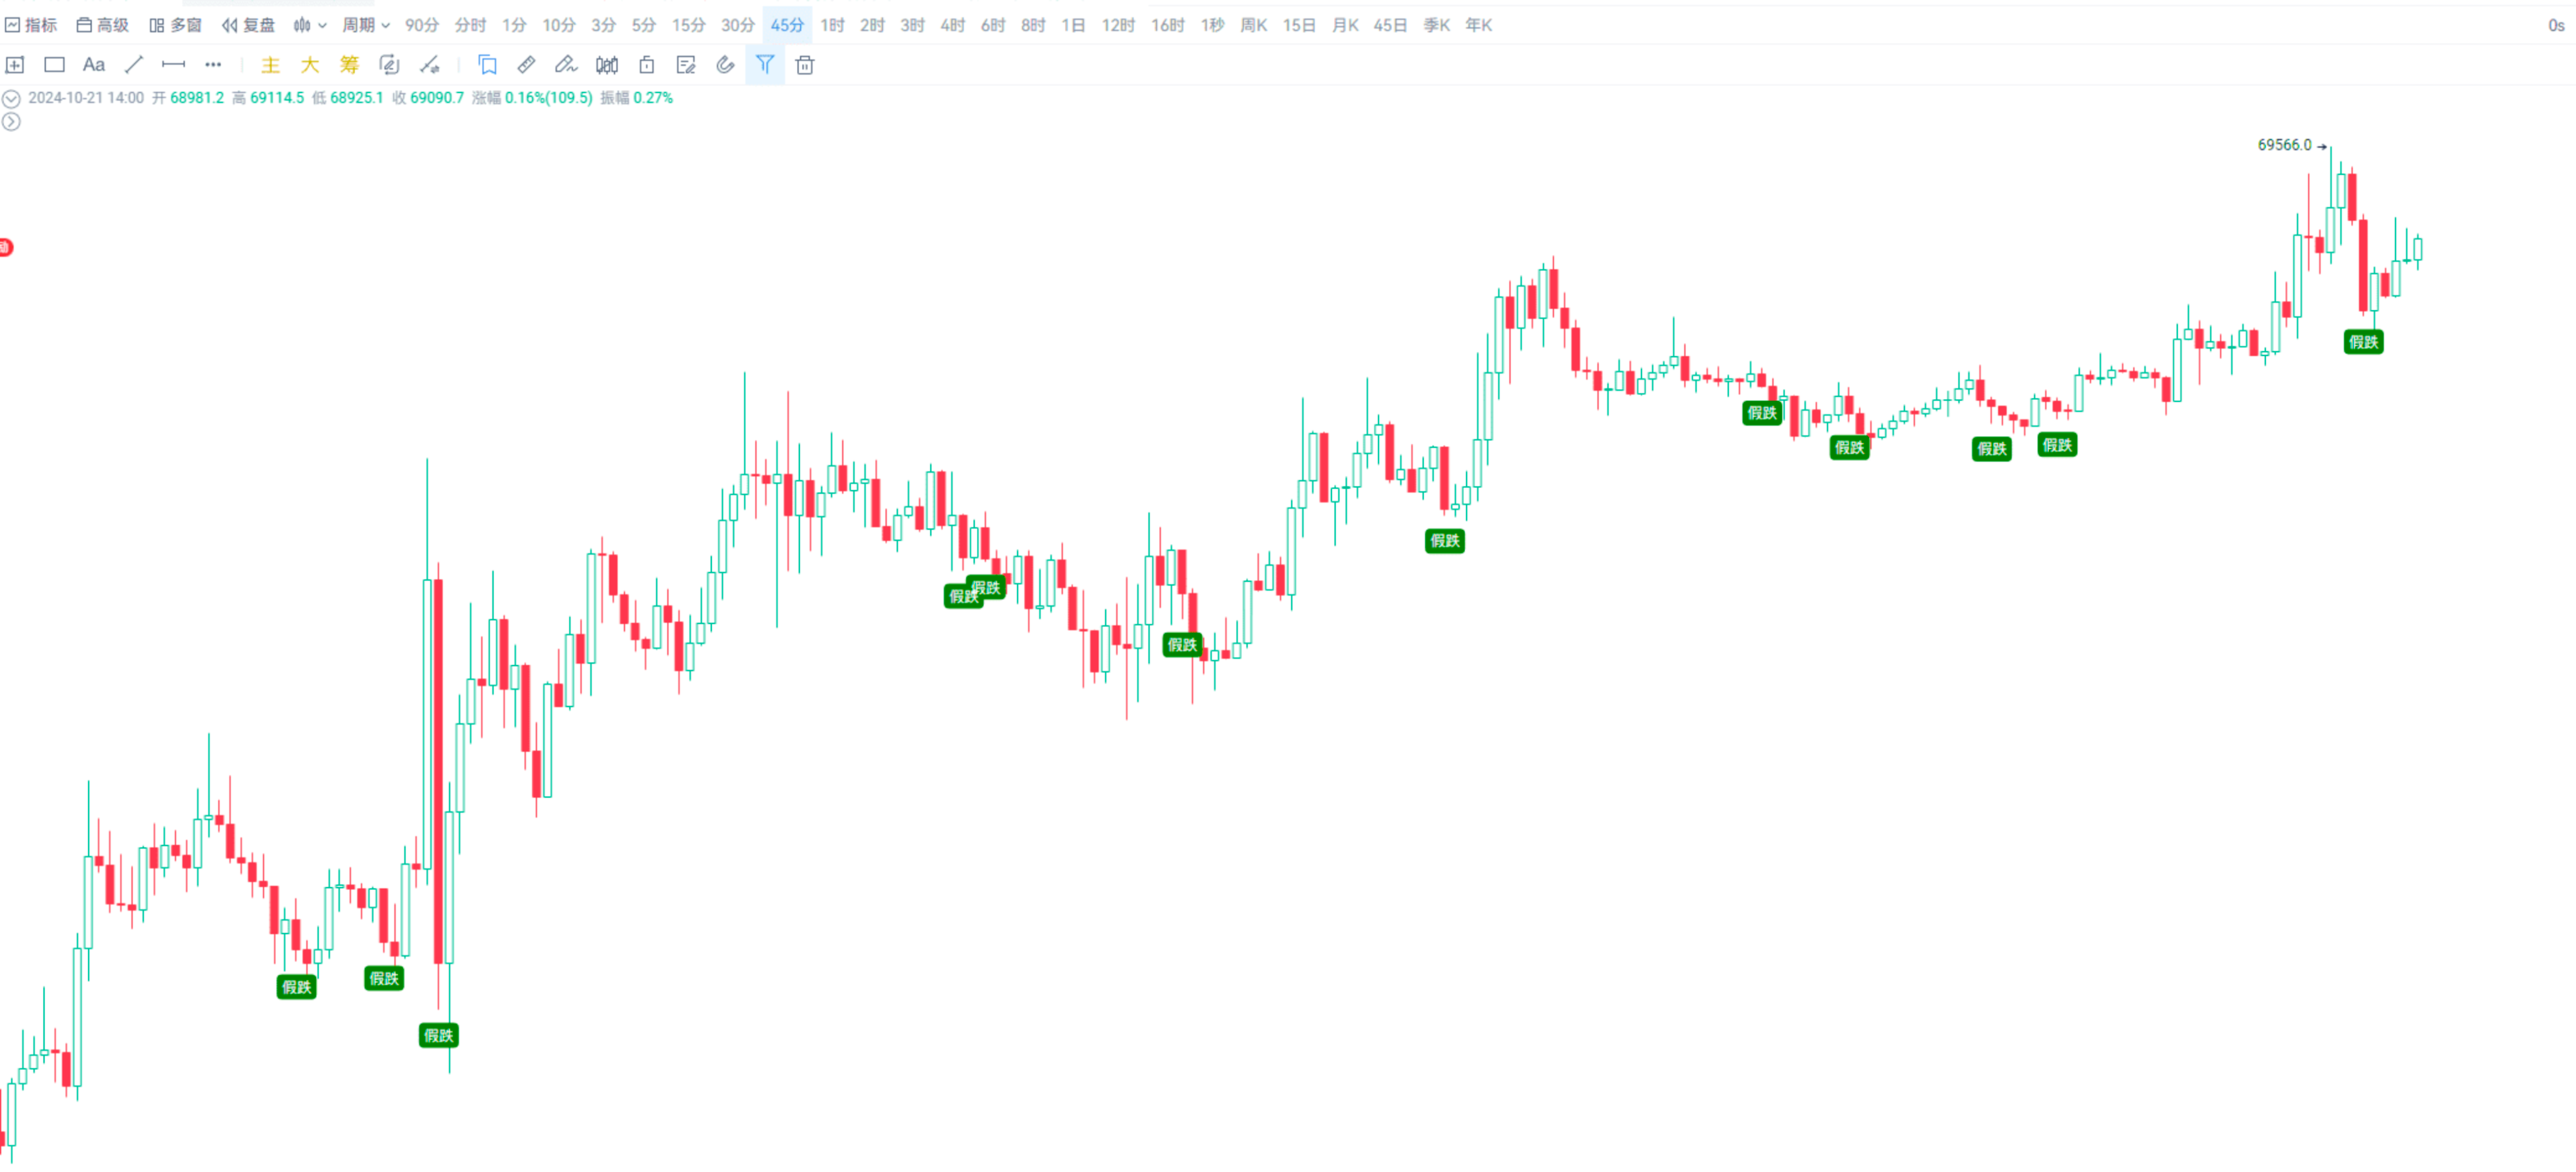
- False breakout: The 45-minute cycle crosses above the moving average, but fails to break above the moving average in the 90-minute cycle.
On October 10 at 18:30, BTC crossed above EMA24 in the 45-minute cycle, but in the 90-minute cycle, BTC closed below EMA24, indicating a false breakout, followed by a 3.5% pullback.
- False breakdown: The 45-minute cycle crosses below the moving average, but receives support from the moving average in the 90-minute cycle.
On October 13 at 22:15, BTC crossed below EMA52 in the 45-minute cycle, but in the 90-minute cycle, BTC received support at EMA52, indicating a false breakdown, followed by a 9.7% rise.
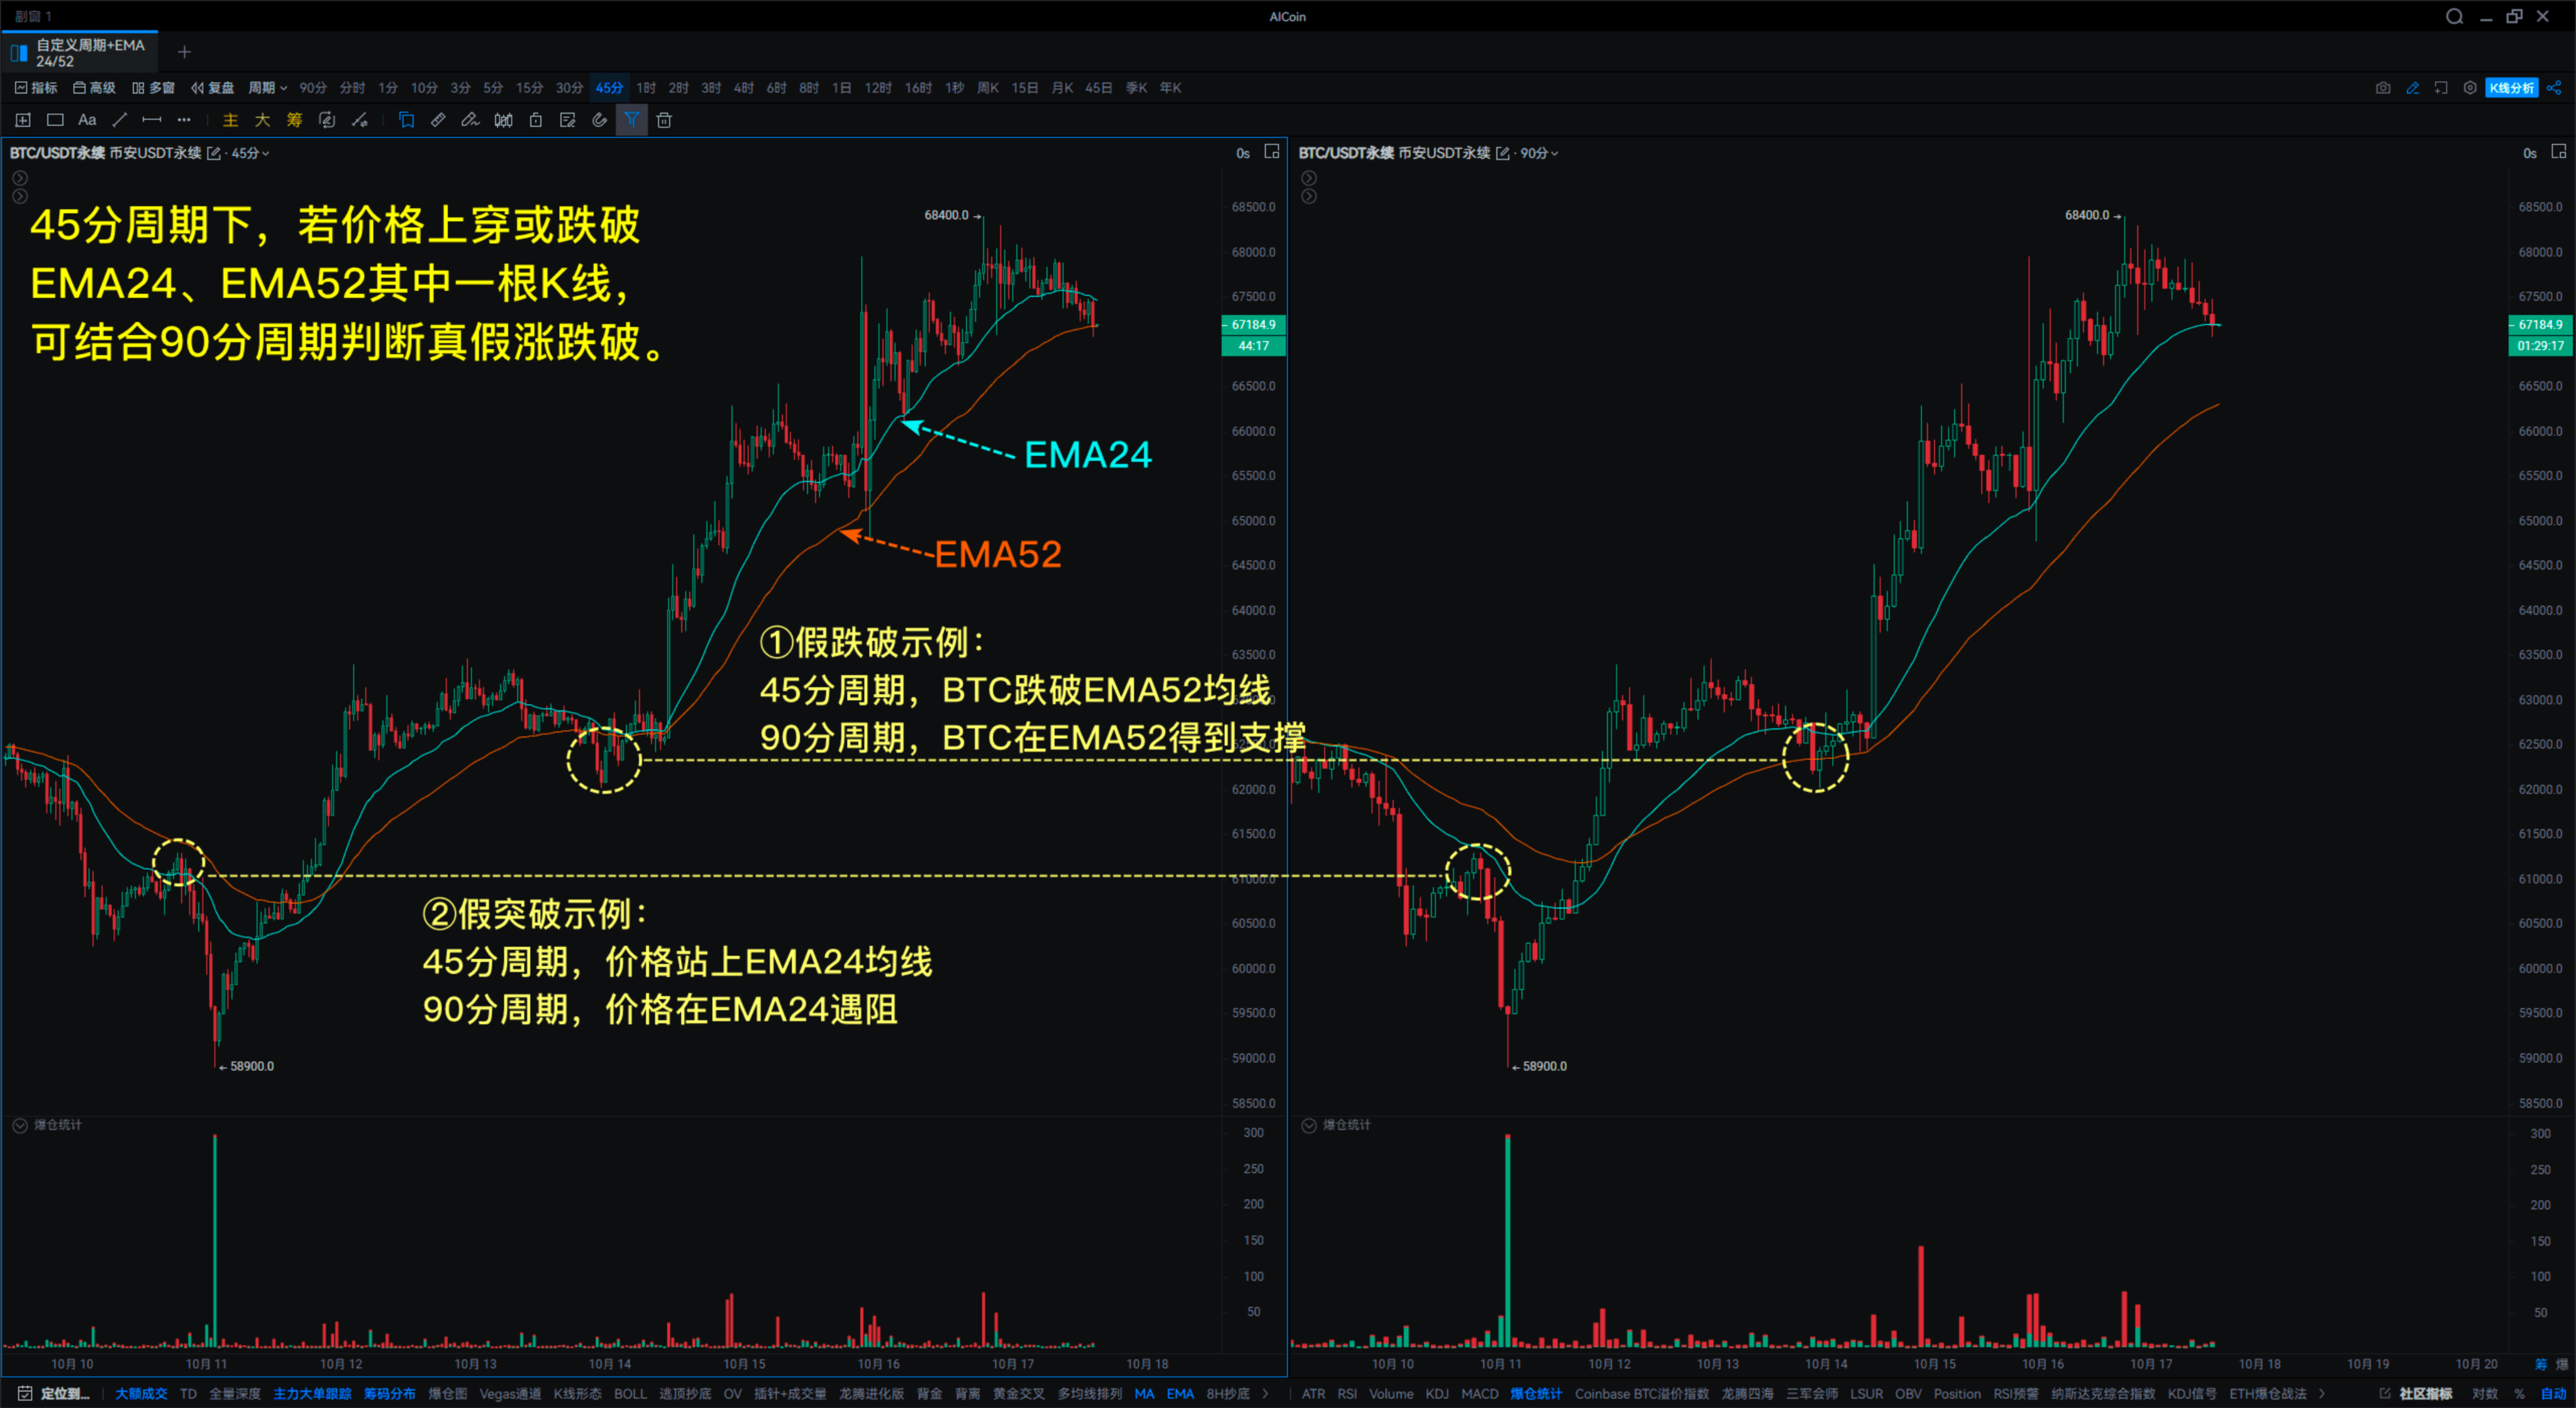
This method can also be applied to other cycles, using smaller and larger cycles, for example, using a 30-minute cycle with a larger cycle of 1 hour.
Additionally, this method can also be implemented using a custom indicator.
As shown in the screenshot, the text "False Breakdown" indicates the situation where the candlestick crosses below the moving average in a smaller cycle but receives support in a larger cycle.
It is also available for subscription: AICoin - Leading Data Market and Smart Tools Platform can provide alerts.
【Note: The above strategies are for reference only and do not constitute any investment advice!】
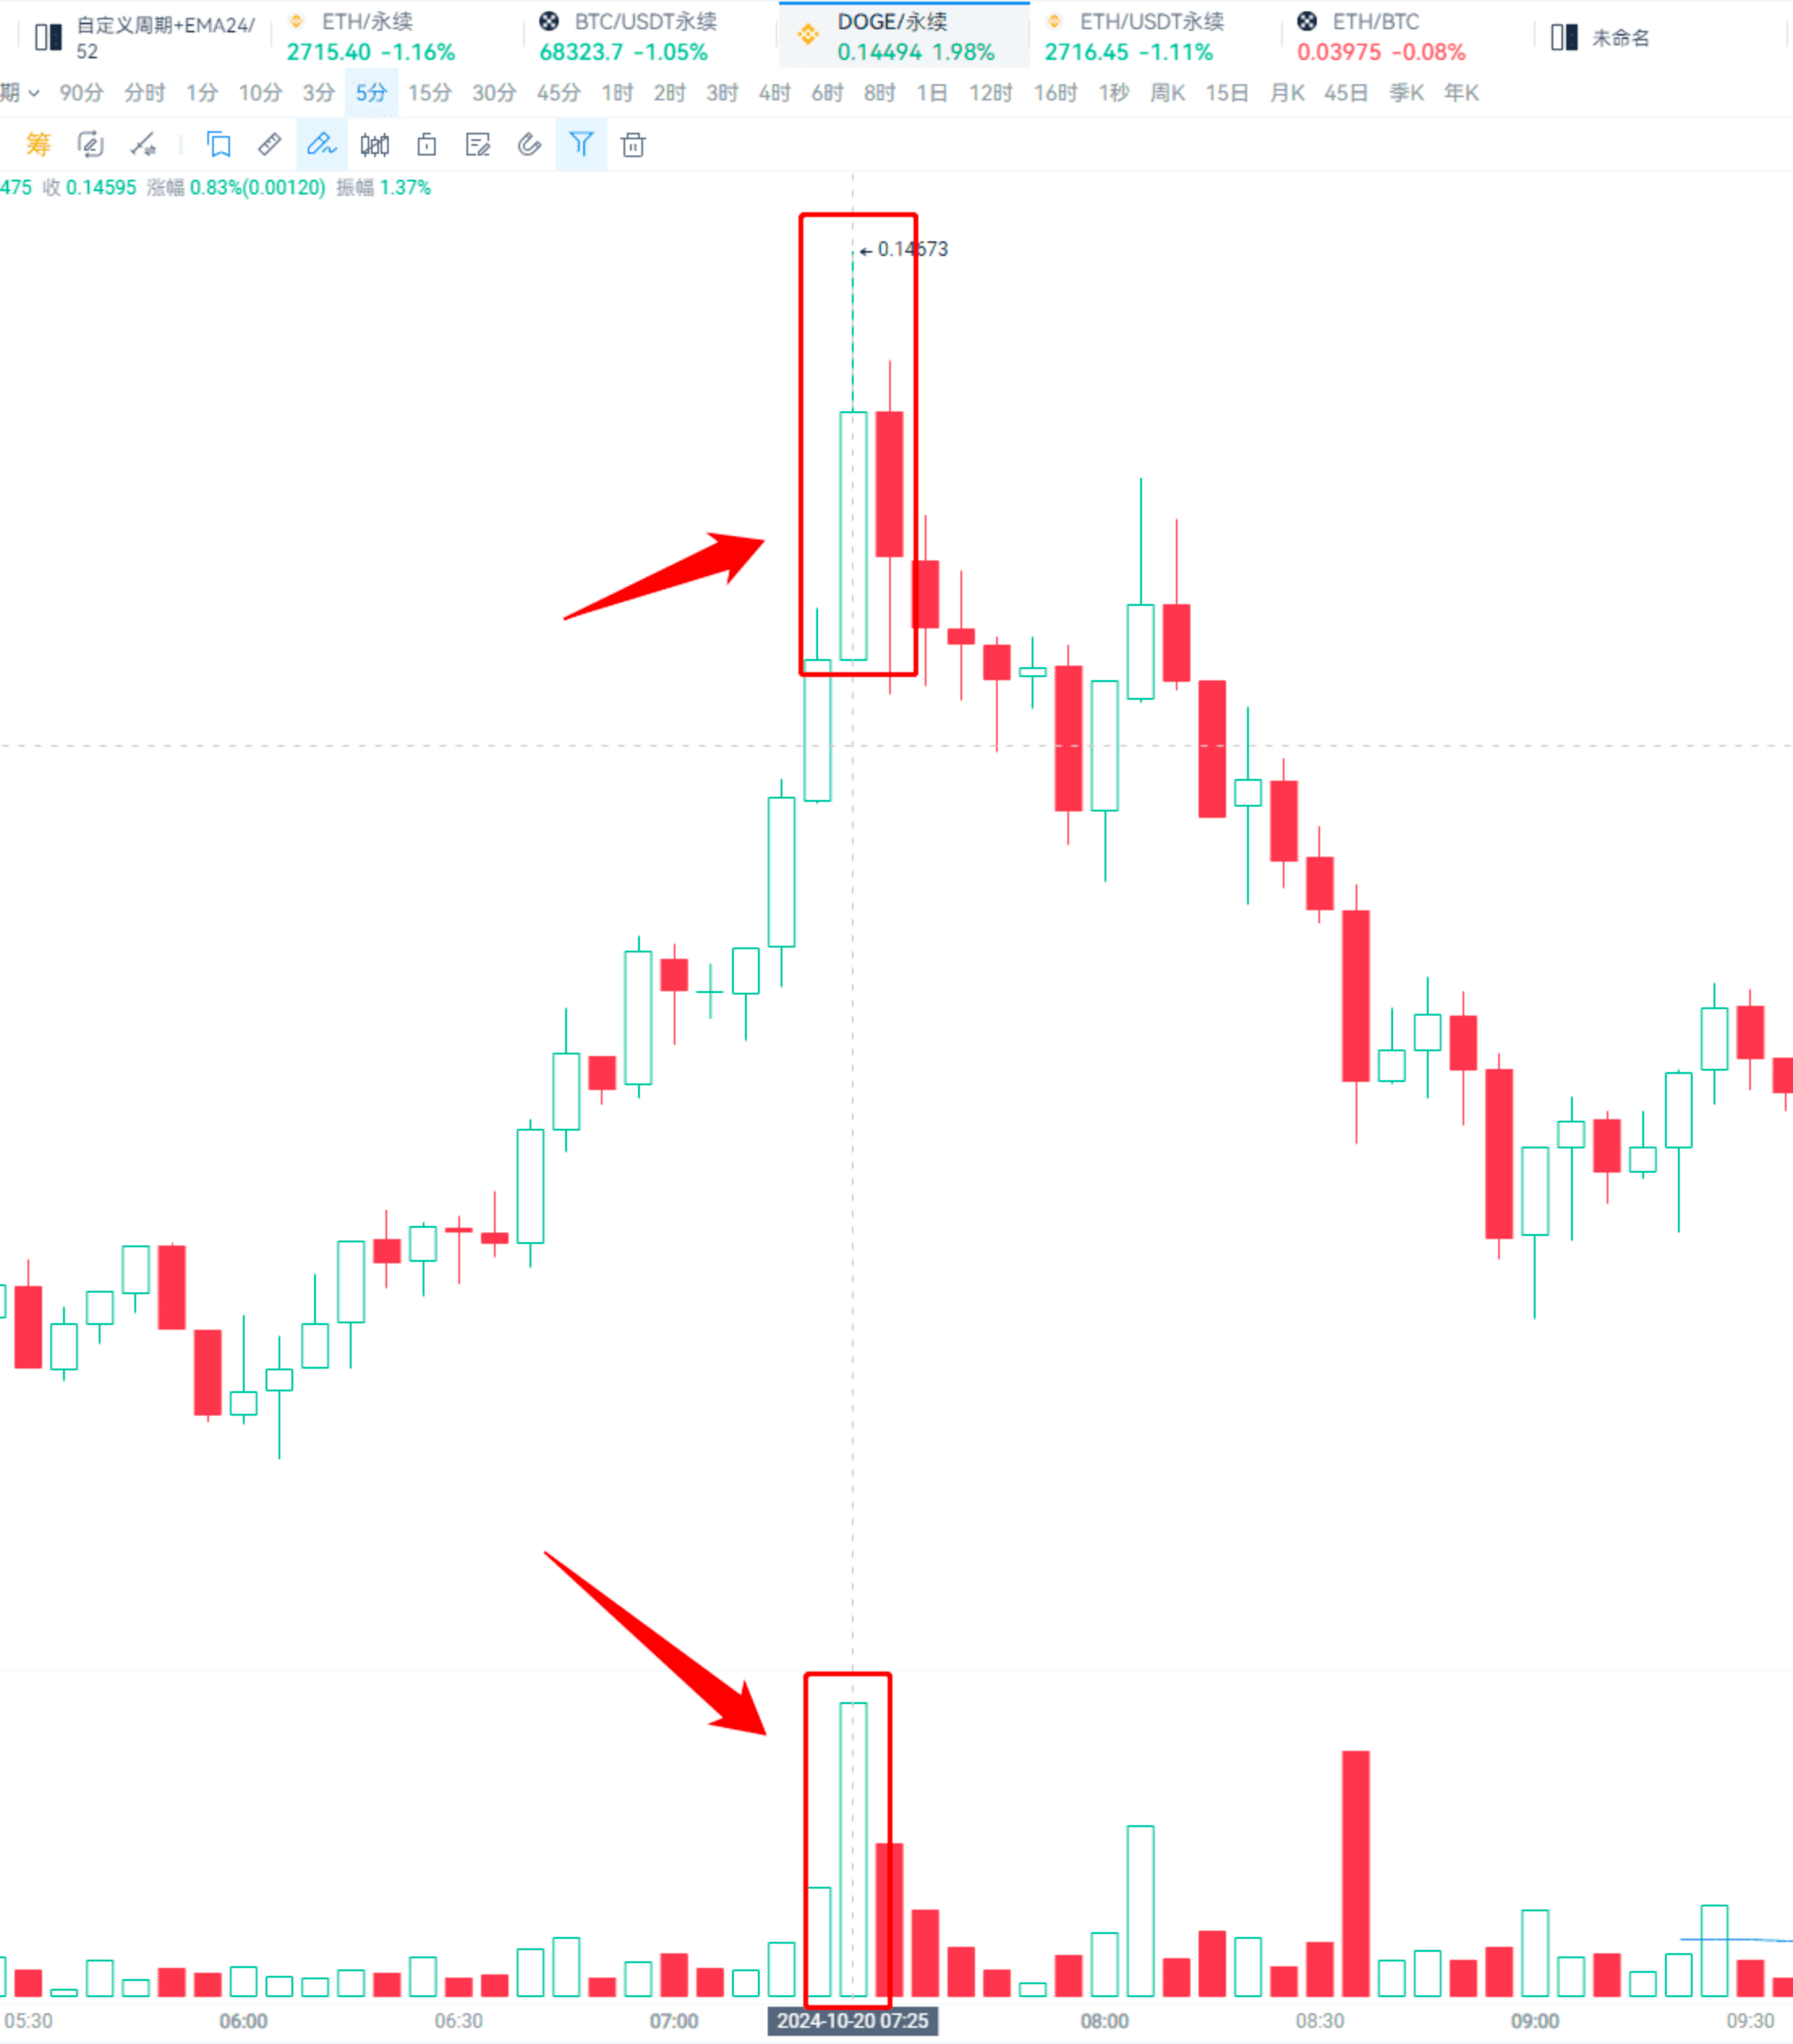
Method 4: Pin Bar + Volume (Threshold can be customized)
Taking BTC as an example,
● Prerequisite: Amplitude: ≥0.5%
● Volume: Doubled compared to the previous value
● Pin Bar: The shadow is more than twice the body.
【This can also be implemented using a custom indicator; the previous volume and threshold can be customized.】
This can also be adjusted based on different trading pairs.
A false breakdown is an ineffective rise.
Another point mentioned is the Vegas Channel.
The channel area can be seen as a support and resistance zone. When the price enters the channel area, do not operate; wait for a breakout or breakdown before positioning.
Additionally, there is a moving average in the indicator, which is EMA12. This moving average is used to identify true and false breakouts, in conjunction with the green channel.
For example, in the screenshot, it has never crossed above the channel, indicating a false breakout. The red line represents the long-term trend channel, and the moving average has never crossed above the channel.
This concludes the entire content of this sharing.
Thank you for watching. We hope every AICoin user can find suitable indicator strategies and achieve financial success!
Recommended Reading
Approaching New Highs: How to Skillfully Utilize Resonance Signals - AICoin https://www.aicoin.com/article/424440.html
Moving Average Game: The Transformation from Candlesticks to Wealth - AICoin https://www.aicoin.com/article/424416.html
Automatic Bottom Fishing, Achievable with a TD Indicator - AICoin https://www.aicoin.com/article/424409.html
For more live content, please follow the AICoin "AICoin - Leading Data Market and Smart Tools Platform" section, and feel free to download AICoin - Leading Data Market and Smart Tools Platform.
免责声明:本文章仅代表作者个人观点,不代表本平台的立场和观点。本文章仅供信息分享,不构成对任何人的任何投资建议。用户与作者之间的任何争议,与本平台无关。如网页中刊载的文章或图片涉及侵权,请提供相关的权利证明和身份证明发送邮件到support@aicoin.com,本平台相关工作人员将会进行核查。