Charts
DataOn-chain
VIP
Market Cap
API
Rankings
CoinOSNew
CoinClaw🦞
Language
  • 简体中文
  • 繁体中文
  • English
Leader in global market data applications, committed to providing valuable information more efficiently.

Features

  • Real-time Data
  • Special Features
  • AI Grid

Services

  • News
  • Open Data(API)
  • Institutional Services

Downloads

  • Desktop
  • Android
  • iOS

Contact Us

  • Chat Room
  • Business Email
  • Official Email
  • Official Verification

Join Community

  • Telegram
  • Twitter
  • Discord

© Copyright 2013-2026. All rights reserved.

简体繁體English
|Legacy

On 24/10/13, BTC weekly line fell through but recovered, daily line is under pressure from the downtrend line, and it confirmed the support at 61600 after a pullback.

CN
交易公子扶苏
Follow
1 year ago
AI summarizes in 5 seconds.

The Federal Reserve's interest rate cut in November remains a high probability event. The U.S. September CPI data did not significantly impact rate cut expectations, and this week's unemployment claims data exceeded market expectations (hurricane) which may be a contributing factor. Given the Fed's current focus on employment far outweighs inflation, a 25 basis point cut in November remains the baseline assumption, but attention should be paid to the possibility of rate cuts next year not meeting expectations.

According to EmberCN monitoring, Ethereum co-founder Vitalik sold 6 types of MEME tokens 10 hours ago, and in the past 2 hours, he sold another 8 types of MEME tokens, exchanging them for 651.4 ETH (approximately $1.61 million).

SUI broke through $2.19, reaching a new all-time high, with a market cap surpassing NEAR, and its cryptocurrency market cap ranking rising to 22nd place. Technically, it is possible for it to rise to $3 or even $4 without falling back to $2.19.

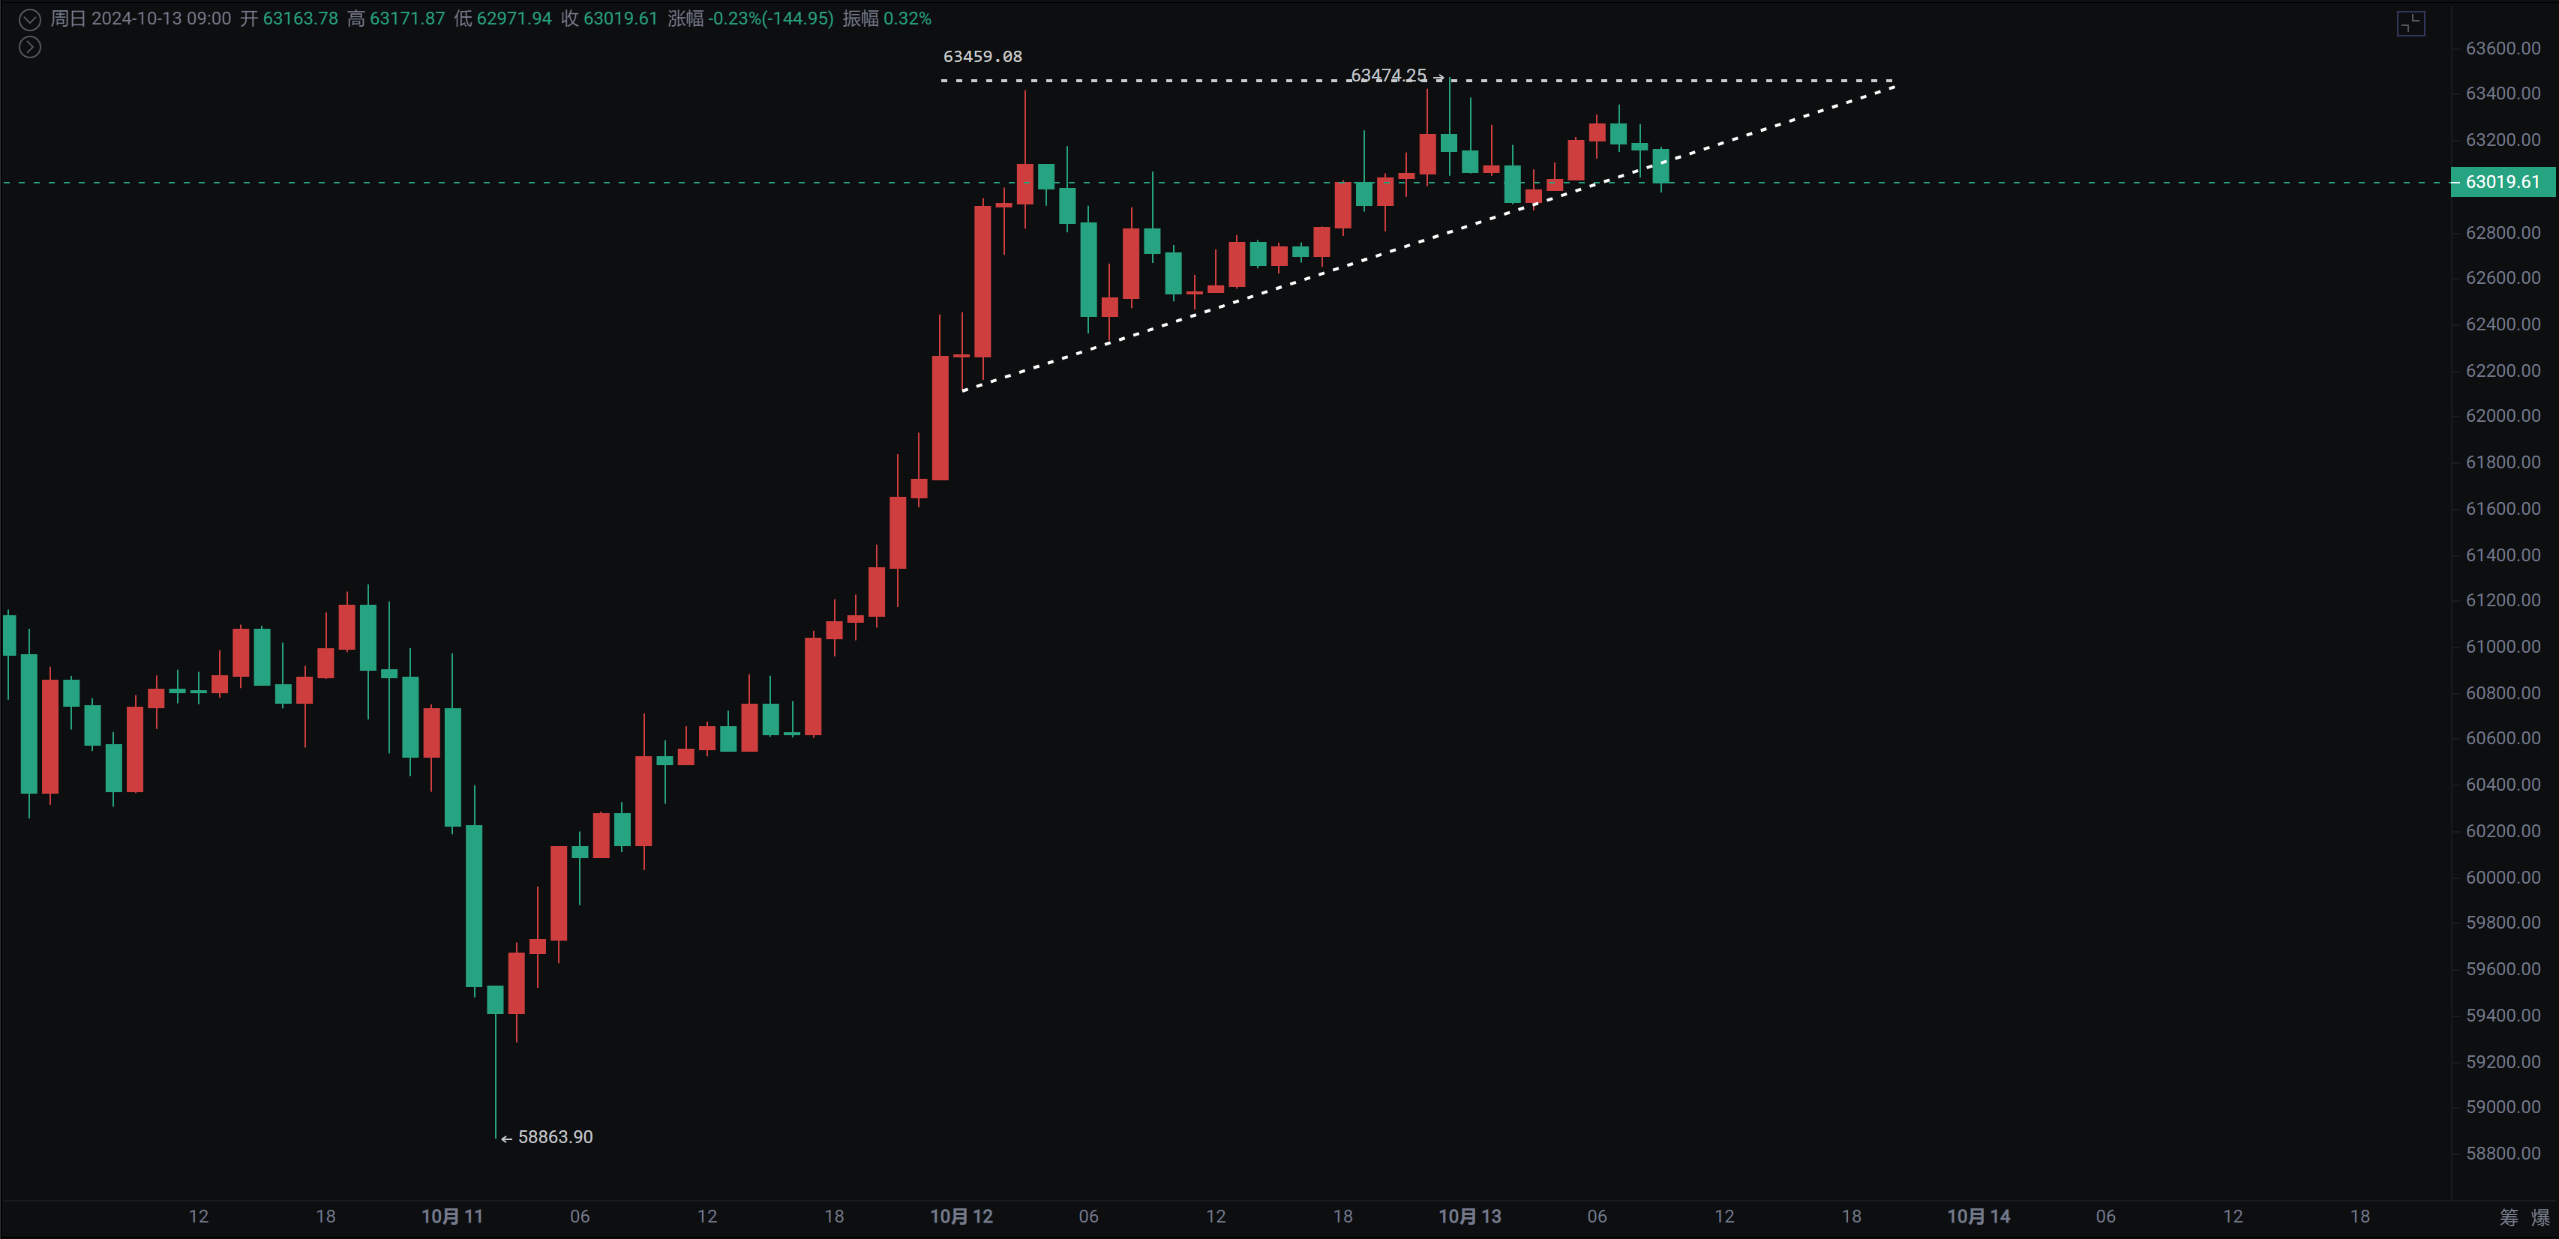
Bitcoin's weekly chart has not yet formed a definitive pattern, but last week it broke below the BOLL middle band along with a candlestick engulfing pattern. This week, it rebounded near $60,000 and regained its position. Both the MACD and OBV indicators show the possibility of a weekly-level rebound.

The short-term ascending triangle on the 1-hour chart has broken down, with the MACD remaining below the zero line since its pullback from 63459 yesterday. The RSI indicator shows a top divergence, and a pullback to 61600 should be considered for rebound opportunities.

Support: Resistance:

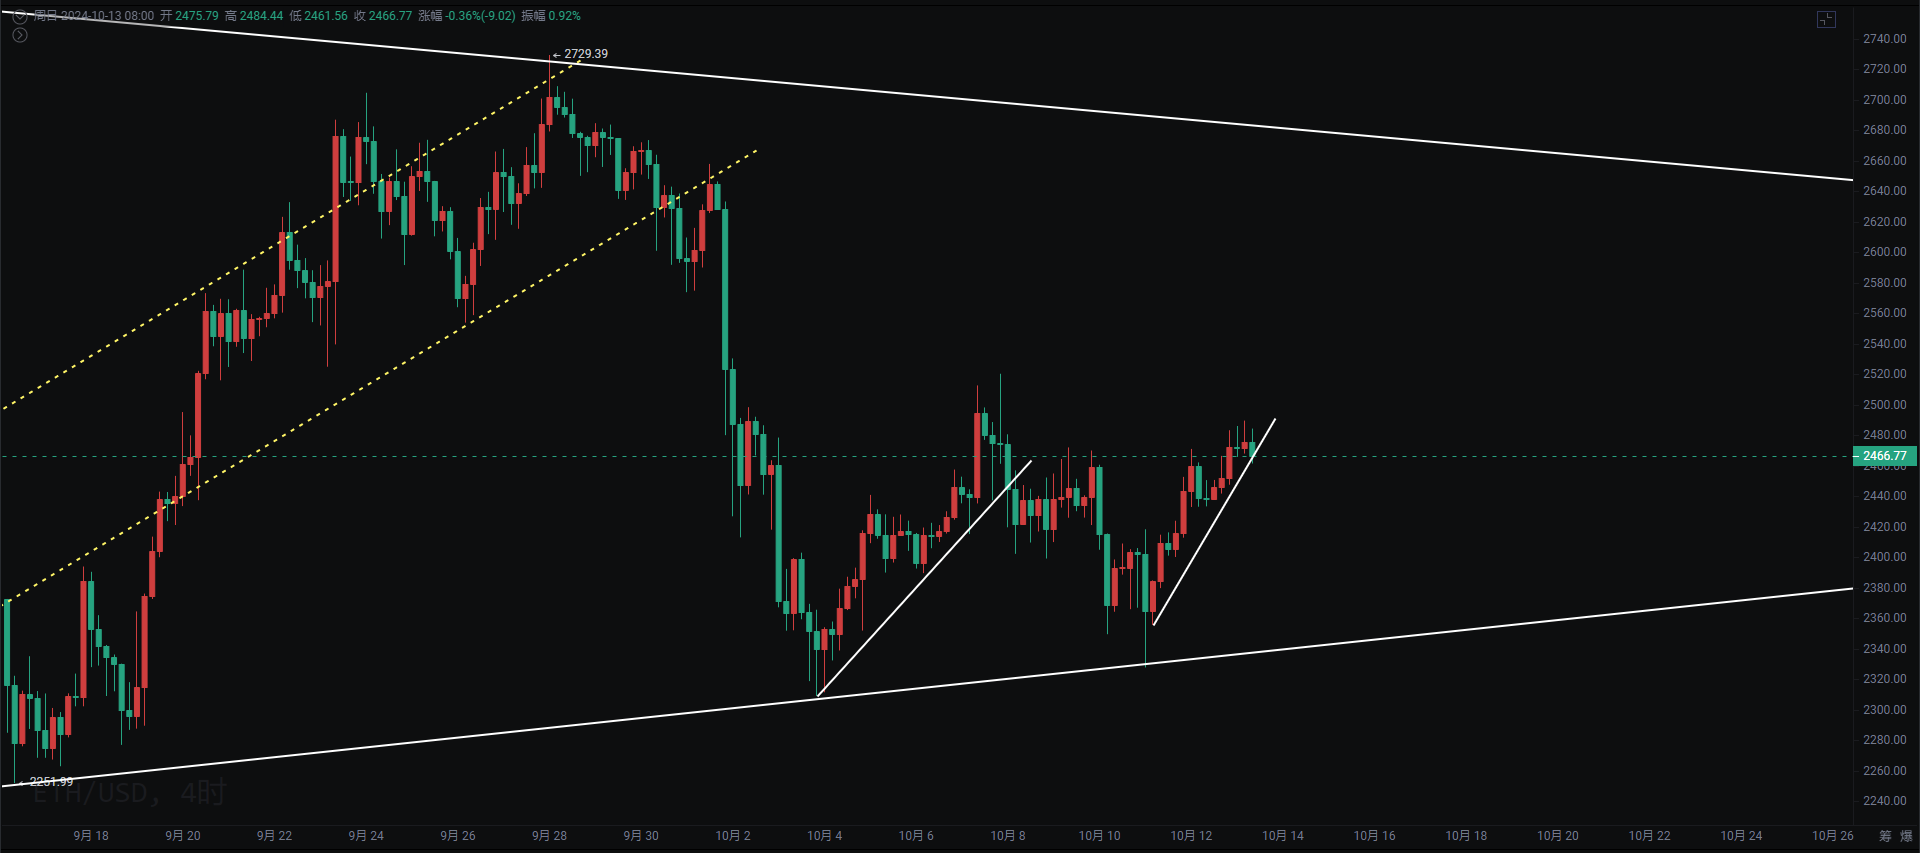
Ethereum's daily and 4-hour charts have shown breakthroughs, but the 1-hour chart shows a top divergence while also being under pressure near previous resistance. Waiting for a pullback to 2400 to confirm a rebound opportunity. The ETH/BTC exchange rate has seen a compensatory rise, but the momentum is not strong, and weekend trading volume is average.

Support: Resistance:

If you like my views, please like, comment, and share. Let's navigate through the bull and bear markets together!!!

The article is time-sensitive and for reference only, updated in real-time.

Focusing on candlestick technical research, sharing global investment opportunities. Public account: Trading Prince Fusu

免责声明:本文章仅代表作者个人观点,不代表本平台的立场和观点。本文章仅供信息分享,不构成对任何人的任何投资建议。用户与作者之间的任何争议,与本平台无关。如网页中刊载的文章或图片涉及侵权,请提供相关的权利证明和身份证明发送邮件到support@aicoin.com,本平台相关工作人员将会进行核查。

原油暴动!Bybit注册100倍杠杆爆赚
广告
|
|
APP
Windows
Mac
Share To

X

Telegram

Facebook

Reddit

CopyLink

|
|
APP
Windows
Mac
Share To

X

Telegram

Facebook

Reddit

CopyLink

Selected Articles by 交易公子扶苏

9 days ago
On March 26, 2017, both Bitcoin and Ethereum broke through, be cautious not to fall back down, the risk for gold in the US has increased.
13 days ago
March 26, 2013 BTC weekly chart shows a bottom divergence, about to face an upward breakout. How to seize the opportunity next?
1 month ago
On February 26, 2009, BTC dropped sharply to 60,000, while the US stock market fluctuated at a high level for 4 months, with retail investors gritting their teeth to survive first.
View More

Table of Contents

|
|
APP
Windows
Mac
Share To

X

Telegram

Facebook

Reddit

CopyLink

Related Articles

avatar
avatar币圈院士
46 minutes ago
Crypto Circle Academician: Ethereum 2180 on March 27, going south to cash out! How to accurately catch this wave of shorts? Latest market analysis and thought references.
avatar
avatar币圈院士
47 minutes ago
Cryptocurrency Academy: On March 27, Bitcoin has dropped again! Those who chased the high are crying, while those who shorted are laughing! The next target level is already clear! Latest market analysis and strategy reference.
avatar
avatar币圈红姐
2 hours ago
Cryptocurrency Market Red Sister 3.27: Bitcoin's short-term bearish momentum is strong! The daily chart turns into a death cross, can it defend below 68100? Today's Bitcoin (BTC) latest market analysis and trading advice.
avatar
avatar币圈丽盈
3 hours ago
Coin Circle Li Ying: Has the battle to defend the 2000 mark of Ethereum started on March 27? What to do if your positions are trapped? Latest market analysis and operation suggestions.
avatar
avatar币圈丽盈
3 hours ago
Crypto Circle Liying: On March 27, Bitcoin fell below the 70,000 mark. Is it a fakeout or a real crash? Latest market analysis and trading recommendations.
APP
Windows
Mac

X

Telegram

Facebook

Reddit

CopyLink