Script Editor
The script editor is where you write and debug AIScript code. While you can write code in any text editor, this editor offers some special features:
- It highlights AIScript syntax, making it easier for you to read the code.
- Relevant tips will be displayed when you hover over certain code.
- The process of writing, compiling, and running code is very convenient; when you save the code, the script will immediately update on the chart.
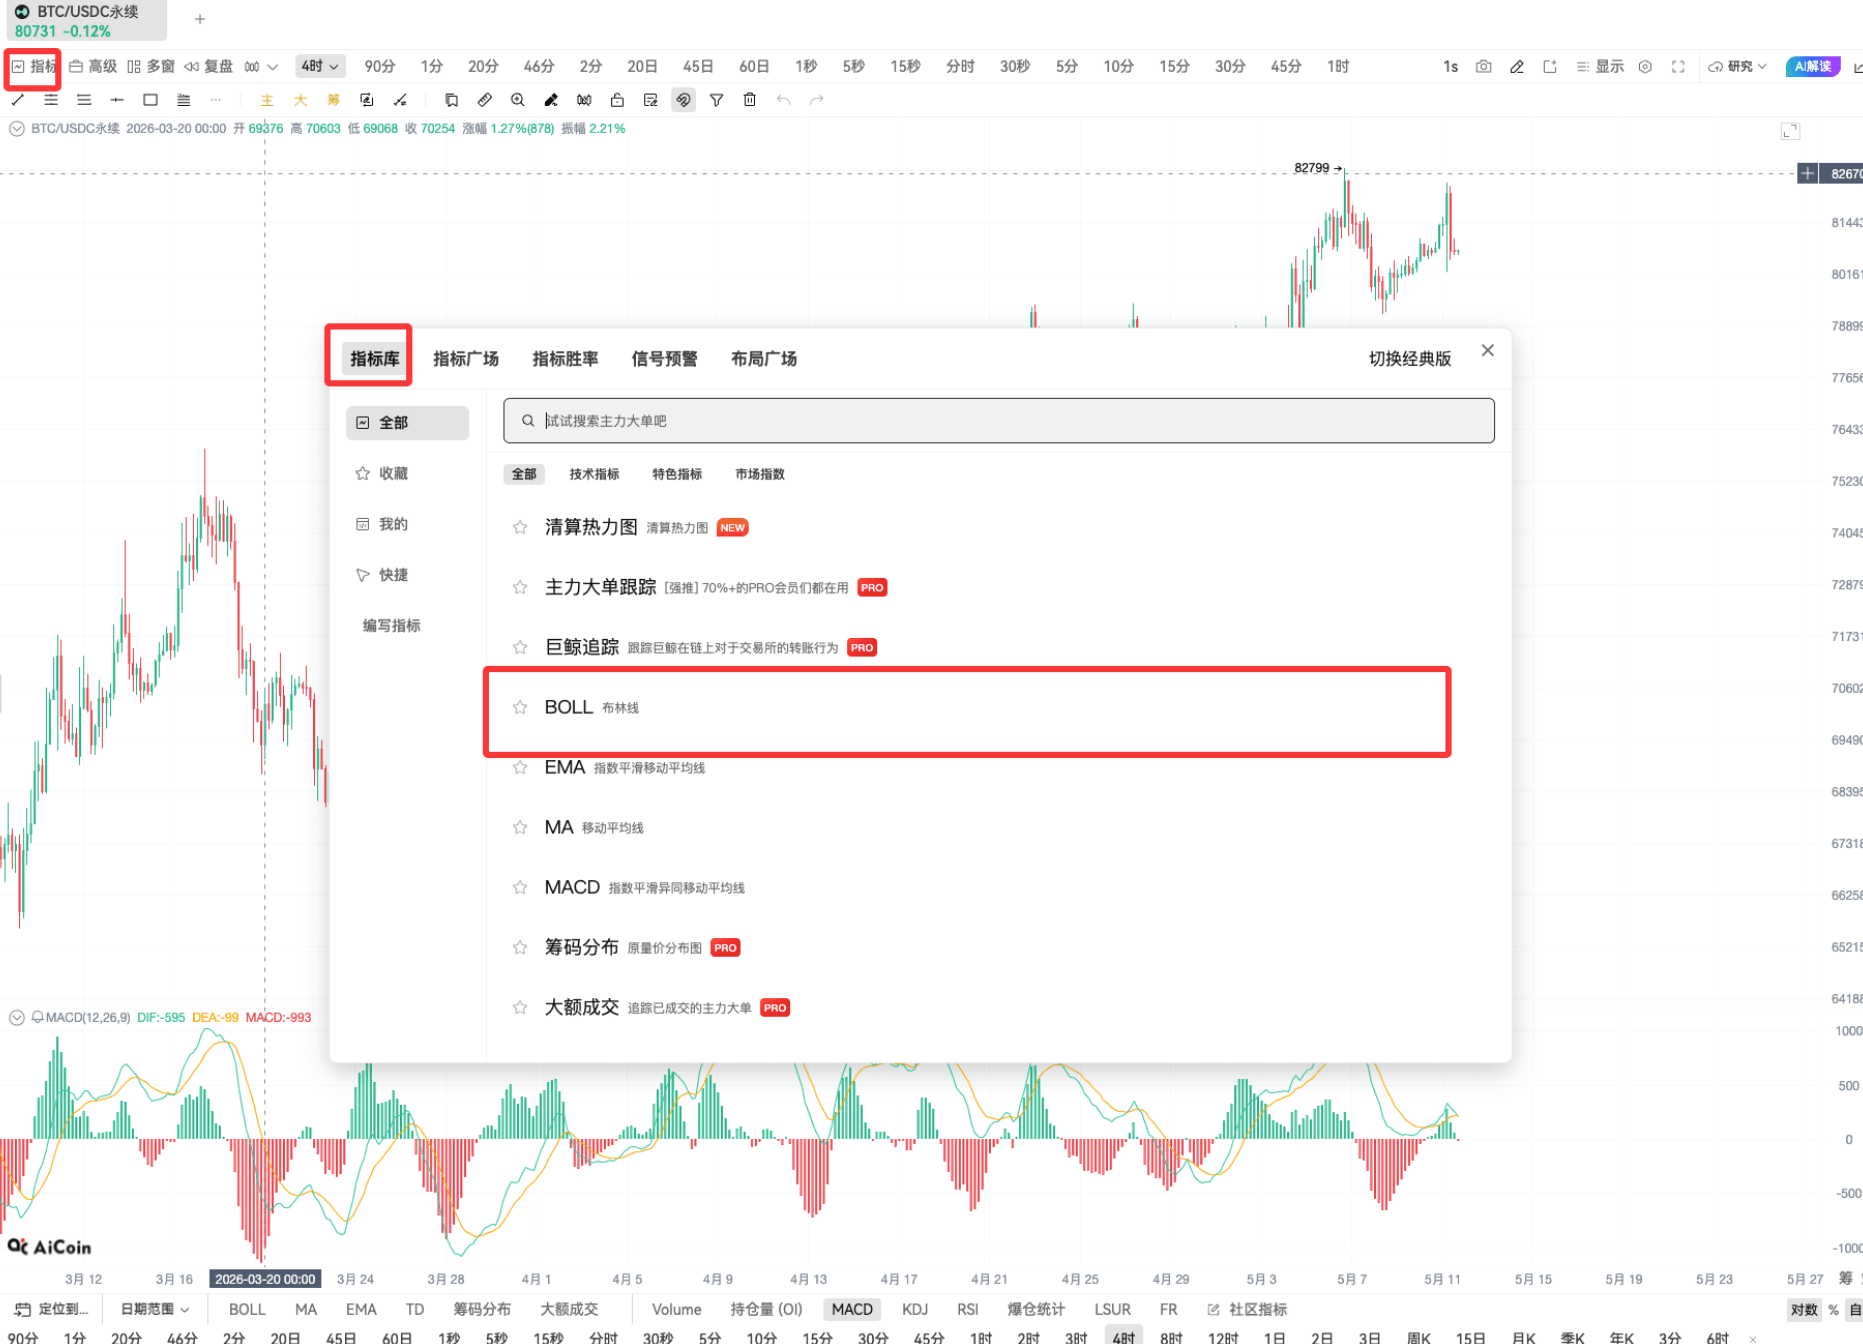
To open the script editor, click on the "Custom Indicators/Live/Backtest" option at the bottom of the page. This will open a script editing window.

Your First Custom Indicator
Next, we will create a simple AIScript indicator. This indicator will simulate a simple moving average:
// @version=2
length = 14
maVal = ma(close, length)
plot(maVal, color = 'green')
- First, click the "New" menu in the upper right corner of the editor.
- Copy the example code above.
- Select all the default code displayed in the editor and replace it with the example code.
- Click the "Save" button and give your script a name. Your script is now saved in the cloud and is only visible to you.
- Click the "Add to Chart" button. You will see a green simple moving average on the chart.
Your first custom AIScript indicator is now running on the chart. Each line of code is explained as follows:
Line 1: // @version=2
This is a comment used to indicate to the compiler that this script uses version 2 of AIScript.
Line 2: length = 14
Defines a variable length, representing the time period for the moving average.
Line 3: maVal = ma(close, length)
Calculates the simple moving average (MA) of the closing price.
Line 4: plot(maVal, color = 'green')
Uses the plot function to draw maVal and sets the color to green.
Next, you can visit our Next Steps page to continue learning.
免责声明:本文章仅代表作者个人观点,不代表本平台的立场和观点。本文章仅供信息分享,不构成对任何人的任何投资建议。用户与作者之间的任何争议,与本平台无关。如网页中刊载的文章或图片涉及侵权,请提供相关的权利证明和身份证明发送邮件到support@aicoin.com,本平台相关工作人员将会进行核查。