Infrastructure seems to be an eternal topic in Crypto.
While infrastructure may not directly face users like applications such as DeFi, it consistently gains support from top institutions behind the scenes. From Crypto Natives to Old Money, starting a business based on infrastructure seems to have become a "stable" venture. The track is stable, the model is replicable, and one can simply collect rent, ensuring profits without losses. Technological idealists and resource tycoons seem reluctant to engage in the high-risk game of Mass Adoption, leading to an increasing number of high FDV projects emerging like factory copies.
Ultimately, the dreams of speculators for hundredfold returns and the valuation bubbles of projects are ruthlessly punctured by the market. VC coins have overnight become the targets of public disdain, and the endless infrastructure raises the ultimate question for the industry: Do we really need so much infrastructure? With this question in mind, this article selects mainstream projects in the Crypto infrastructure field as representatives to analyze their operational conditions, providing readers with a perspective to judge whether the current market infrastructure should be cleared.
BlockBeats Note: There is no clear regulation in the Crypto market, so project teams differ from traditional listed companies in that they are not obligated to fully disclose their specific performance. The sources of income for project teams include wallet transfers, off-chain income, and token sales, among others. Therefore, this article will primarily reference and evaluate the publicly disclosed on-chain data that can be collected.
Oracles
Oracles can not only be applied in Crypto to provide quotes for various dapps, bridging the information gap between on-chain and off-chain, but they also serve traditional financial products such as bonds and credit default swaps. Meanwhile, in the Crypto space where regulatory compliance has not fully caught up, we cannot obtain complete revenue information audited by third parties through existing channels, and can only analyze data obtained through public on-chain means.
In the oracle sector, TVS (Total Value Secured) is typically used as a key measurement indicator. According to DefiLlama data, Chainlink still maintains its kingly status, holding a 44% market share of total TVS, demonstrating a monopolistic position. The TVS market shares of the other top 5 protocols are WINKlink (15%), Chronicle (13.59%), Pyth (8.95%), and Swithboard (3.88%). However, WNLink and Chronicle are primarily applied within the Tron ecosystem and MakerDAO, respectively, relying on their own "big trees" for shade and lacking widespread market application. Therefore, Chainlink and Pyth are selected as the subjects for analysis in the oracle field.
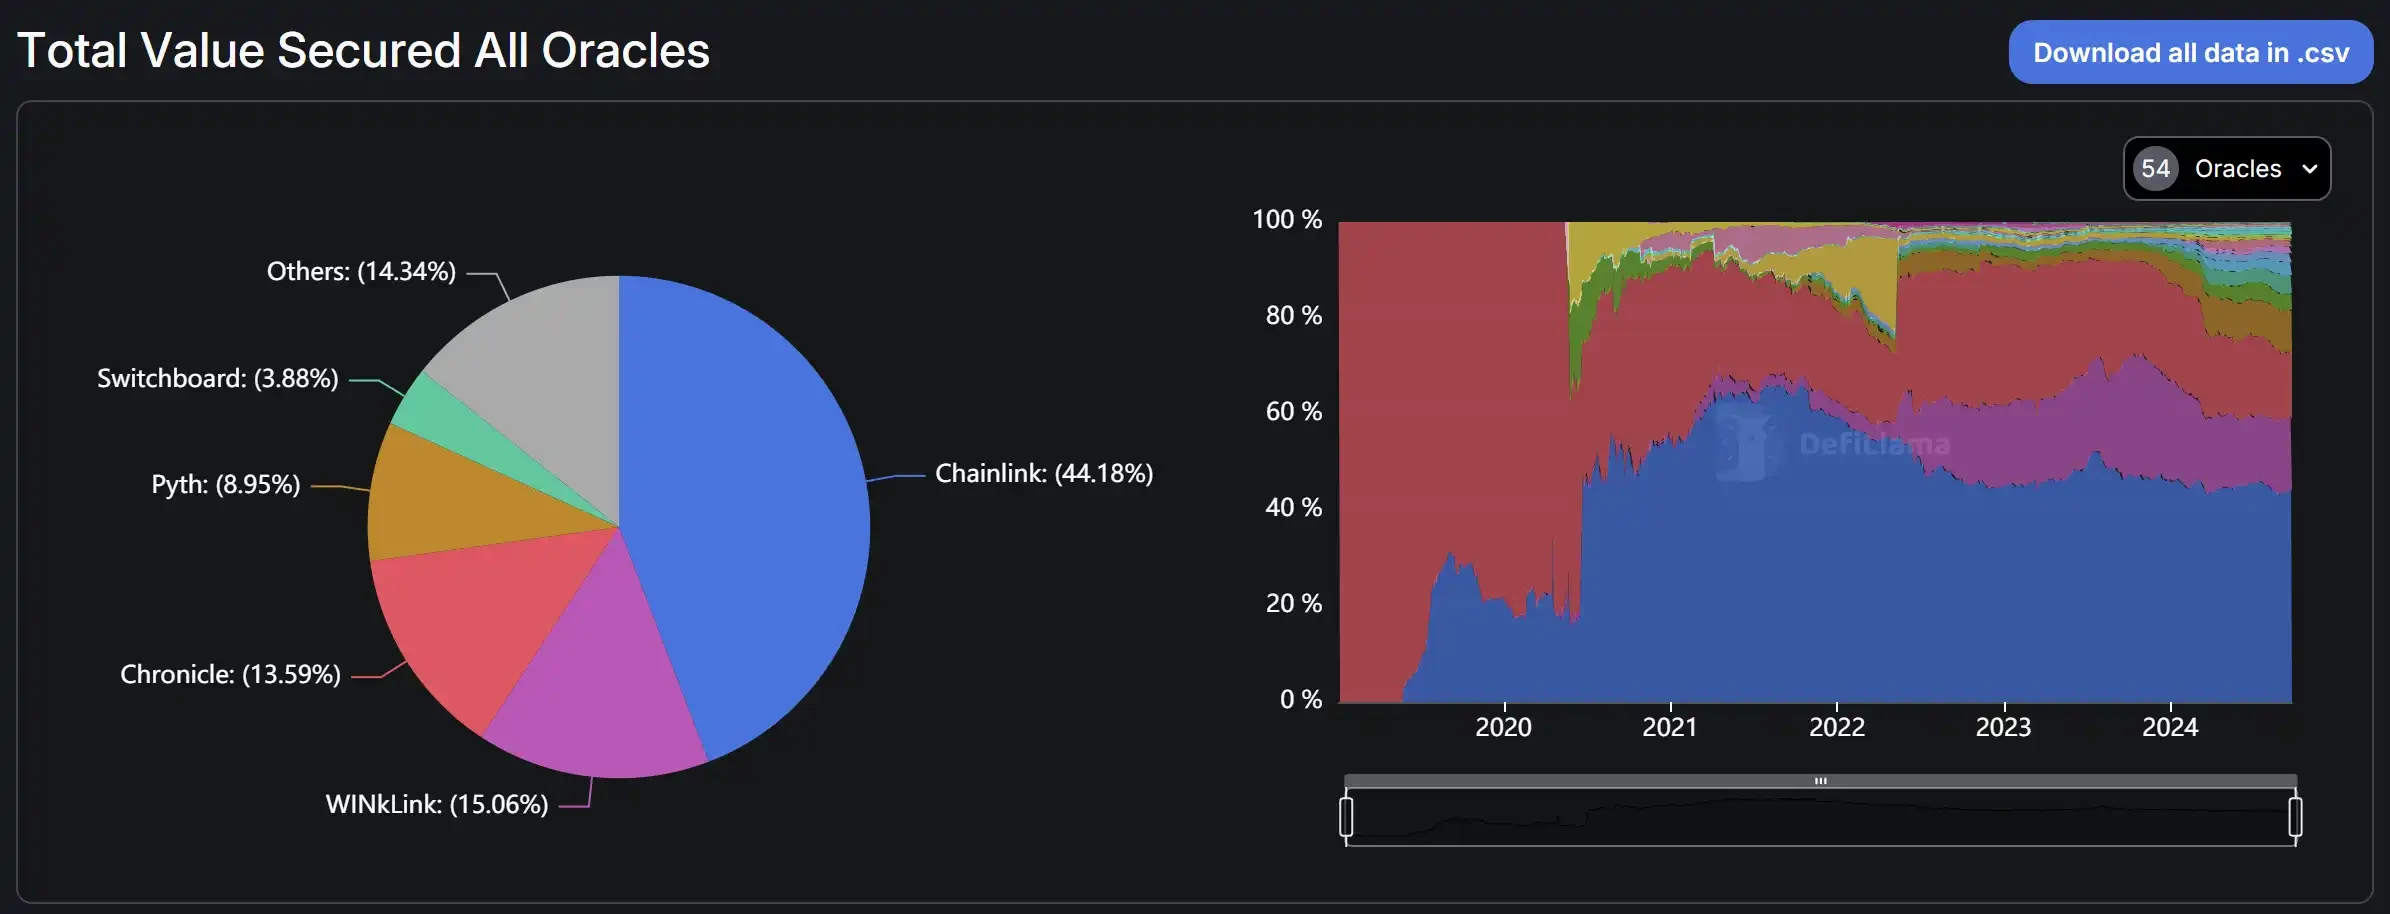
Oracle TVS share situation, data source: DefiLlama
Chainlink
As a veteran oracle project, Chainlink's main services include data feeds, CCIP, VRF, and contract automation (keepers). Its market share has remained above 40% since breaking that threshold in 2020, maintaining an absolute monopoly in the market. Its business covers not only on-chain but also partnerships with off-chain entities, such as SWIFT and Google Cloud. The market application range and scale of Chainlink are currently unmatched by other oracle protocols or even other infrastructure projects. In terms of specific business share, AAVE V3 accounts for 51% of Chainlink's TVS, the largest share, with a total TVL of 11.4 billion. The remaining four are Spark, Venus Core Pool, Compound V3, and Eigenpie.
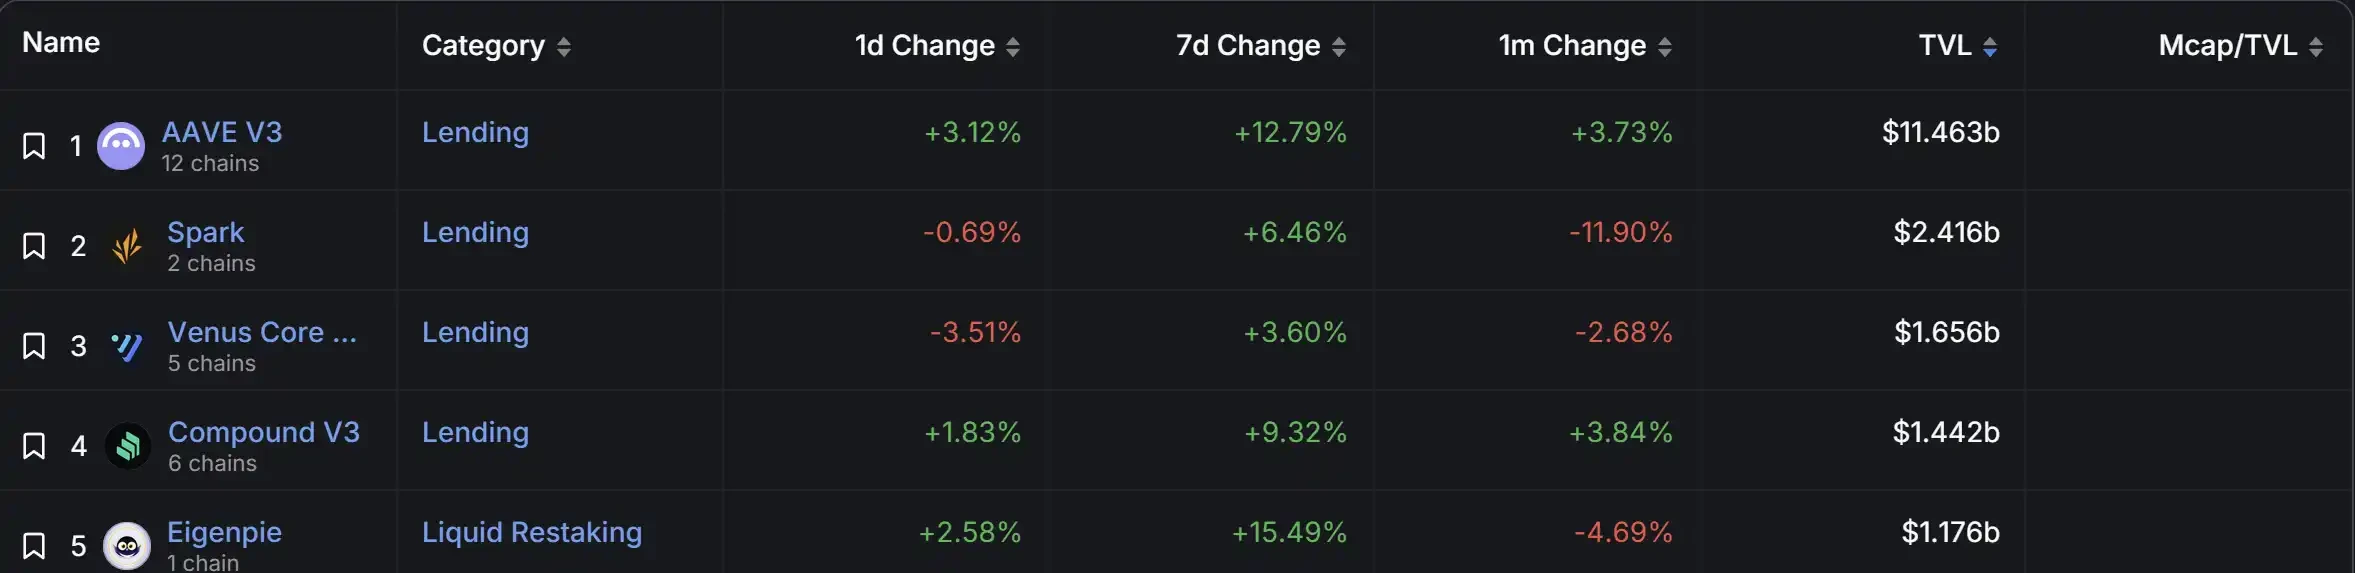
Chainlink TVL distribution, data source: DefiLlama
According to Dune data, since entering the bear market cycle in September 2022, Chainlink's monthly revenue has remained around $4 million. During this cycle, Chainlink's overall on-chain revenue has not returned to the levels seen in the 2021 bull market, barely reaching $4.7 million at the peak of a mini bull market in March this year.
Notably, AAVE, as the largest revenue contributor to Chainlink, has seen its protocol fee revenue reach new highs this year, approaching the performance levels of the previous bull market. Additionally, since the end of 2023, AAVE's daily active users have been continuously increasing, remaining unaffected even as market conditions cool. However, Chainlink's revenue has not seen a significant boost as a result.
In terms of revenue share, Ethereum dominated in the last cycle, contributing over 60% of revenue. With the rise of various L2s, Ethereum's overwhelming presence in Chainlink has somewhat diminished, and its share has gradually decreased. Emerging L2s represented by Optimism and Arbitrum have seen significant increases in their share. On one hand, Chainlink's revenue sources have become more diversified, but on the other hand, it reflects the fragmentation of ecosystem liquidity brought by L2s.
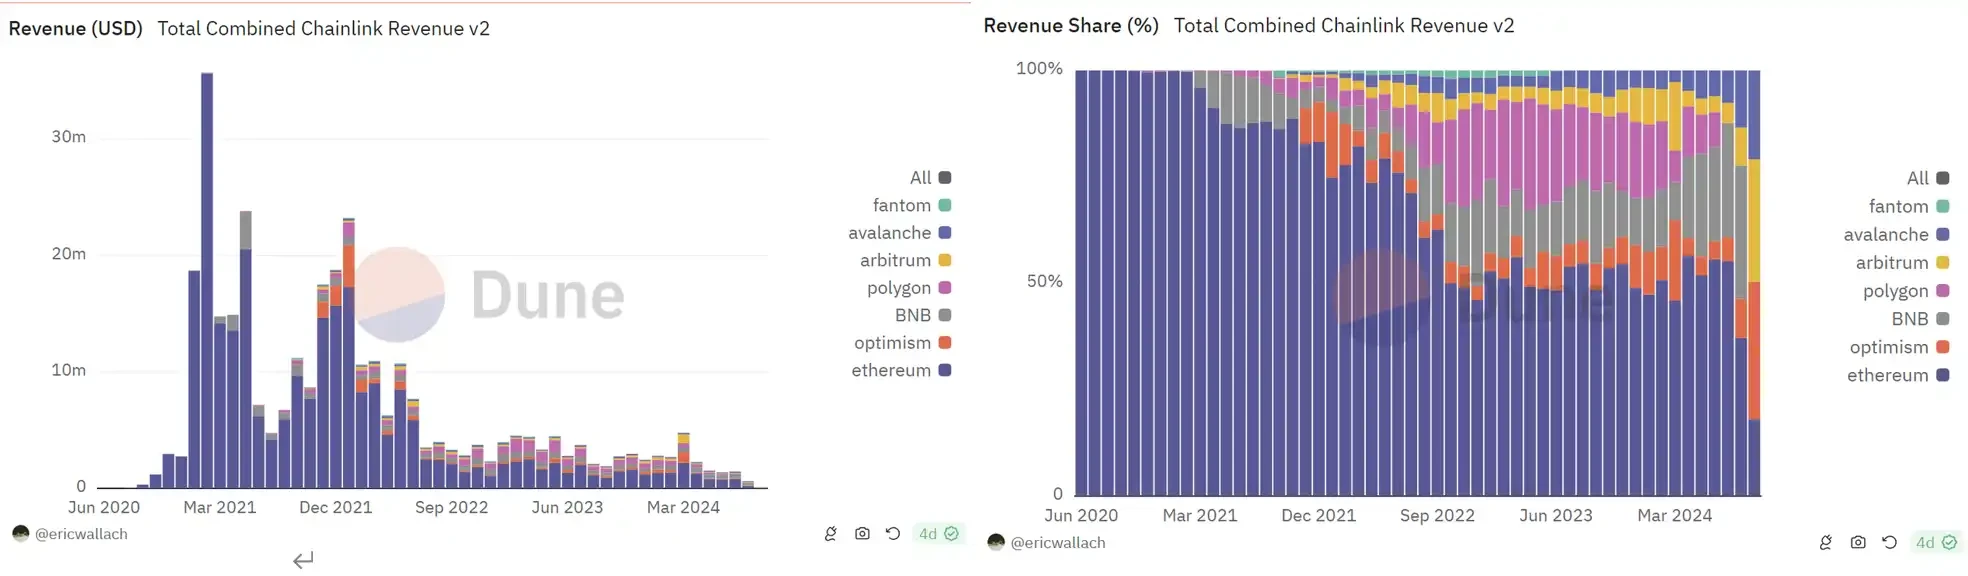
Chainlink revenue sources and share, data source: Dune
CCIP, as Chainlink's flagship product for entering the cross-chain sector, was officially launched in July 2023. Chainlink supports almost all mainstream public chains and protocols on the market while possessing first-hand data information, making CCIP's business integration quite favorable.
According to Dune data, CCIP primarily generates revenue from cross-chain fees, mainly contributed by mainstream L2s such as Arbitrum, Base, and Optimism. Cross-chain revenue largely depends on market conditions and is sensitive to market fluctuations. In March of this year, following the favorable catalyst of the BTC ETF approval, its cross-chain revenue peaked at approximately $258,000. After the on-chain market cooled, Q2 revenue decreased by 30%, and in Q3, as the market reached an extreme low, revenue fell again by 70%, ultimately stabilizing at $25,000 per month.
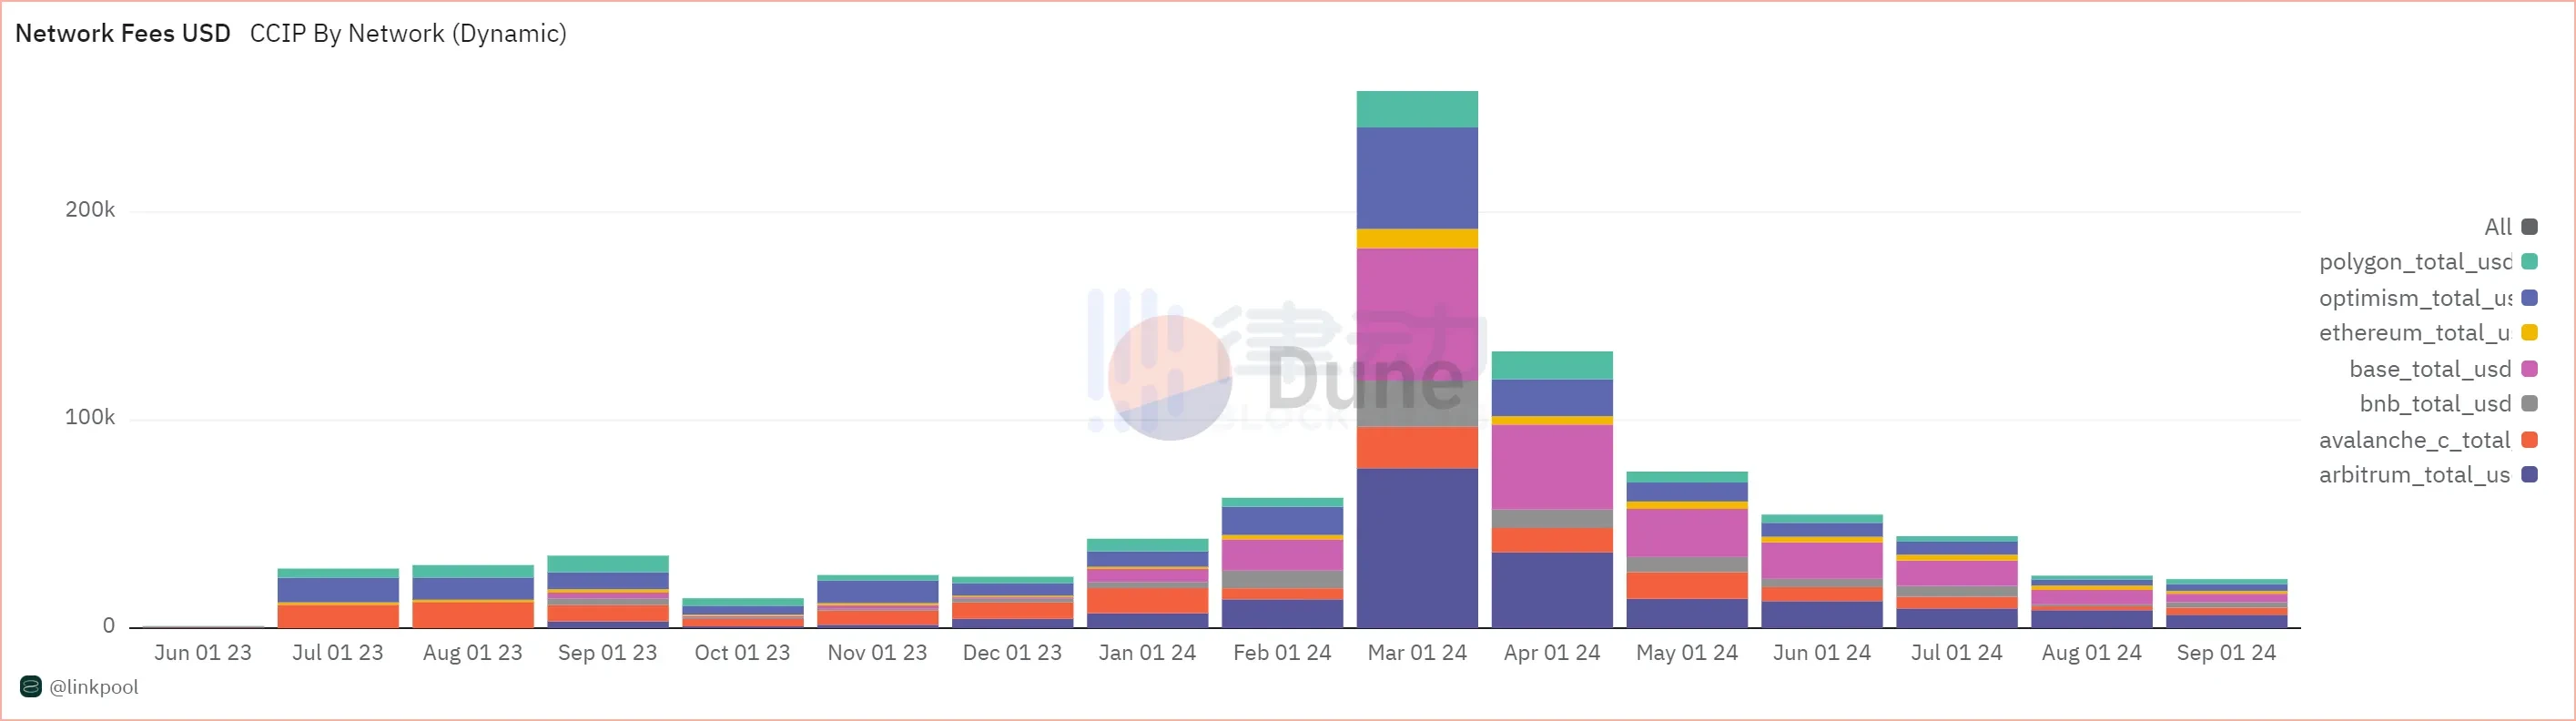
Cross-chain fees and sources, data source: Dune
In terms of token performance, its native token $LINK previously had no value capture function, and with the continuous release of node rewards, it only served to dilute the price of $LINK on a micro level. Since the release of token economics 2.0 in 2022, the utility of its token has changed, primarily reflected through the staking function of $LINK. In Staking 1.0, only community members and node operators were allowed to stake tokens; after the release of version 2.0, the staking scale was expanded, the staking threshold was lowered, and an unstaking mechanism was introduced. Currently, about 60% of $LINK is in circulation; although not fully unlocked, the staking mechanism has allowed $LINK's token price to perform well in this bull market.
Pyth
As a rising star, Pyth Network adopts a "pull" pricing service different from traditional oracles, improving the previous push service to an on-demand model. DeFi protocols can enjoy Pyth's pricing service by developing corresponding contracts, saving more time and development costs to refine their products. With its simple service model and support from the Solana ecosystem, Pyth has become the largest oracle protocol on Solana.
According to DefiLlama data, Pyth's business is concentrated in Kamino Lend, with a TVL of $1.32 billion, accounting for about 30% of total TVS. At the same time, Pyth's total TVS has been continuously increasing over time, more than doubling compared to its peak in 2022, and its scale of development continues to expand.
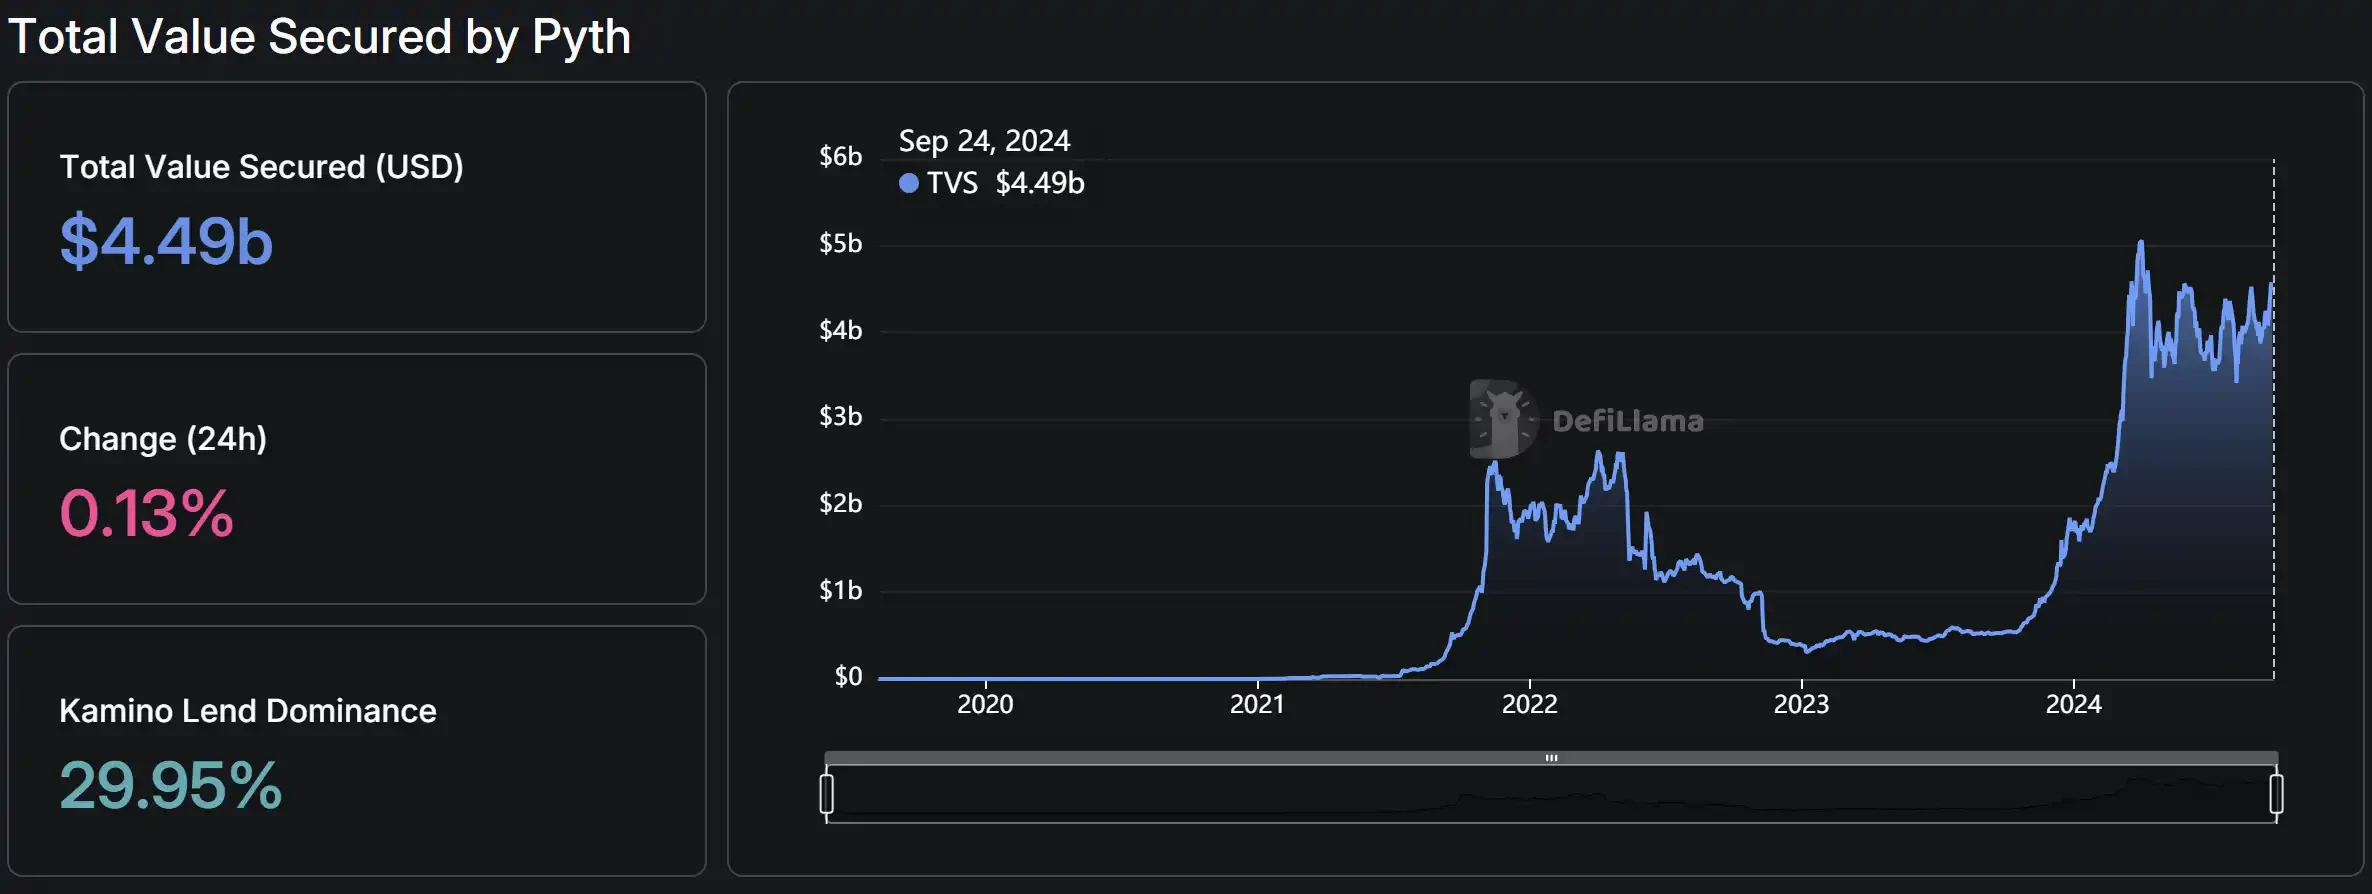
Pyth TVL (TVS) growth situation, data source: DefiLlama
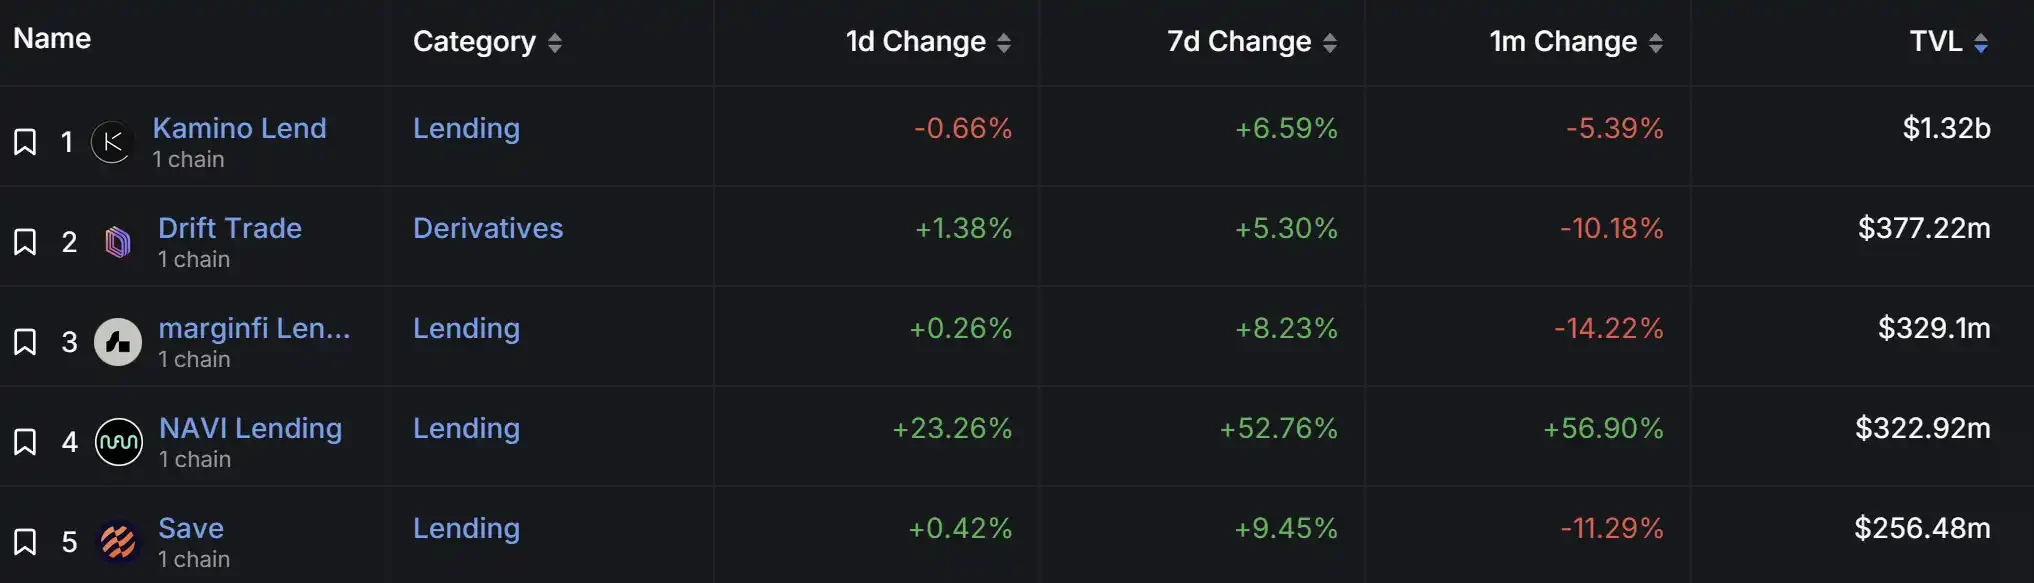
Pyth TVL (TVS) distribution, data source: DefiLlama
There is no public information available to check Pyth's income and expenses, so we infer Pyth's overall situation from operational data. Compared to the leading Chainlink, the "dark horse" Pyth has an absolute advantage in the scale of Price Feeds business on Solana. On a weekly basis, the number of transactions for Chainlink's pricing on Solana is far less than that of Pyth, with weekly transaction numbers not exceeding 1 million. Pyth, on the other hand, maintains above 1 million transactions, accounting for 85% of the total pricing transaction volume on Solana. Solana, as Pyth's "happy home," naturally serves as its stronghold. Considering the business scale of EVM chains, Pyth is in a period of steady growth, with its weekly transaction numbers stabilizing after surpassing 100K, primarily on public chains such as Arbitrum, Fantom, and Optimism.
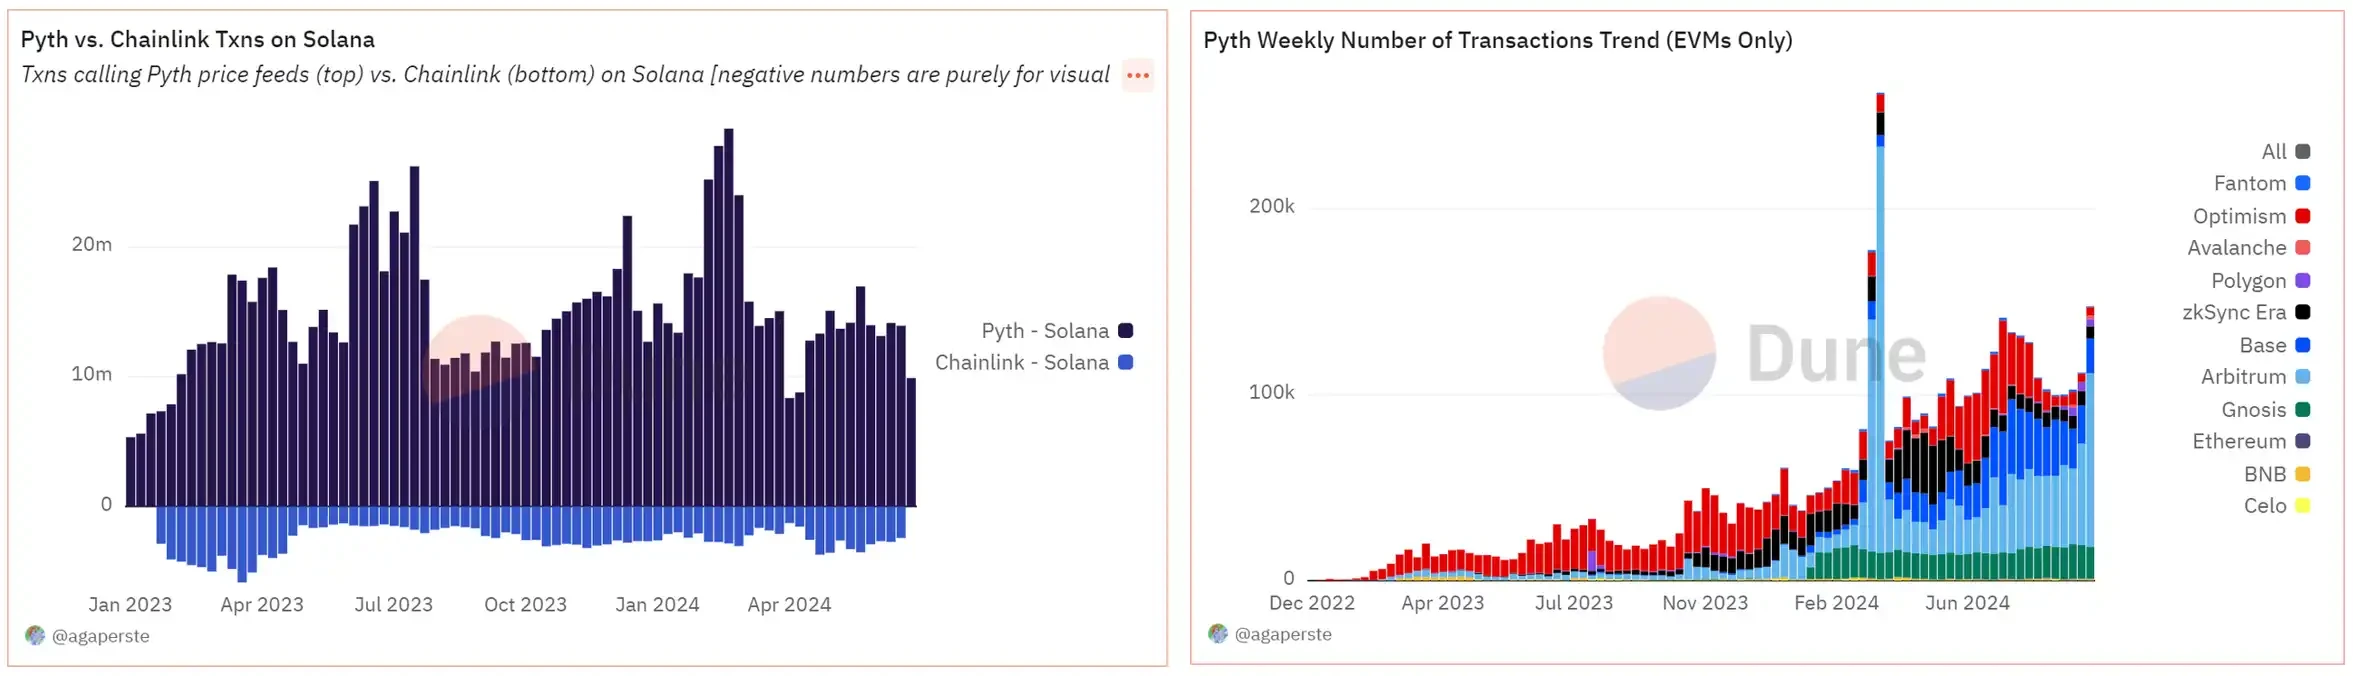
Left image: Pyth processing transaction numbers on Solana (compared to Chainlink); Right image: Pyth processing transaction numbers on EVM chains and their sources, data source: Dune
However, Pyth's market expansion on EVM chains still has a long way to go. According to Dune data, on a weekly basis, Chainlink remains in an absolute monopoly position, occupying about 92.7% of the EVM market share. Although Pyth is developing rapidly, its transaction volume on EVM chains is only a fraction of Chainlink's.
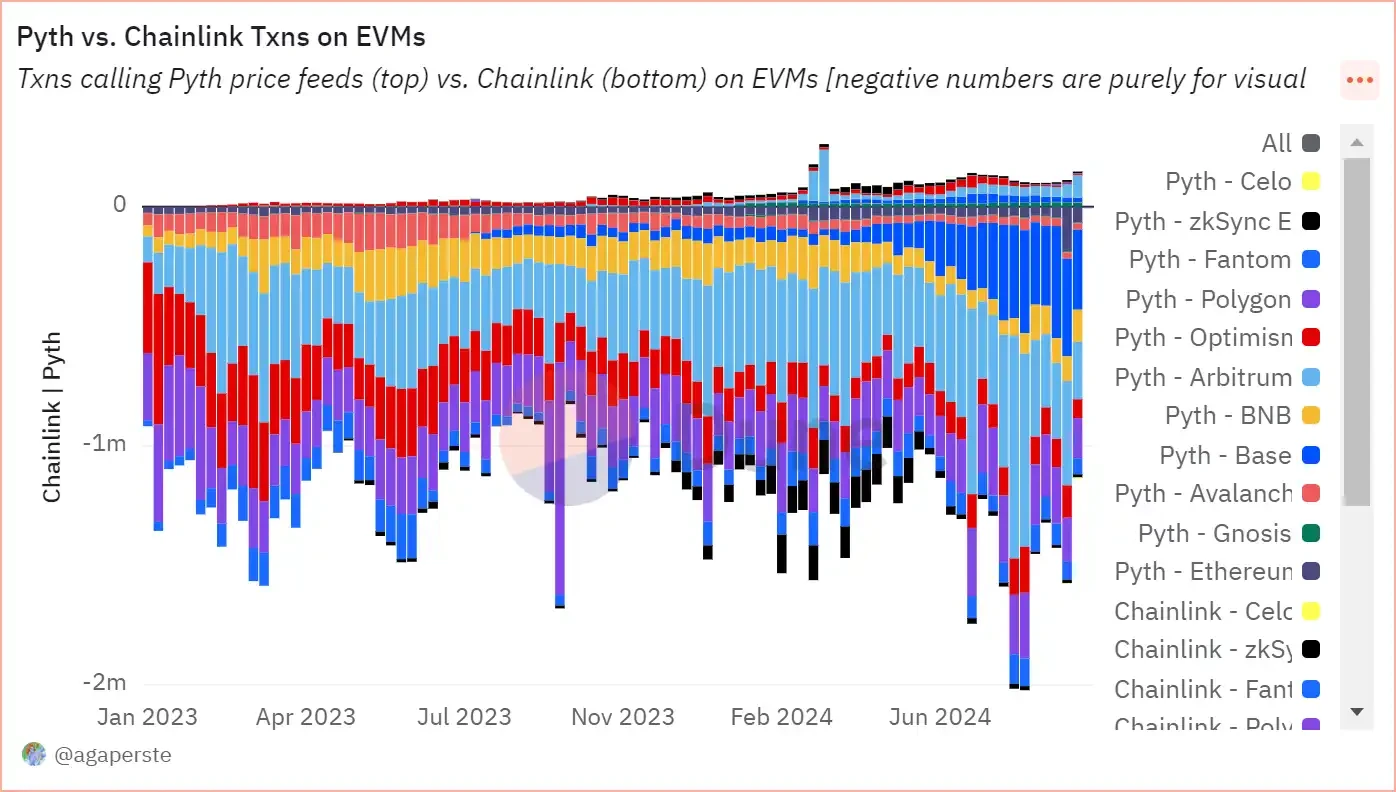
Comparison of transaction volumes processed by Pyth and Chainlink on EVM chains, data source: Dune
It is worth noting that, according to Dune data, for the entire Crypto market, the highest transaction volume processed by Chainlink comes from Solana, with transactions from EVM chains accounting for about half of Solana's total.
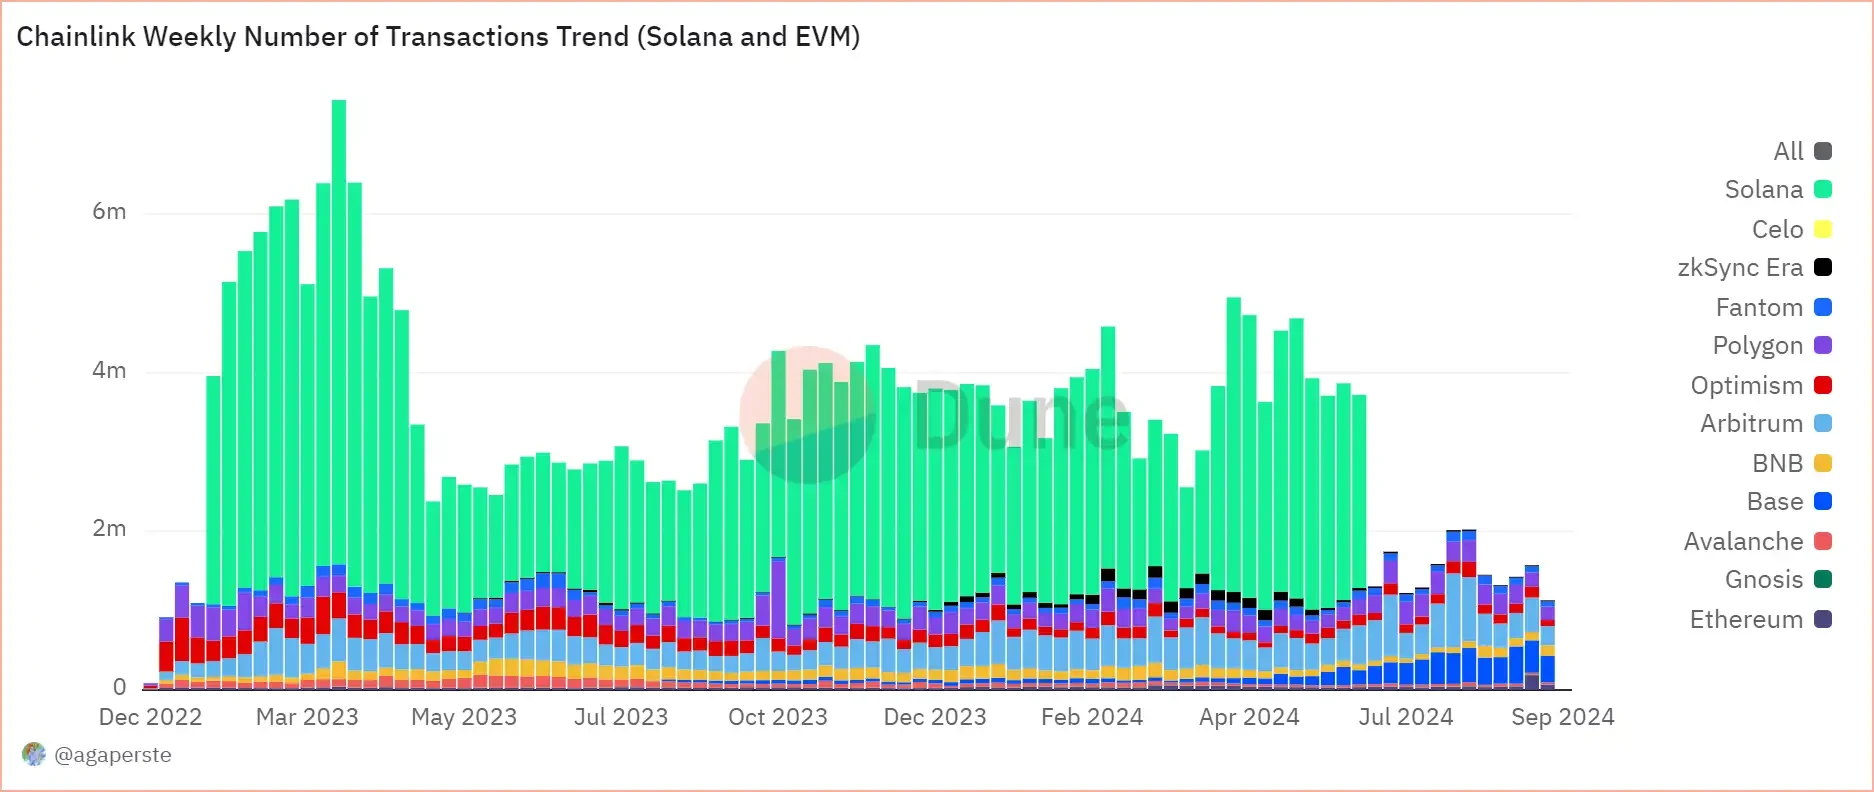
Chainlink weekly transaction volume (Solana vs. EVM), data source: Dune
In the context of the oracle sector gradually becoming a red ocean market in Crypto, Pyth needs to address the "WHY YOU" question for users from both cost and ecosystem perspectives in order to capture more EVM market share.
From the perspective of token investment, the value capture of $PYTH is similar to that of $LINK, allowing for community governance through staking. Aside from the staking function, users cannot share in the dividends of Pyth's development. Additionally, the total supply of $PYTH is 10 billion tokens, with only 36% currently in circulation. After a significant unlocking in May and a cooling market, the price of $PYTH has plummeted, sliding from a peak of around 1.2 to a recent low of around 0.3.
Although Pyth's fundamentals are strong, investors in its token need to understand whether these businesses are related to the tokens they hold.
Cross-Chain Interoperability
Since the formation of a multi-chain landscape dominated by Ethereum, with other public chains supporting it, cross-chain solutions have become an indispensable part of crypto infrastructure, addressing the liquidity fragmentation caused by public chain isolation.
In the field of cross-chain interoperability, we selected the top three cross-chain protocols: Wormhole, LayerZero, and Axelar, as well as cross-chain applications Across and Stargate. This article will analyze the profitability of cross-chain infrastructure from financial and operational perspectives. However, for cross-chain users, "with thousands of public chains, security comes first," and the safety of user assets should always be the top priority in project evaluation.
Wormhole
Wormhole is a cross-chain communication protocol developed in collaboration with Solana and Certus.One, launched on September 22, 2021. Initially, it was mainly used to facilitate cross-chain token transfers between Ethereum and Solana. As of now, Wormhole supports asset transfers across multiple chains, including BSC, Avalanche, Terra, and Base. As the highest market cap among the top three, Wormhole has a slightly different fee structure. According to official disclosures, for Wormhole Gateway, the only cost is the GAS from the source chain, and users only need to pay the GAS.
According to Dune data, the vast majority of cross-chain transactions still come from Ethereum to Solana, fluctuating around 50%, followed by BSC, which accounts for about 15%. Unlike other cross-chain protocols, Wormhole has a relatively small share of L2 cross-chain transactions.
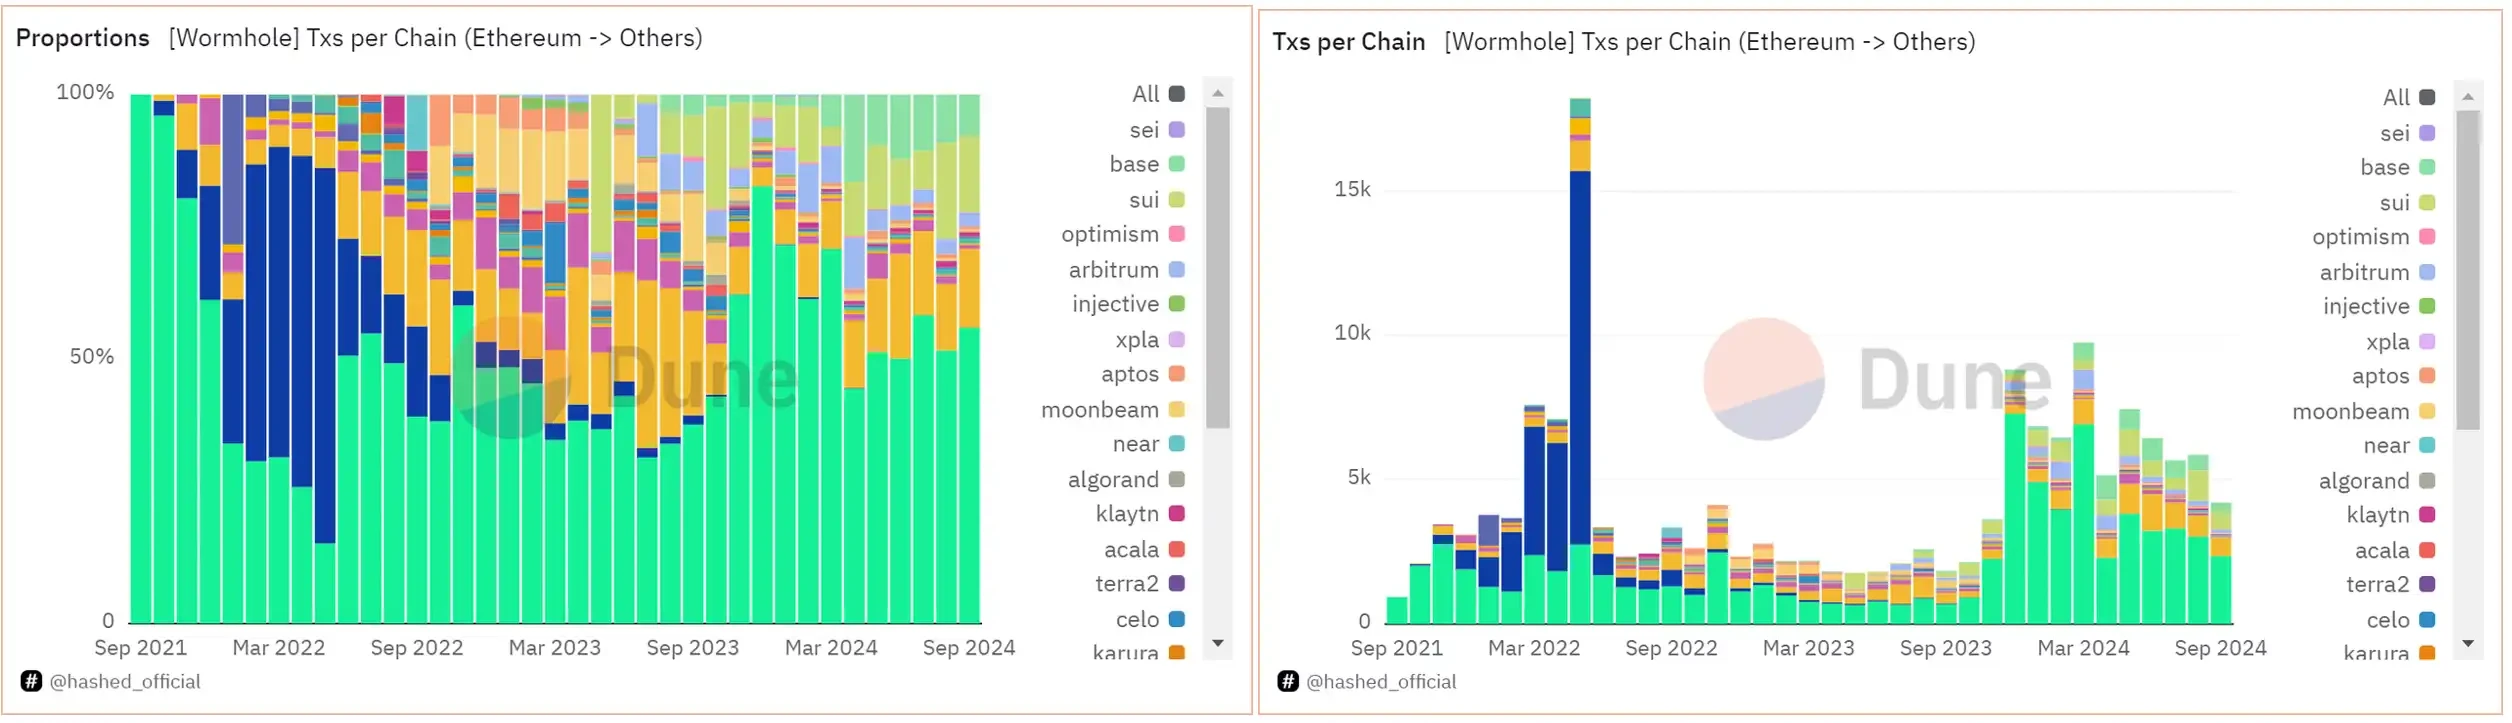
Wormhole cross-chain sources and transaction volume (from Ethereum to other chains), data source: Dune
Due to the design of the protocol fee mechanism, we cannot obtain direct revenue data. Therefore, we assess Wormhole's operational status from the perspective of user activity and transaction volume. Wormhole performed impressively in Q1 of this year, with peak daily transaction volumes approaching 50,000. The increase in transaction volume in January was mainly due to the wealth effect of Solana's MEME Coin, leading to active on-chain trading, with cross-chain transactions to Solana accounting for a significant portion of the total. This resulted in a surge in transaction volume in January. However, as the Solana MEME narrative gradually weakened, Wormhole's transaction volume visibly declined, stabilizing at around 3,000 to 5,000 for most of the year.
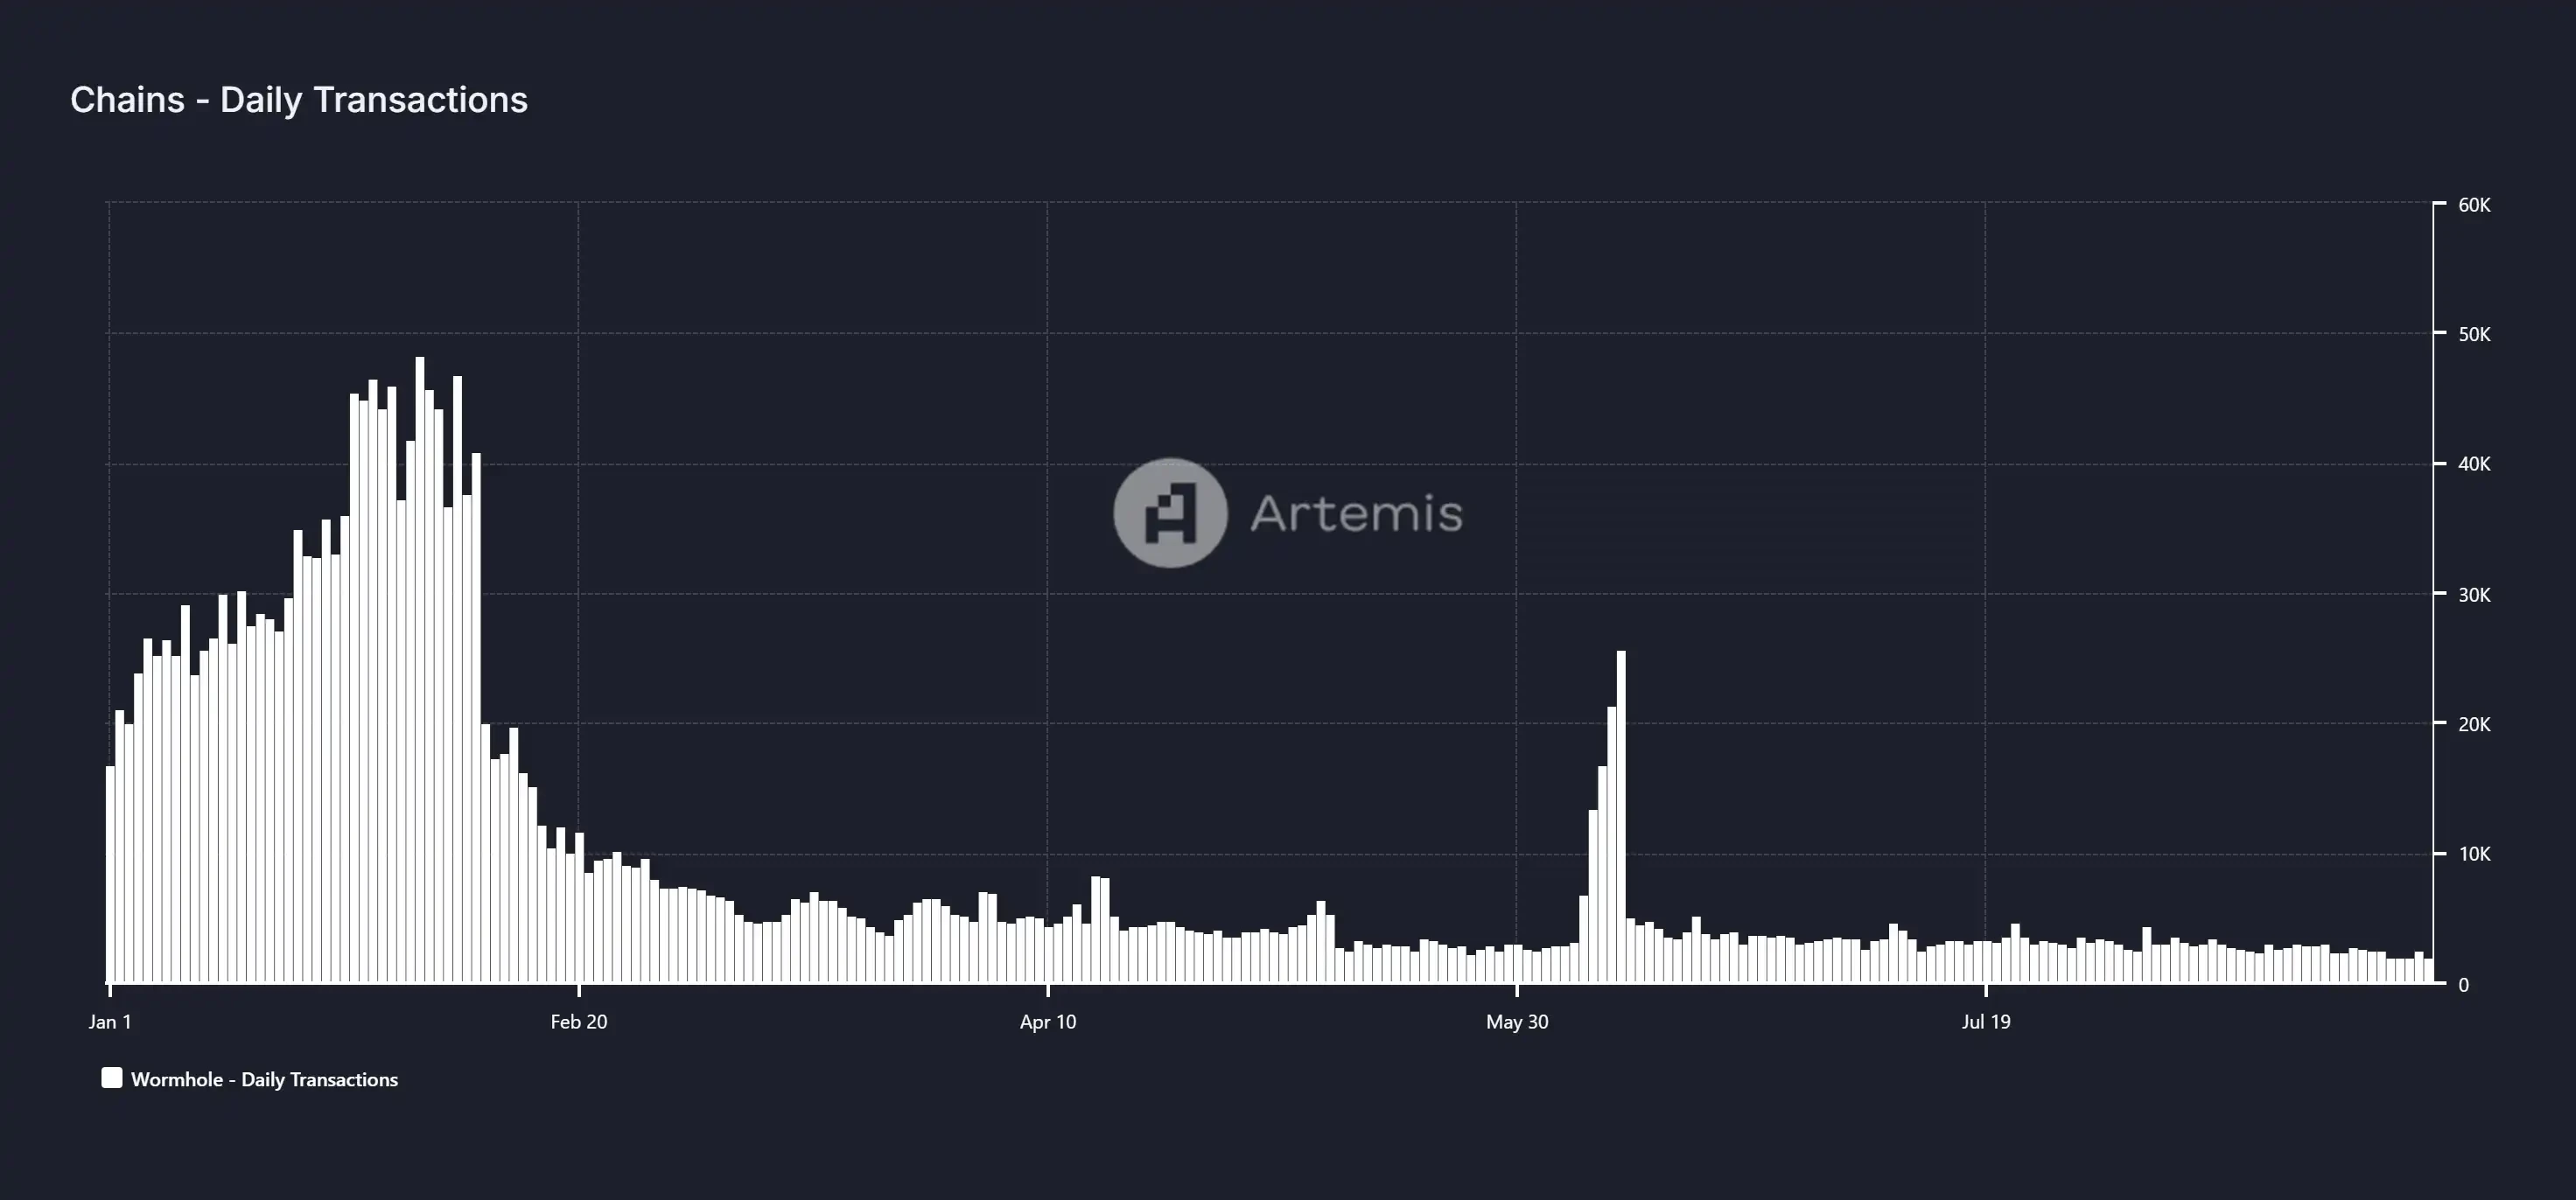
Wormhole daily cross-chain transaction volume, data source: Artemis
For token investors, Wormhole's native token $W has significant limitations in value capture. The main function of $W is focused on governance through staking. Unlike other cross-chain protocols, Wormhole employs a POA consensus mechanism, with validators consisting of 19 "trusted" large institutional validators who do not need to stake tokens when validating messages between chains. This not only reduces the application scenarios for the $W token but also means that under the POA mechanism, validators lack sufficient economic incentives, significantly lowering the cost of malicious behavior.
LayerZero
LayerZero serves as a foundational protocol for cross-chain communication, with its primary application scenario being the transfer of token assets, along with use cases for NFTs and cross-chain governance. LayerZero's revenue primarily comes from cross-chain information fees: when users transfer their token assets from the source chain to the target chain, the LayerZero protocol charges a fee in the form of the native token from the source chain. In the most recent quarter (2024 Q3), LayerZero's main revenue sources were Arbitrum, BNB Chain, and Ethereum. Additionally, in Q2 of this year, due to lower GAS fees, the proportion of cross-chain transactions on Arbitrum and Optimism increased significantly. As a leading protocol in the cross-chain space, the number of dapps integrated with LayerZero has successfully surpassed 50,000 this year.
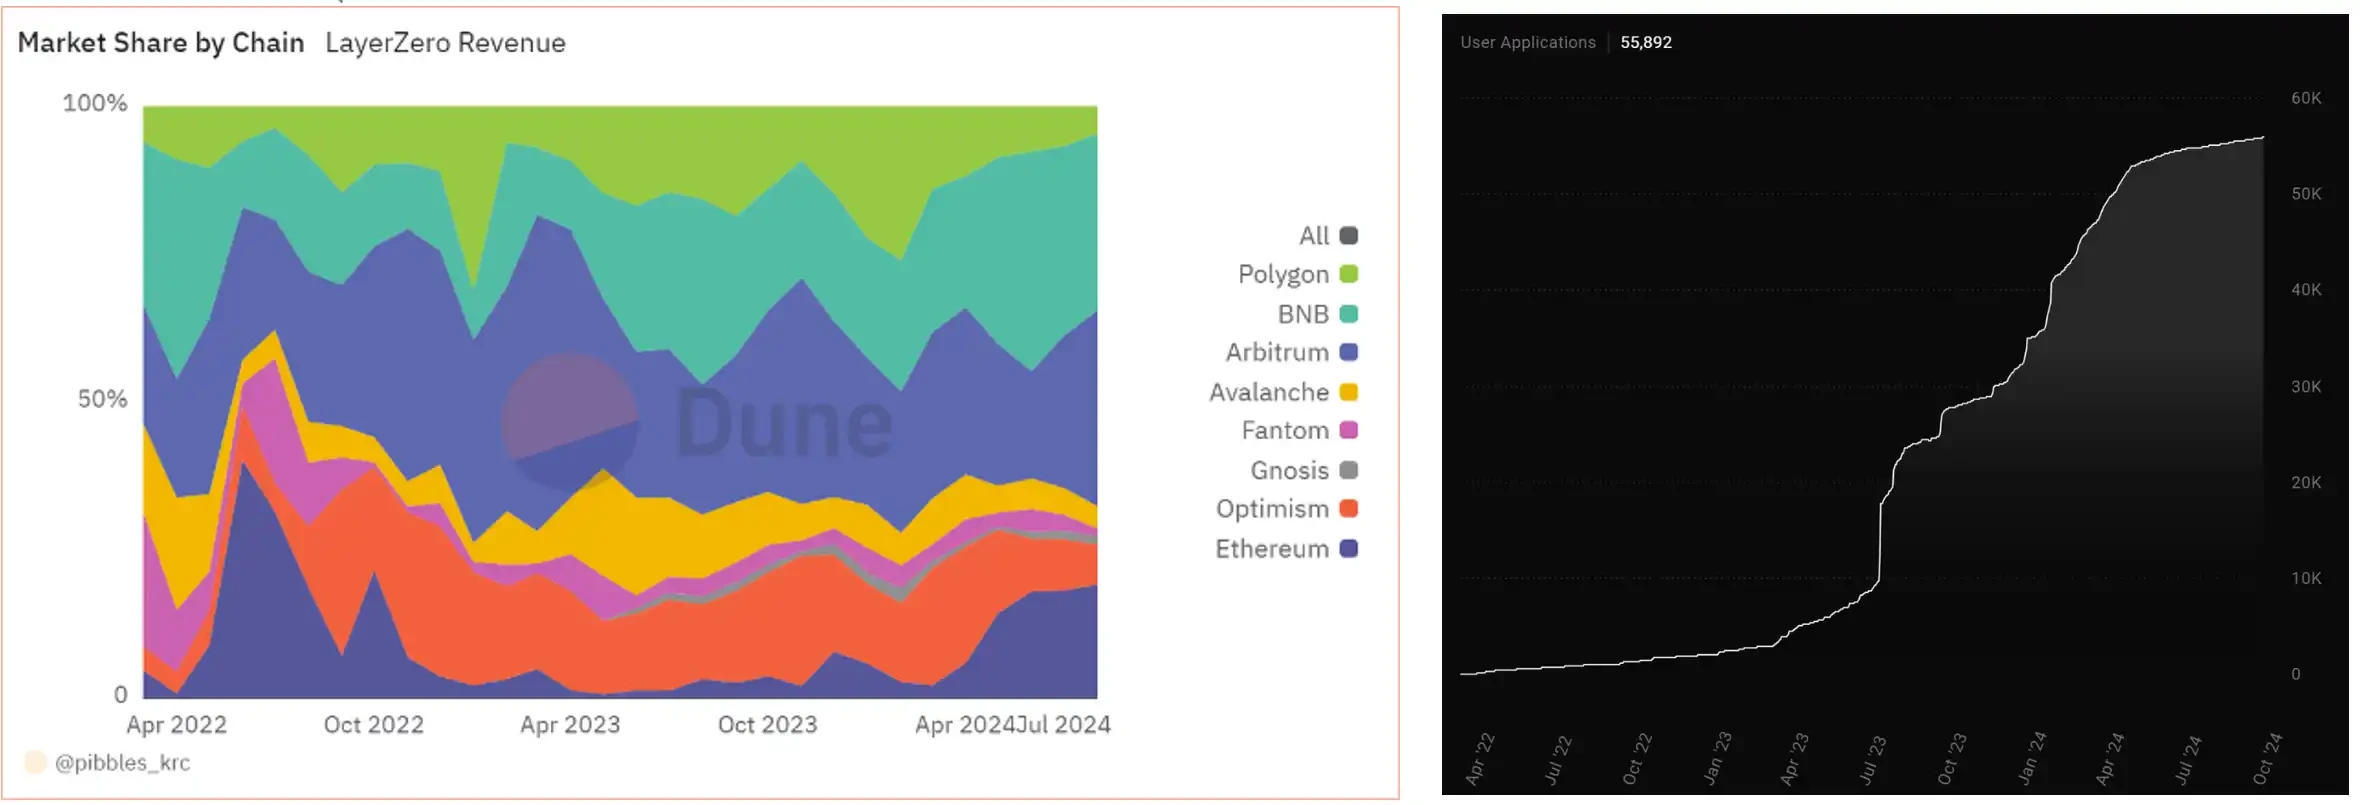
Left image: LayerZero revenue source share; Right image: LayerZero cumulative integrated application count, data source: Dune, LayerZero official website
According to Dune data, LayerZero's revenues for the three quarters of 2024 were $37.68 million, $12.86 million, and $970,000 (as of August 31). It is evident that LayerZero's protocol revenue began to decline significantly after entering Q2 and has not recovered. On one hand, this is due to LayerZero's official token distribution in June, which involved measures to clean up data embellishments prior to that; on the other hand, the overall market environment turned bearish in May, with significant declines in major public chain tokens exacerbating its revenue decline.
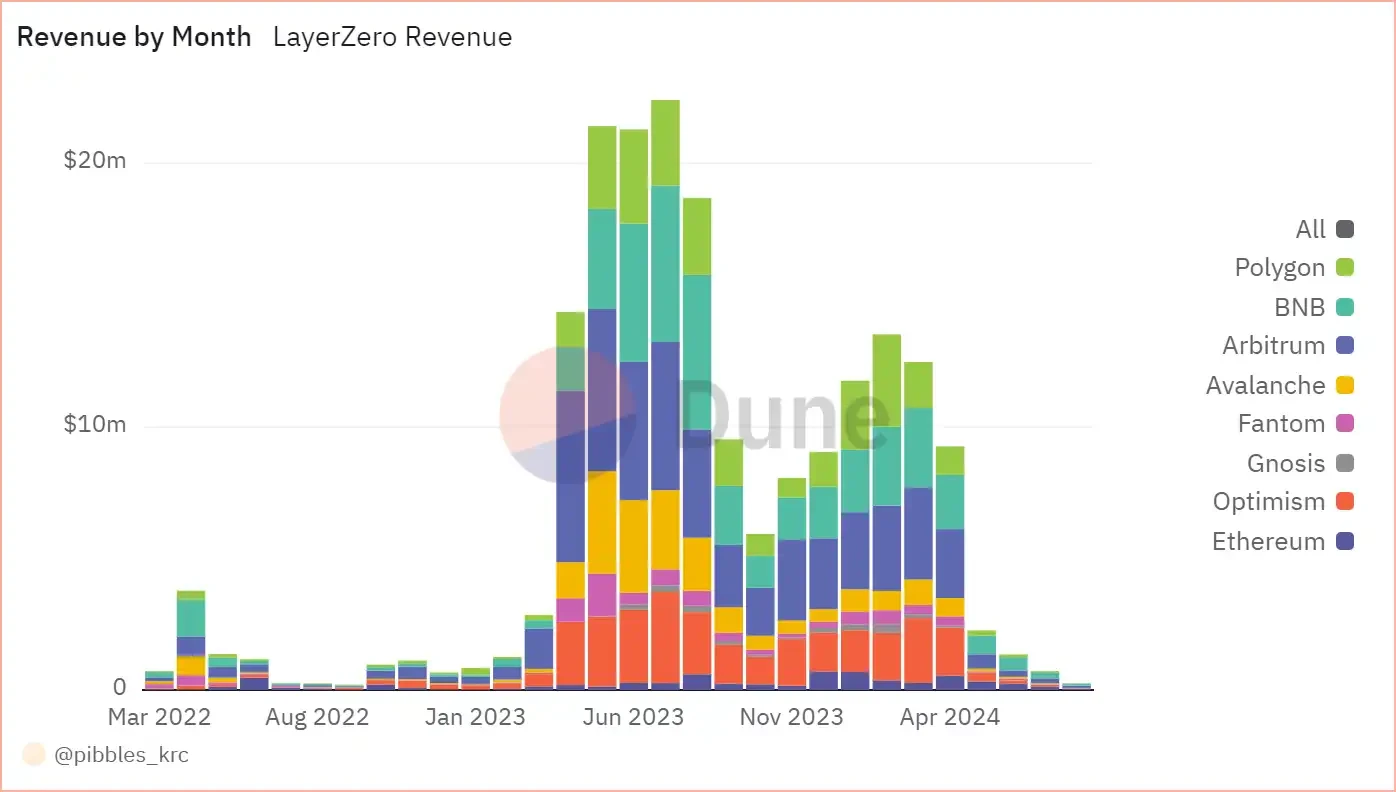
LayerZero monthly revenue and share, data source: Dune
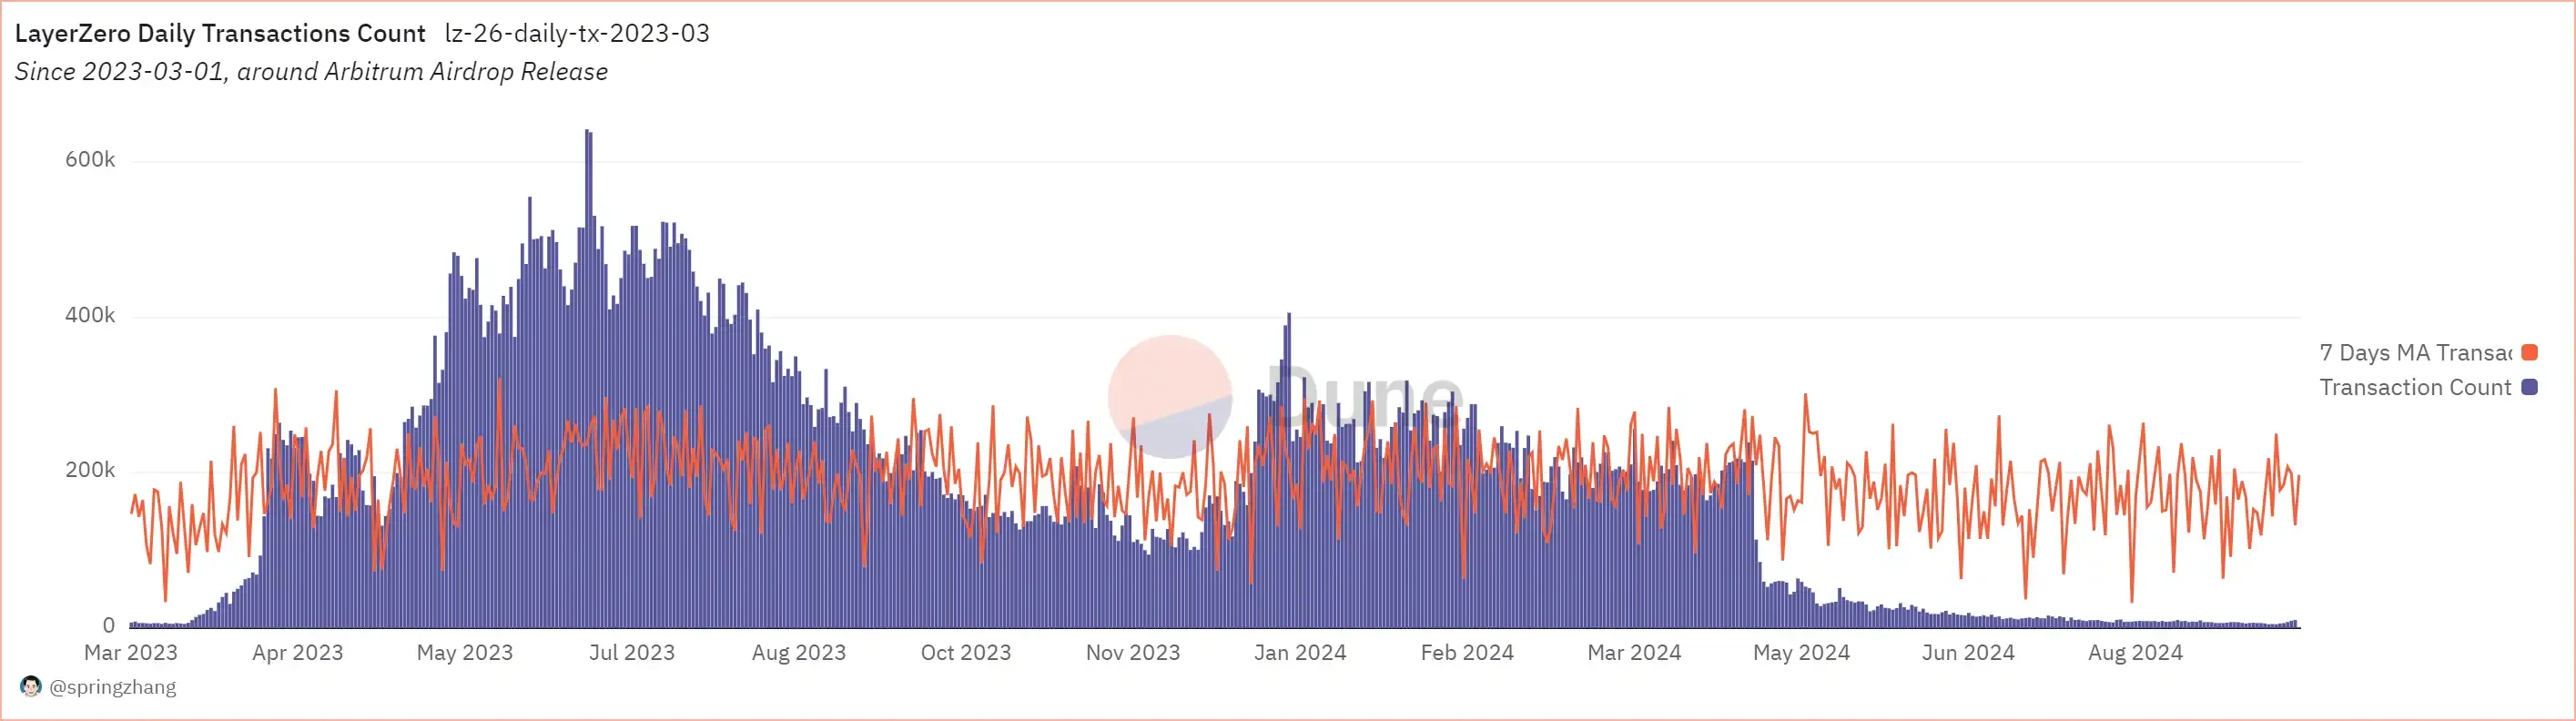
LayerZero daily transaction volume statistics, data source: Dune
LayerZero's overall operational status is closely related to the activity level of the on-chain market. When the on-chain market is bullish, LayerZero's operational data also soars. After the market turned bearish in May, its revenue approached "cut-off" levels, slightly above the previous bear market levels. This decline is attributed not only to market conditions but also to the significant reduction in GAS fees brought about by the Cancun upgrade, which was an important factor in LayerZero's revenue drop.
LayerZero's native token is $ZRO, which had a market cap of $1 billion at its launch in June this year but has since halved to $433 million. $ZRO serves as LayerZero's governance token and can be consumed during cross-chain message transmission. Fundamentally, LayerZero's market cap decline is smaller than its revenue decline, resulting in a P/F ratio that remains in an overvalued state.
Axelar
Axelar's business model continues to follow the traditional "rental" approach. Transactions and smart contract executions on the Axelar network incur corresponding fees, which are paid in AXL tokens and provide direct income to the network. Users pay GAS to the Axelar network for cross-chain transactions, which is then redistributed to stakers. Axelar's main expenses are the $AXL token rewards paid to validators. Additionally, Axelar is developing AVM, aiming to facilitate smart contract development across chains. According to official data, the primary cross-chain transactions currently come from BNB Chain and Sei, with a transaction volume of $3.4 billion, accounting for about 40% of the total transaction volume.
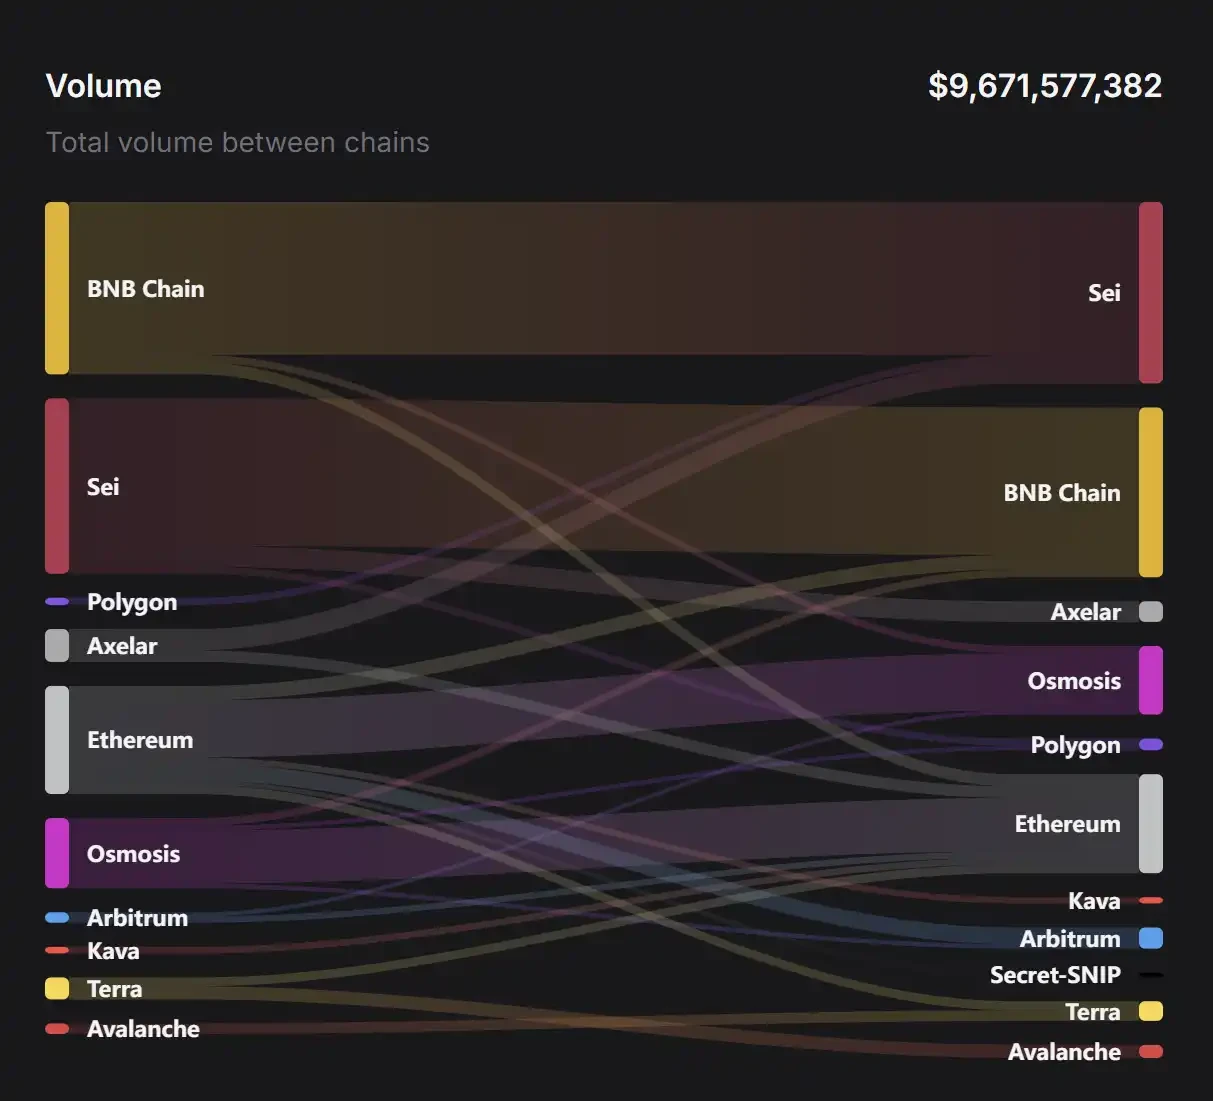
Axelar official statistics on cross-chain transaction distribution, data source: Axelar official website
From Q1 2024 to Q3 2024, both in terms of transaction volume and cross-chain fees, Axelar's indicators in USD terms are not optimistic, showing a year-on-year decline of over 50% and exhibiting an accelerating downward trend. From a price-to-earnings perspective, Axelar's P/F ratio in the third quarter has increased rather than decreased. The main reason is that its market cap has dropped by about 30%, which is a lower decline compared to the halving of cross-chain fee revenues, resulting in an overall inflated P/F ratio.
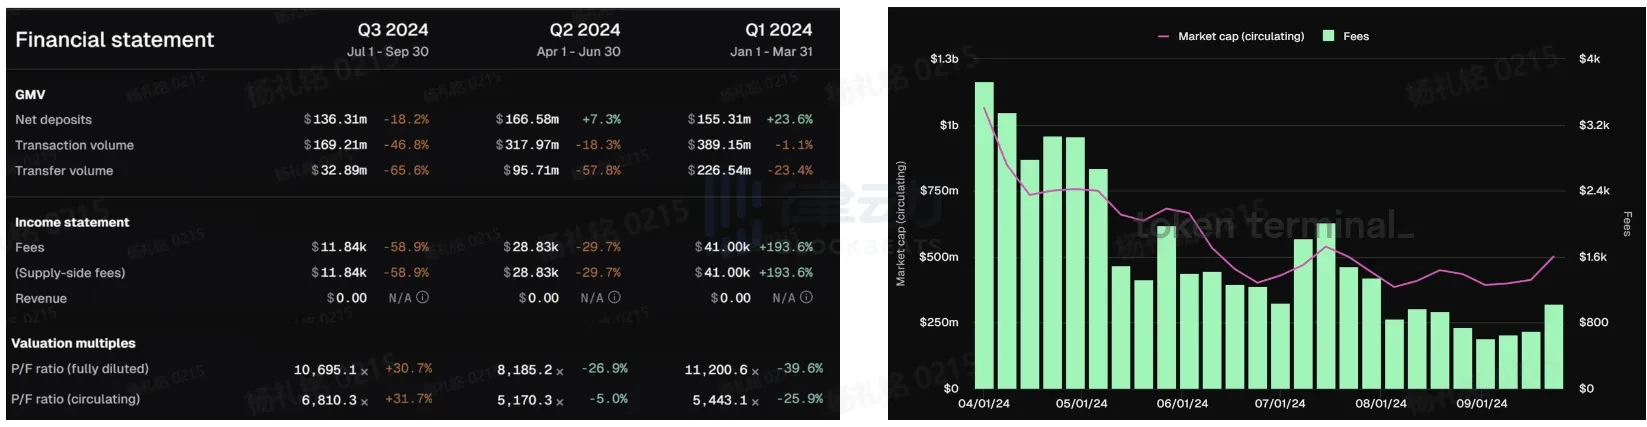
Left image: Axelar quarterly financial indicators; Right image: Axelar circulating market cap and transaction fee comparison, data source: Tokenterminal
In terms of user data, Axelar's daily active users peaked in mid-January and mid-July this year, reaching a maximum of 4.5K. However, after mid-July, it gradually fell back to around 1.5K. Compared to 2023, Axelar's user base has remained active this year. Notably, the proportion of GMP (General Message Passing) in the Axelar network has been steadily increasing, almost completely replacing simple asset cross-chain transactions, accounting for 98% of total active users.
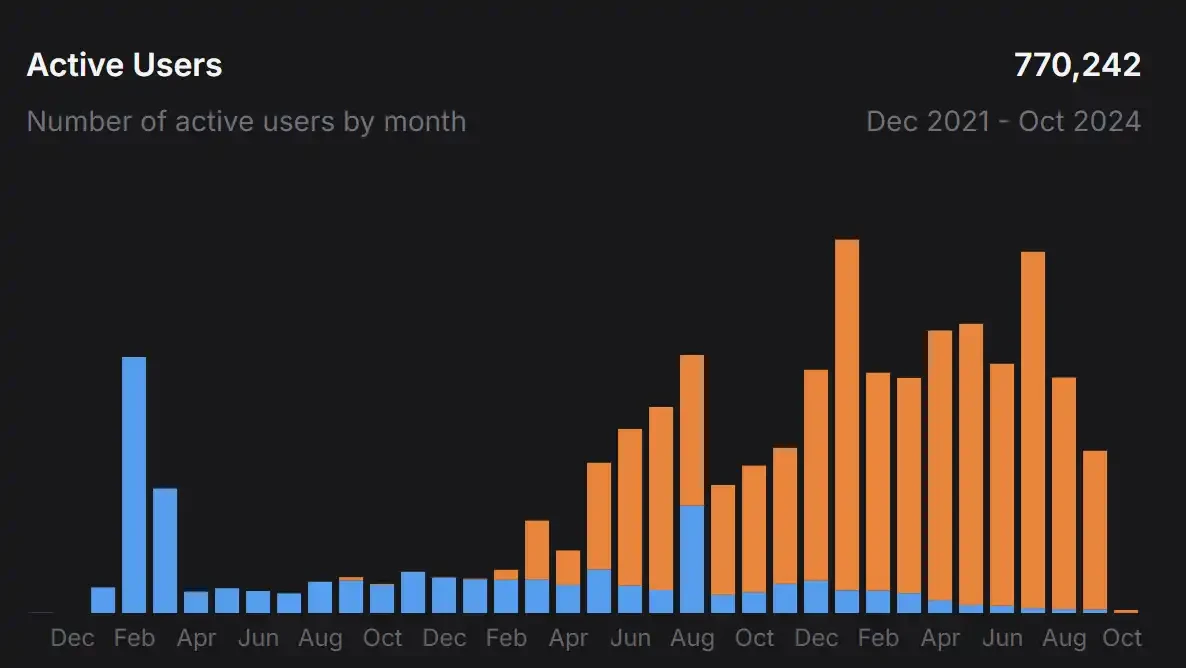
Axelar monthly active data, data source: Axelar official website
Axelar has now connected 66 chains, including mainstream public chains such as Ethereum, BNB Chain, Arbitrum, and Fantom. As the number of connected networks increases, the threshold for validators will also rise, leading to higher corresponding token rewards. Initially, this scheme would increase the inflation rate of $AXL, but after the official recognition of this issue, a GAS burning mechanism was introduced instead. The overall change in the token inflation mechanism is beneficial for $AXL investors, as its annual inflation of 11.5% can be offset by 10% through GAS burning.
Across
Across is a cross-chain protocol supported by UMA, utilizing UMA's optimistic oracle mechanism to facilitate cross-chain transactions between L2 and L1. Currently, it supports mainstream L2 public chains such as Arbitrum, Optimism, Base, Linea, and Blast.
In terms of technical design principles for cross-chain operations, Across introduces a relayer called ReLayer, which locks the token assets from the source chain and releases the corresponding tokens on the target chain. After the relaying execution, the optimistic oracle will perform subsequent data verification to ensure asset security and reward the relayer. The relayers in the Across network rely on the liquidity of the corresponding tokens provided by LPs on the target chain during bridging; if liquidity is exhausted, it will lead to a surge in user cross-chain costs.
Therefore, the smooth operation of Across relies on the participation of both "Relayers" and "LPs." Both bear various risks associated with any bridging event on Across, and users pay fees to them when using cross-chain services. On one hand, the liquidity pool's operational model is essentially similar to AAVE or Compound, and its pricing scheme also references AAVE's pricing design, adopting an interest rate pricing model: calculating the interest rate R through a model and using a weekly trading cycle as a benchmark to calculate LP fees. On the other hand, relayers will advance GAS during cross-chain transactions and will receive fee compensation once the transaction verification is successful. Therefore, when assessing whether Across's operations are good, transaction volume and transaction fees will be relatively fair evaluation criteria.
According to DeFiLlama data, Across's transaction volume in the past month was $637.94 million, ranking 6th among cross-chain applications. As of September 11, Across has accumulated over 2 million users, with monthly active users stabilizing around 200,000.
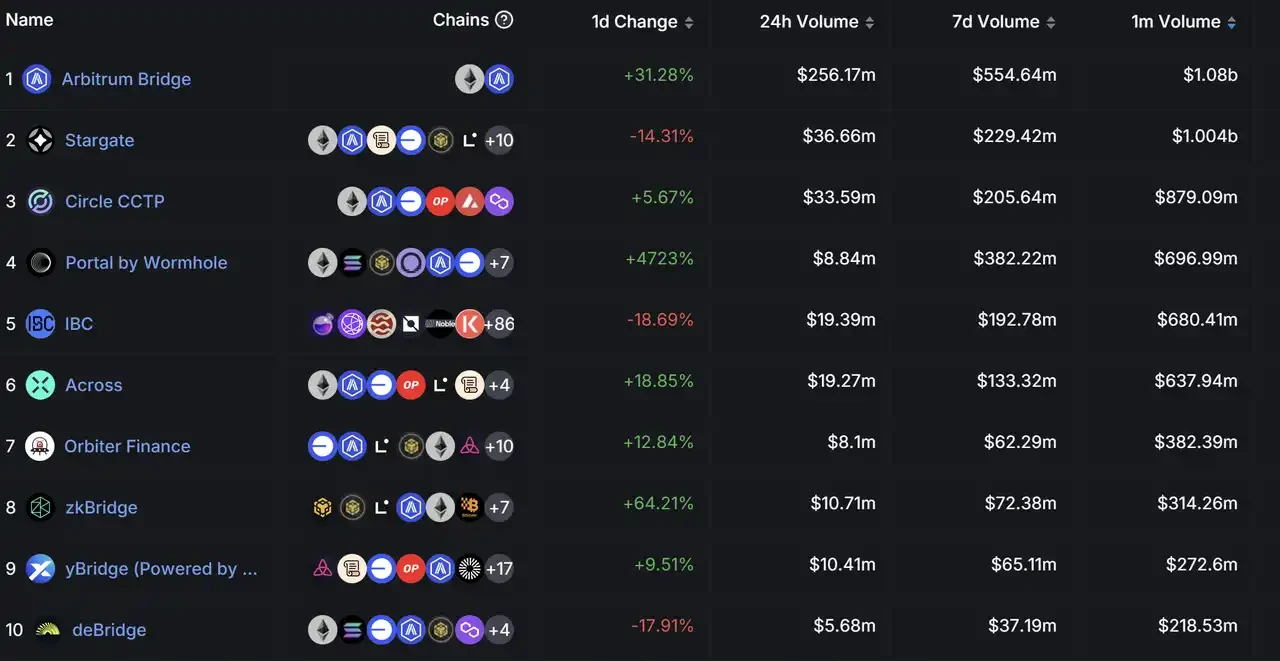
Ranking of cross-chain applications (sorted by transaction volume), data source: DeFiLlama
Additionally, according to data provided by Dune, the cross-chain transaction fees generated by Across in Q2 of this year have reached levels comparable to the daily transaction fees at the end of the last bull cycle, hitting $60,000 per day. Although Across may not have the same level of fame as other cross-chain applications, it still possesses a certain degree of competitiveness in the market.
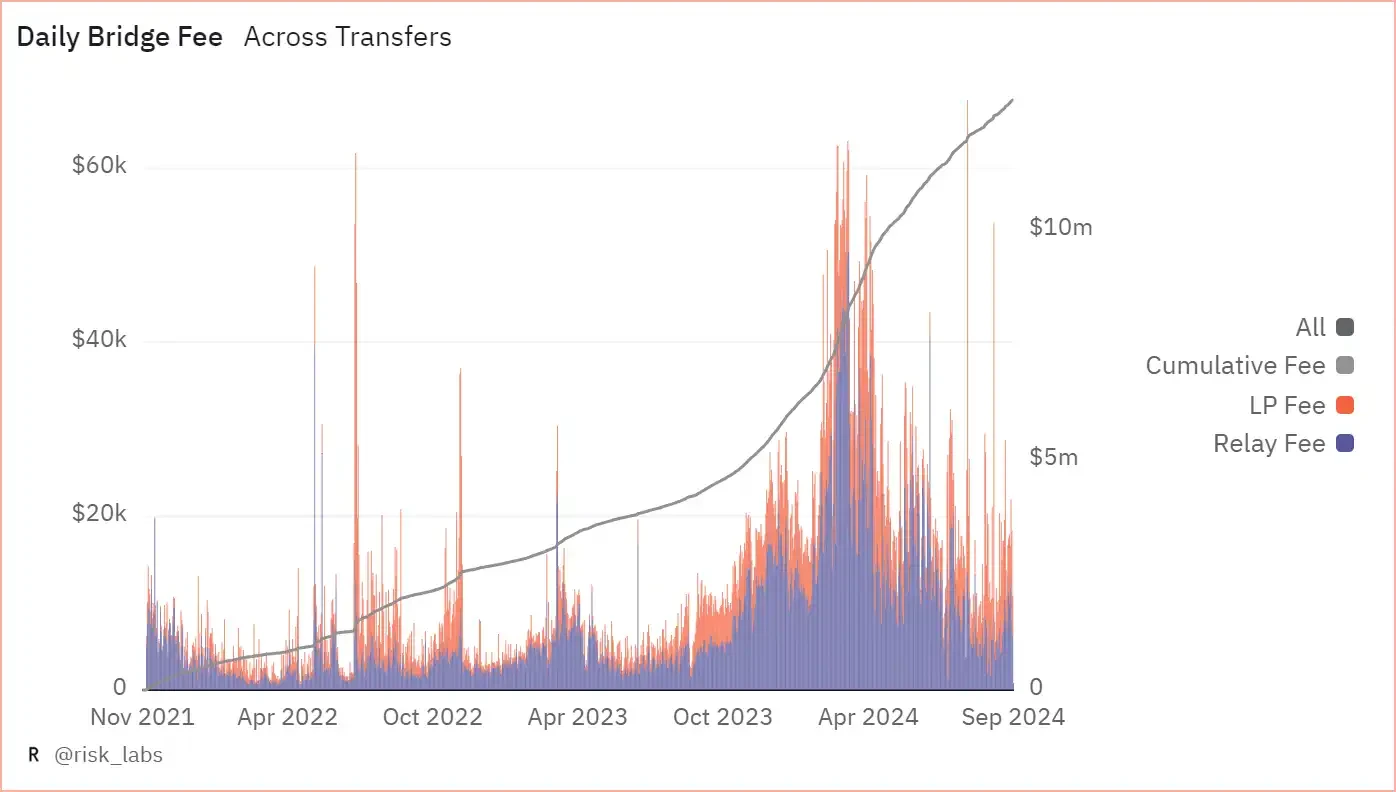
Across daily cross-chain transaction fees and composition, data source: Dune
In terms of cross-chain transaction volume, Across's cross-chain volume reached a high level of $2.4 billion in Q1 at the beginning of the year. Subsequently, the MEME craze in Q2 maintained cross-chain transaction volume above $2.5 billion. However, contrary to this, while on-chain transfers increased, the fees did not rise to their expected levels. Instead, they peaked in Q1 of this year and then fell by 33% in Q2 and 66% in Q3. The decline in Q2 was due to the Cancun upgrade, which significantly reduced L2 cross-chain GAS fees. The decline in Q3 was attributed to a downturn in the market leading to reduced transaction volumes.
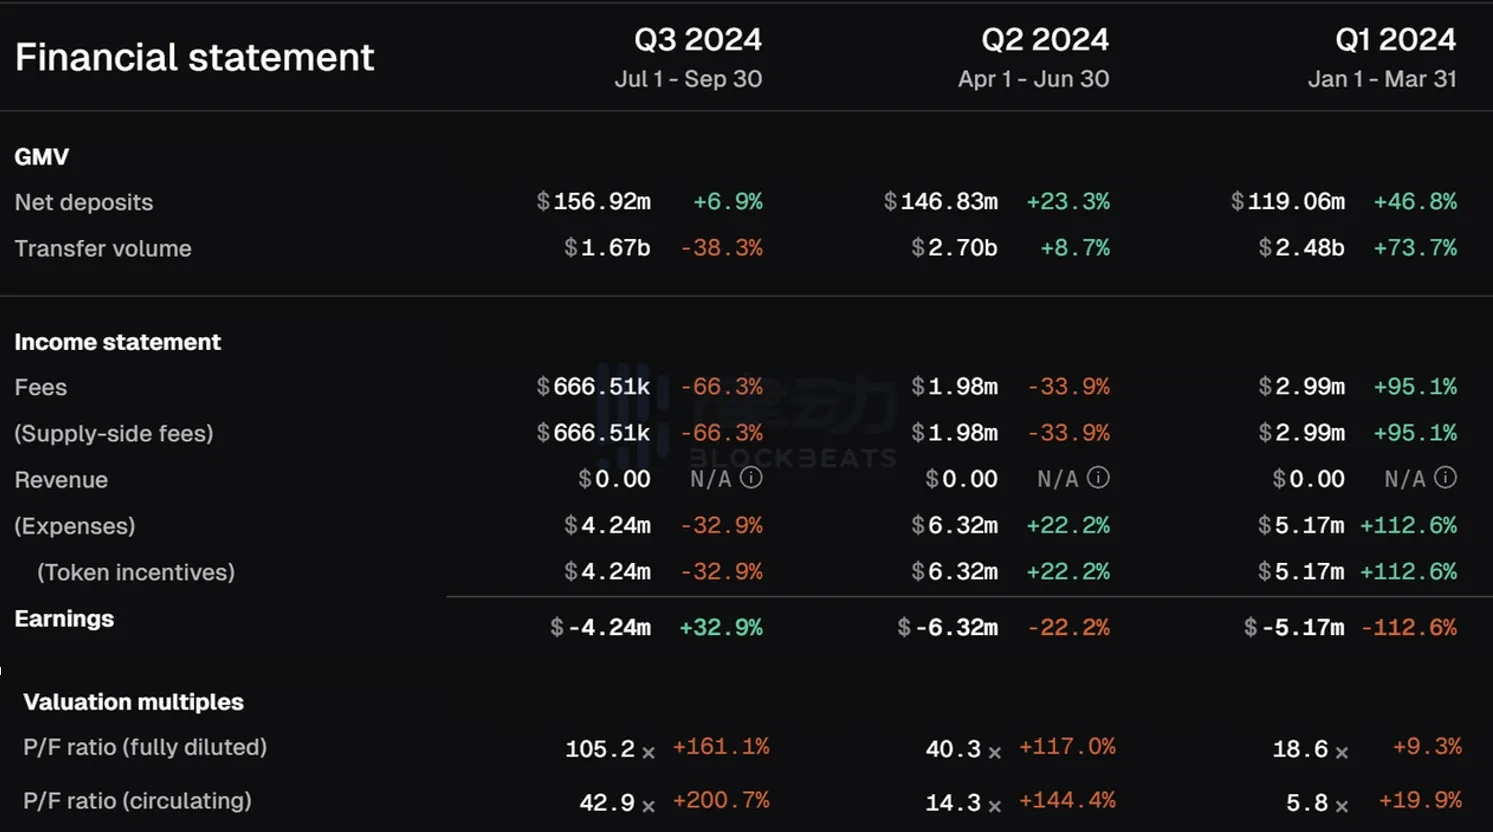
Across various financial indicators, data source: TokenTerminal
From the perspective of token investment, Across's native token $ACX has weak value capture capabilities. $ACX can be used for decision-making in managing DAO funds and as rewards for LP locking. Across has proposed an LP locking reward program, where the longer the locking period, the more multiplier rewards and $ACX token incentives are received. After the Snapshot proposal was approved in September 2023, Across increased the APY % of the liquidity pool by 50% and reduced the original 3x multiplier to 2x.
Clearly, for the Across project itself, its profitability and the price of the token are not directly related to its market cap. Although the transaction fees on the Across network have experienced significant declines, the market cap of its token $ACX remains stable at around $120 million. Therefore, the decrease in transaction fees has led to an increase in the P/F ratio, putting the overall project in an overvalued state. However, for investors, the overall inflated P/F ratio does not seem to have a direct impact on their investment decisions regarding $ACX.
Comparison of Across transaction fees and circulating market cap, data source: Tokenterminal
Stargate
Stargate is a composable liquidity transfer protocol launched by LayerZero, developed based on LayerZero technology. Stargate is more focused on becoming a cross-chain application for full-chain DeFi, currently covering more than 10 public chains, including Arbitrum, Scroll, and Base. According to DeFiLlama data, in the past month, its scale is second only to Arbitrum Bridge, reaching $1 billion, firmly holding the second position.
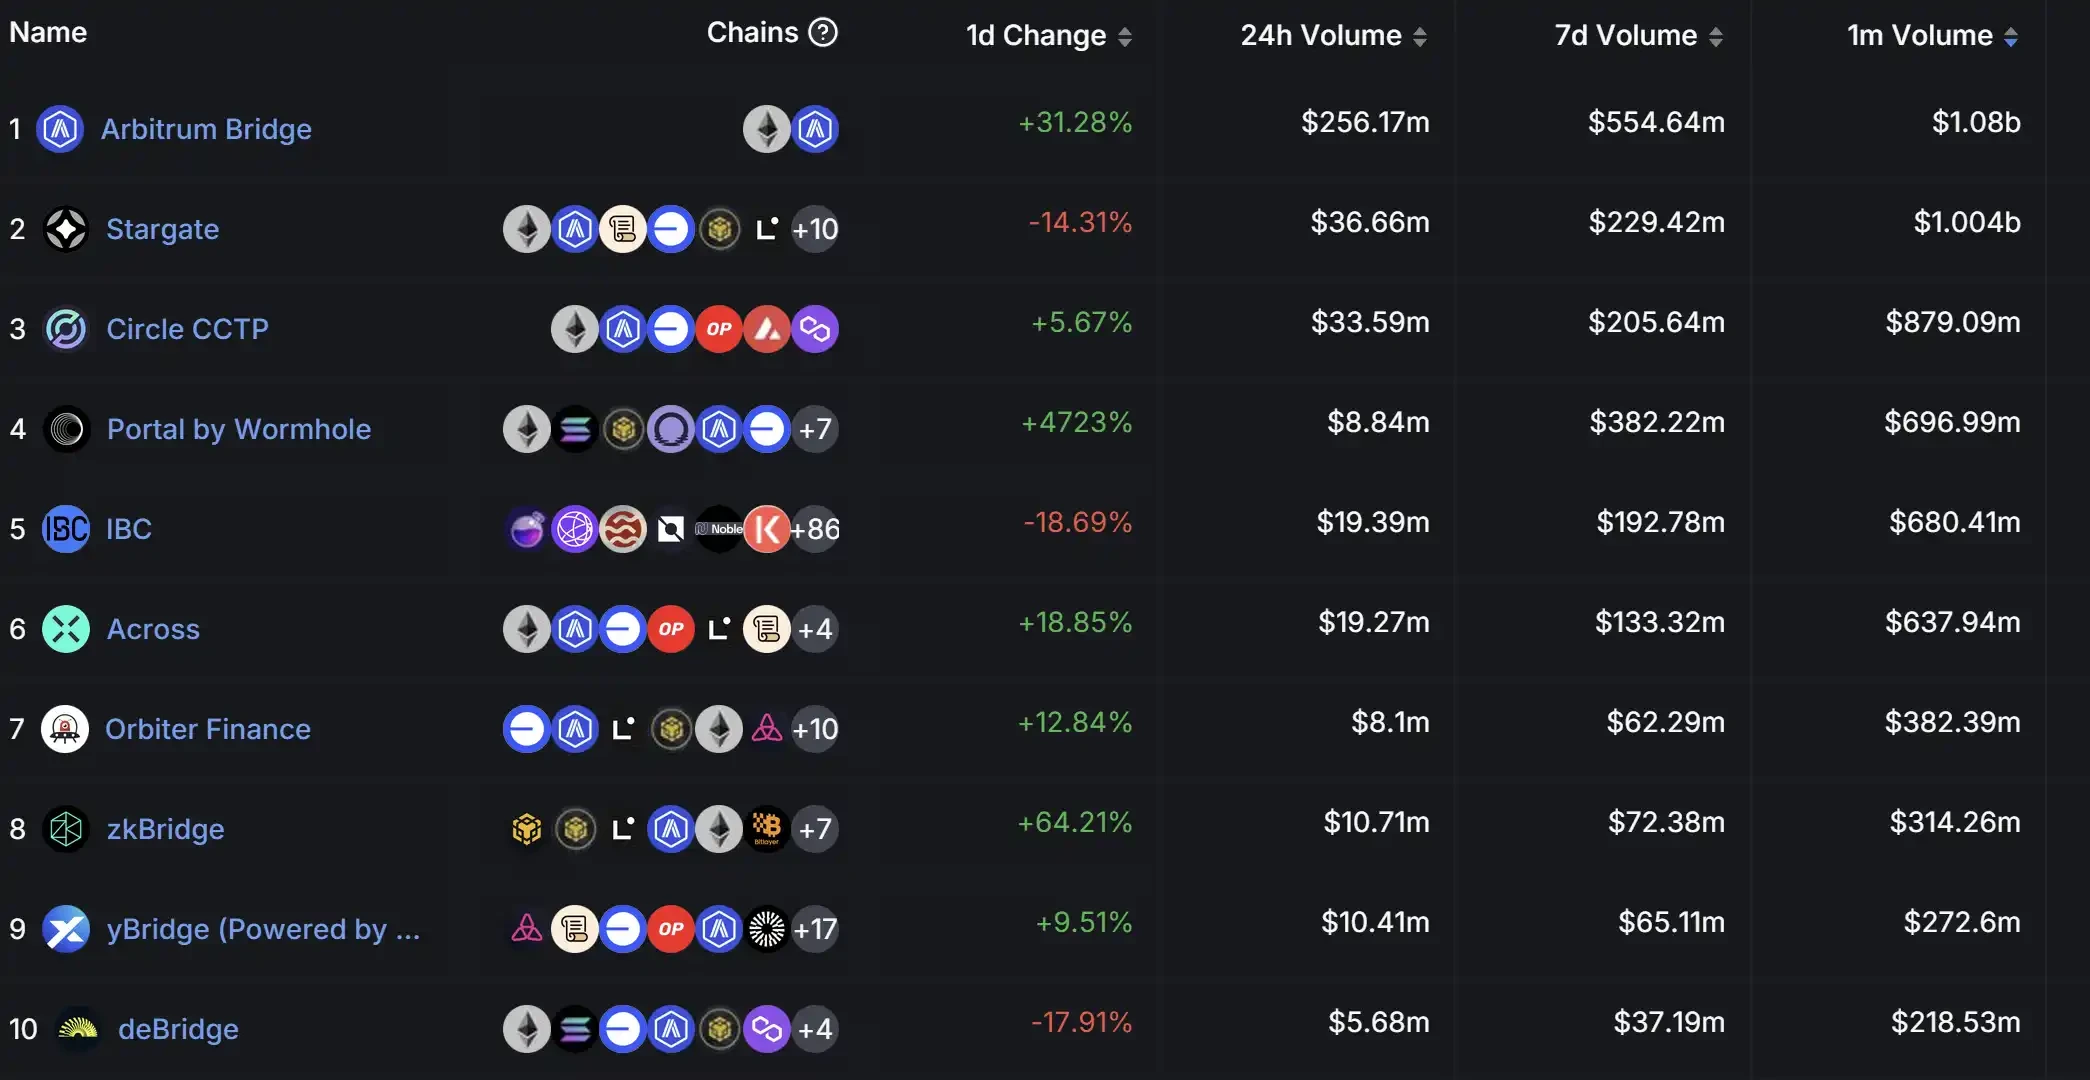
Data source: DeFiLlama
In addition to facilitating cross-chain interactions, Stargate also engages in building liquidity pools and staking mining. The pool model is similar to Across, where LPs need to provide corresponding liquidity on the target chain during the construction of full-chain cross-chain operations. Investors can provide liquidity as LPs to earn corresponding returns. On the other hand, users can stake LP tokens to receive $STG token rewards.
Stargate's revenue primarily comes from transaction fees charged for token transfers, with a fee of 0.06% for transfers of non-$STG tokens. LP and veSTG holders will receive 0.01% of the fee distribution, respectively.
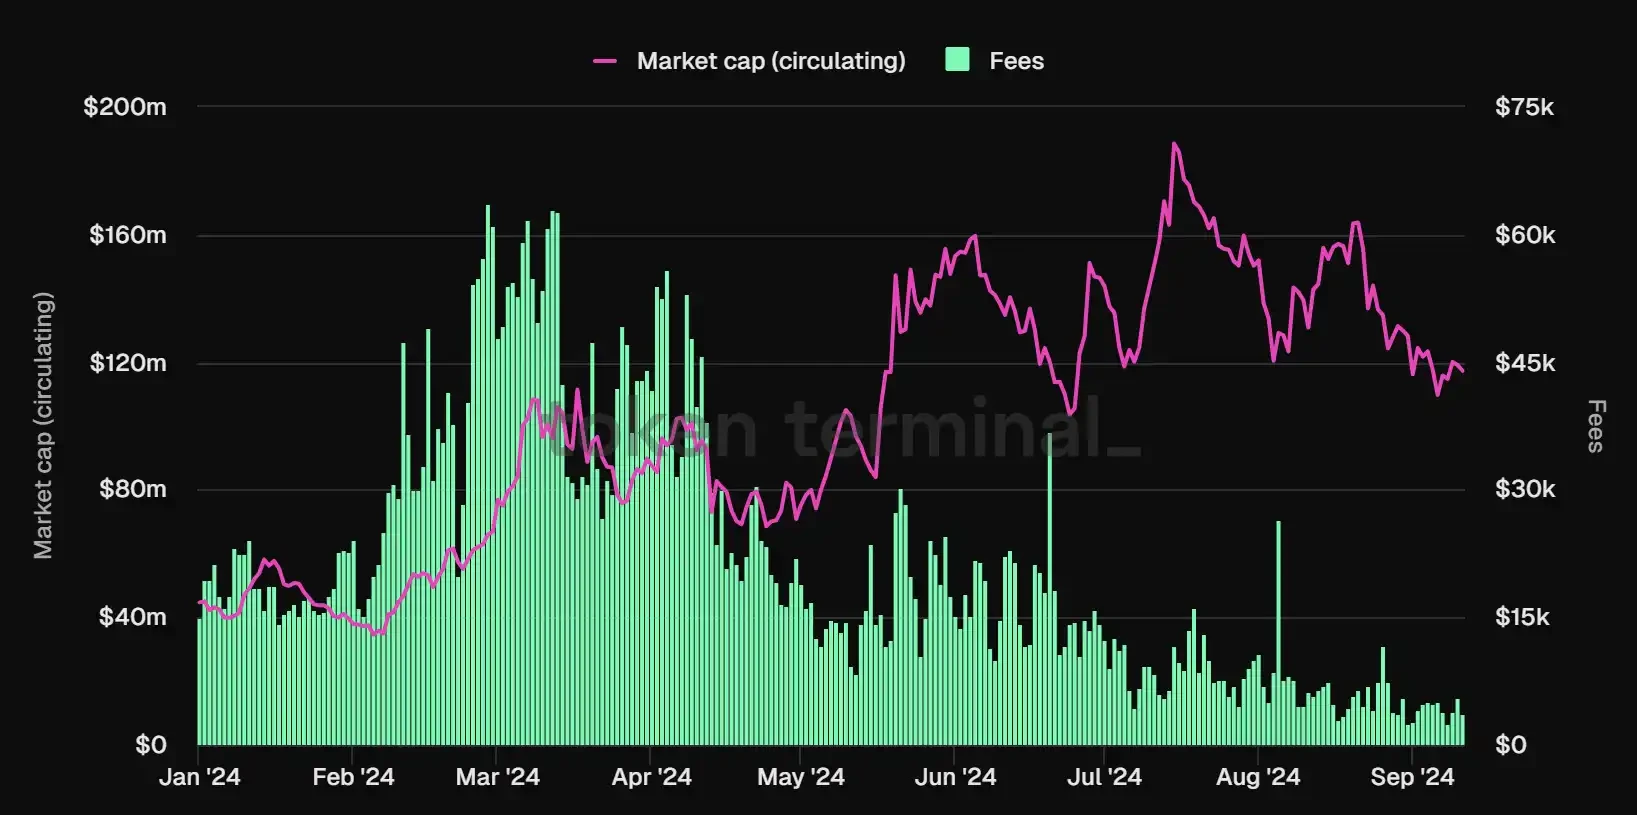
However, Stargate's transaction fees have been declining since the beginning of the year. They peaked at $3.34 million and have dropped to $196K in Q3. Nevertheless, compared to Across, Stargate's business flow remains substantial, with transaction volumes in the first two quarters maintained between $3 billion and $5 billion, but Q3 saw a severe decline, with only $226.82 million.
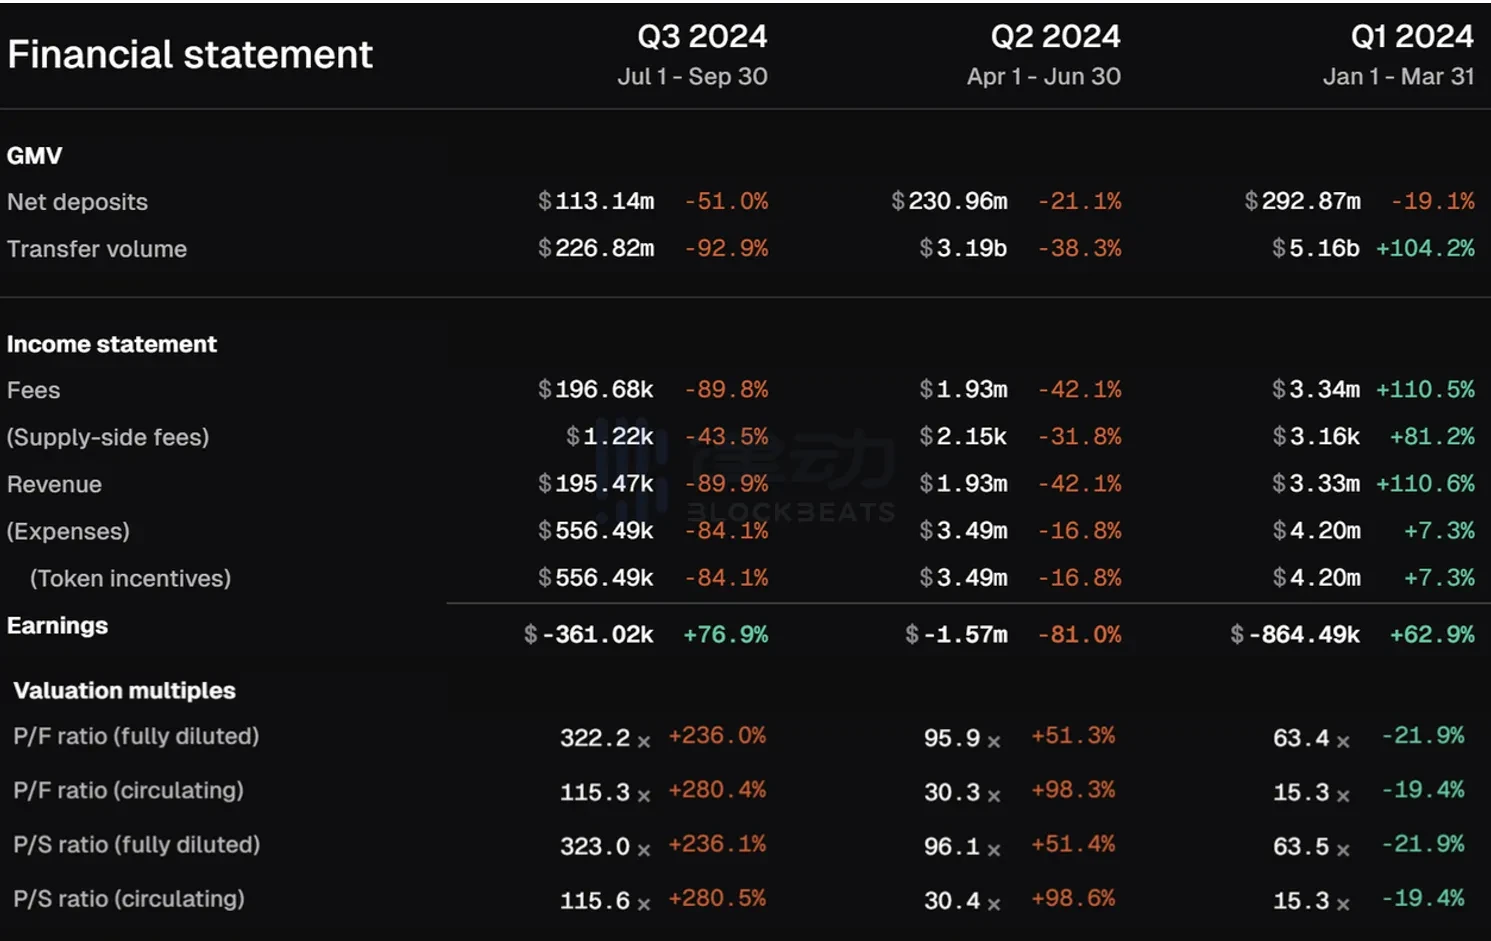
Stargate various financial indicators, data source: TokenTerminal
The protocol fees collected by Stargate began to plummet after May this year, with total fee revenue in Q3 evaporating by 90% compared to Q2. However, the circulating market cap of $STG has not decreased alongside the total fees, remaining around $120 million. This has led to a surge in the P/F ratio in Q3, indicating that the price of $STG is in a severely overvalued state.
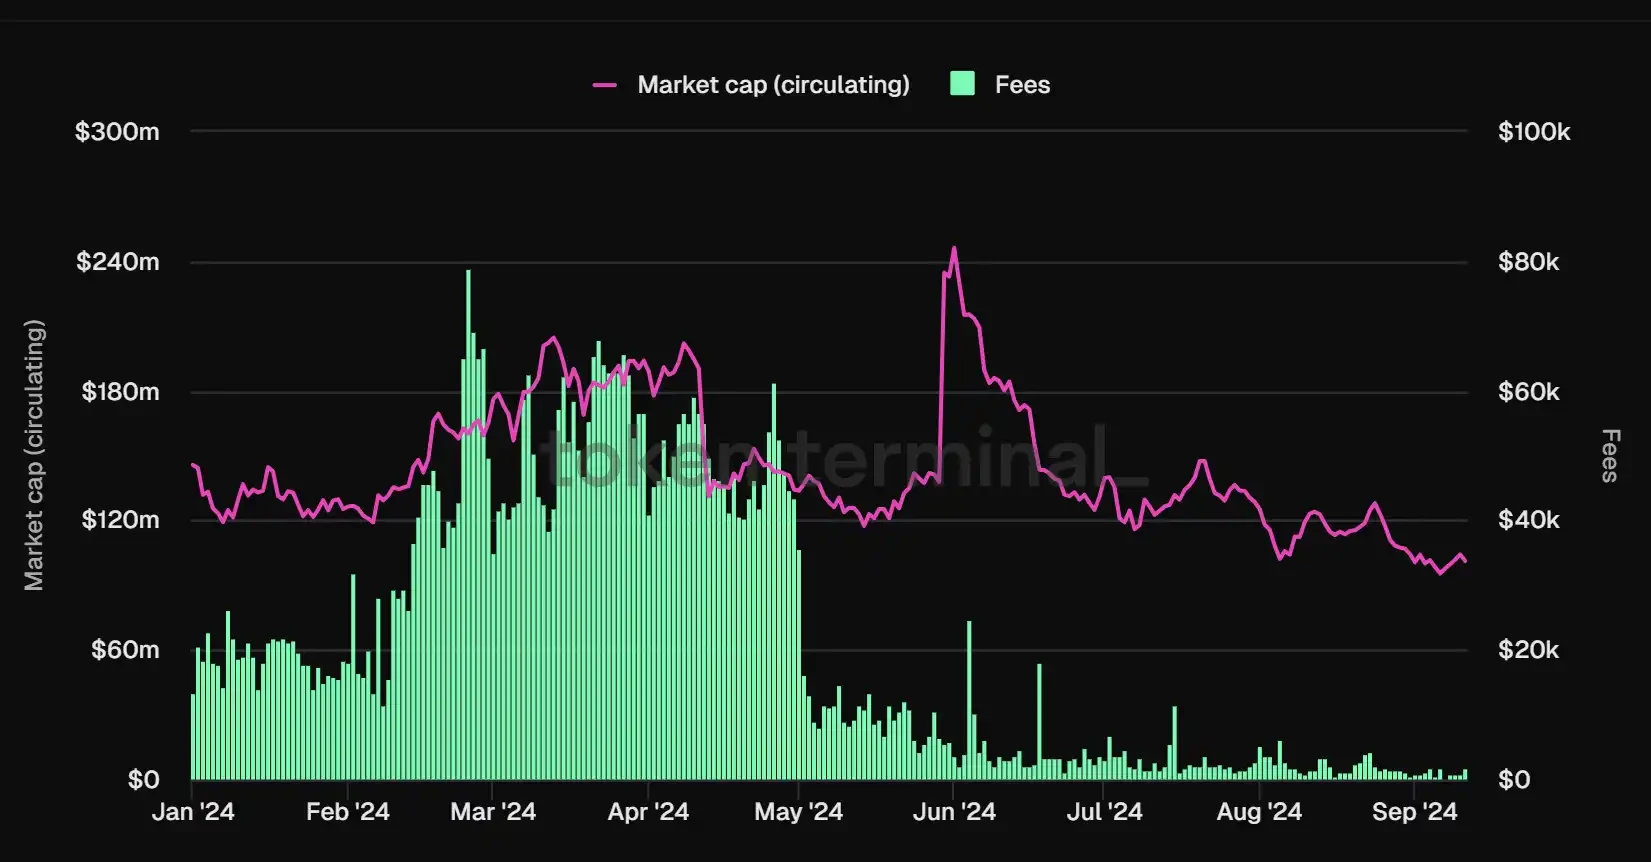
Comparison of Stargate transaction fees and circulating market cap, data source: Tokenterminal
Compared to $ACX, Stargate's native token $STG adopts a ve model design in its token economics, which provides stronger value capture capabilities. Token holders can stake $STG to obtain veSTG, allowing them to vote on fee standards, liquidity pool adjustments, and other matters related to Stargate, thus participating in community governance. Additionally, as the staking duration of STG tokens increases, users can earn extra veSTG rewards, thereby increasing their weight in community governance, accelerating a positive feedback loop. On the other hand, users can provide $STG to the platform to increase liquidity or earn $STG rewards through mining. Overall, the market cap of $STG remains relatively stable.
Storage
If Web3 can achieve true Massive Adoption in the near future, decentralized data storage will be crucial and become an indispensable part. Although the overall data storage scale of Web3 is negligible compared to traditional Web2 storage, this also means that future Web3 storage projects have a higher ceiling and a huge existing market. In the storage infrastructure sector, we have chosen to compare and analyze two major projects: Filecoin and Arweave.
Filecoin
Filecoin adopts a pay-per-use model, unlike Arweave's one-time purchase. Filecoin's storage providers (i.e., miners) mine $FIL by providing storage services to Filecoin users or committing storage capacity on the network. To encourage long-term network coordination, 25% of the block rewards earned by miners can be used immediately, while 75% will be unlocked linearly over 180 days. Additionally, if users need to use storage services, they must pay a certain fee in $FIL. Similarly, when retrieval and recovery are needed later, users also need to pay a fee.
Overall, Filecoin's revenue mainly consists of user interaction GAS and penalties imposed on miners, while the token rewards of $FIL for miners represent the primary expenditure under its business model. Meanwhile, Filecoin is actively transitioning to on-chain computing, having developed FVM to facilitate developers in building applications on Filecoin and completing ecosystem construction.
According to data from Messari, the number of users with storage capacities greater than 1,000 TiBs on Filecoin is continuously increasing, with these users typically being enterprise-level users who have large data storage needs and high retention.
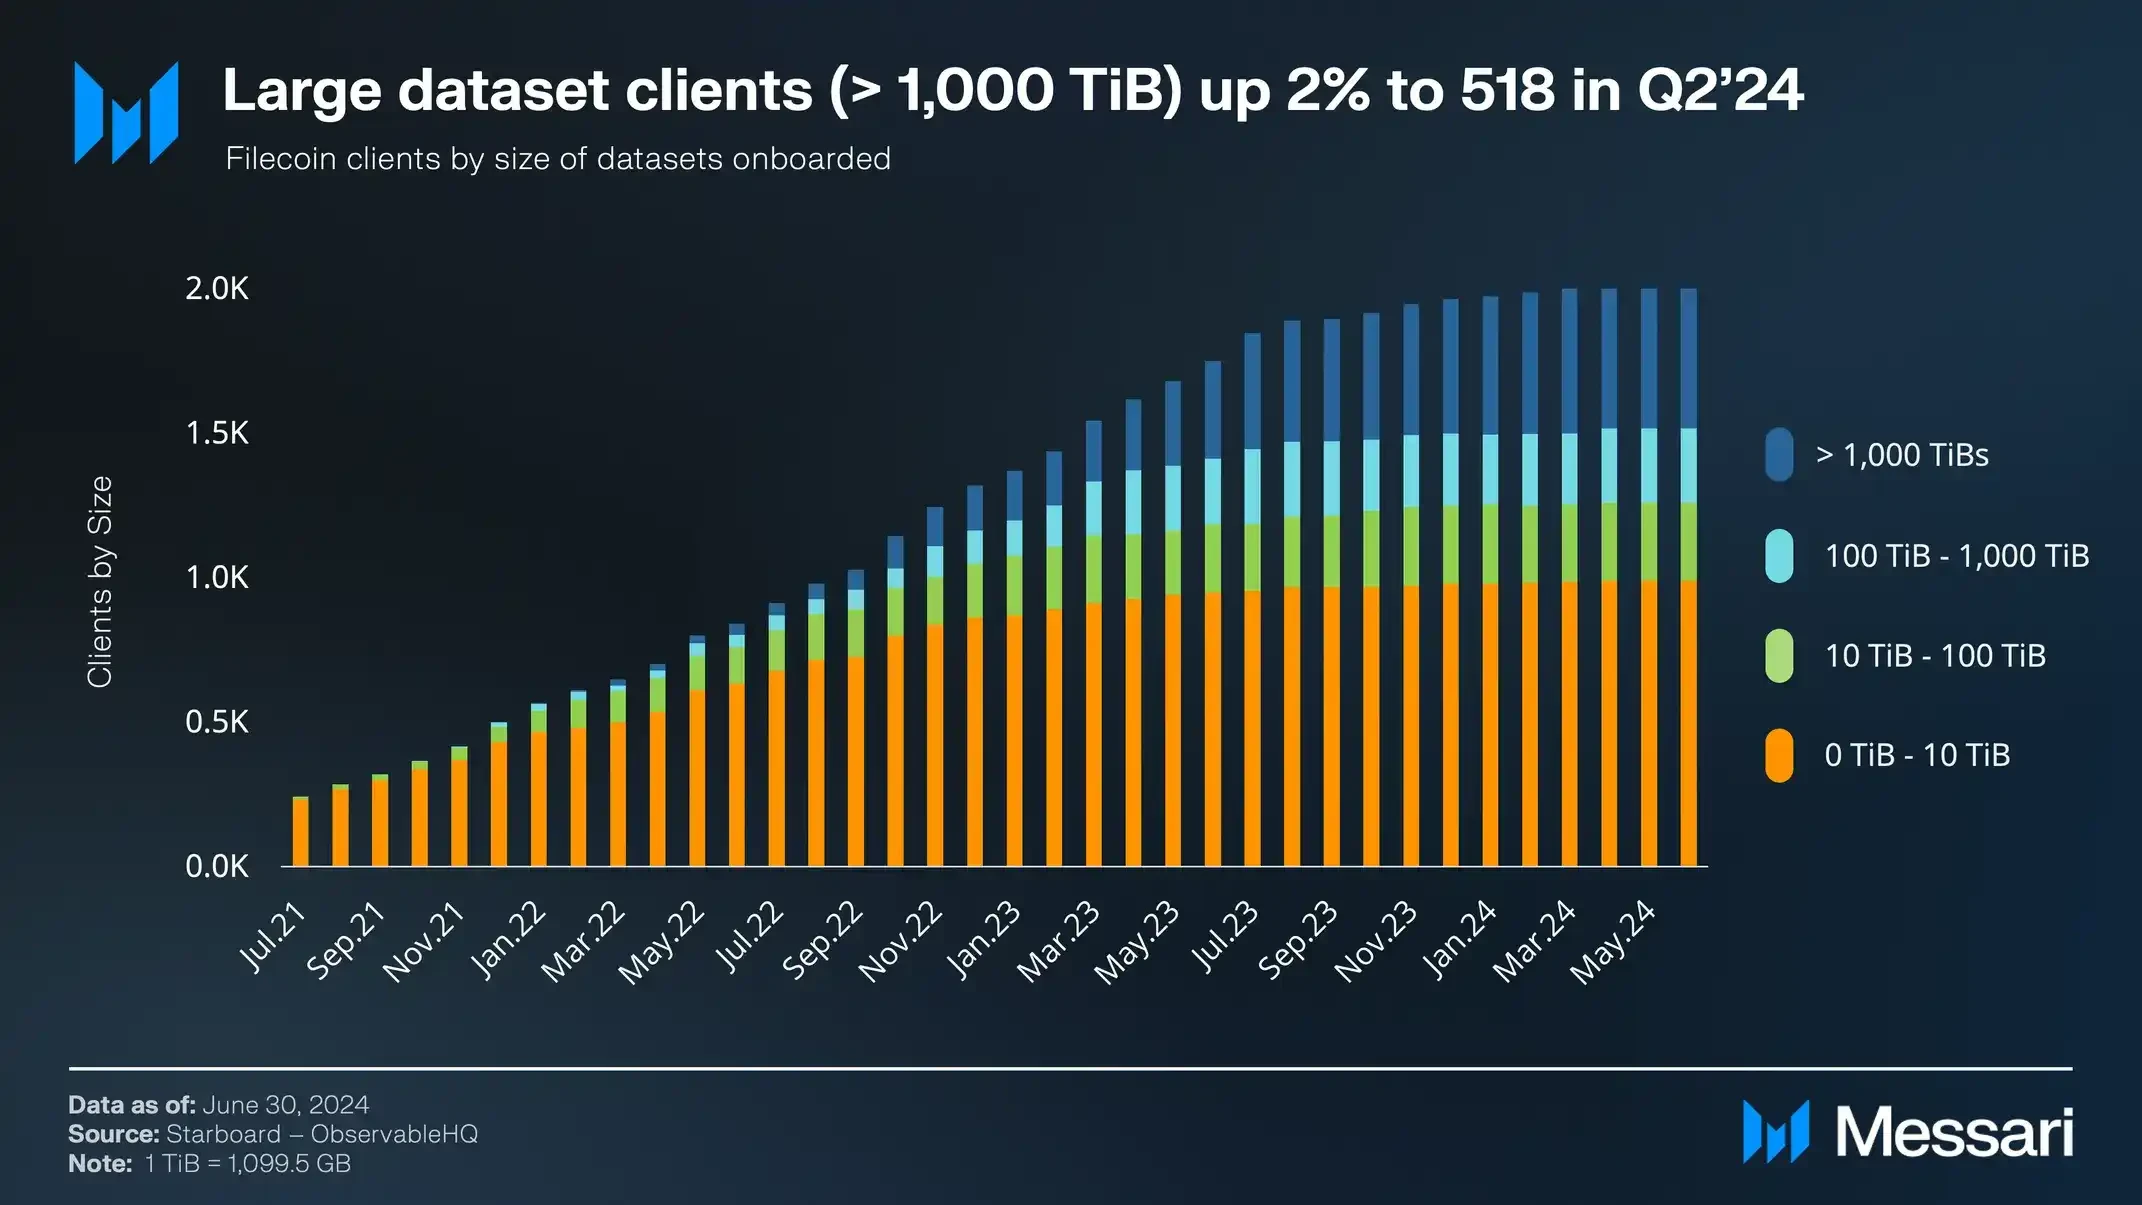
Changes in the number of Filecoin users with storage greater than 1,000 TiBs, data source: Messari
According to TokenTerminal data, Filecoin's fee revenue has shown a continuous increase from the beginning of the year to the end of June, with an increase of 151%. However, after entering Q3, the overall fees sharply decreased. On the expenditure side, token incentives as block rewards began to accelerate their decline after the end of Q1. This situation is not only due to the spiral design of Filecoin's token economics but is primarily reflected in the increasing loss of miners. According to data from Filscan, the trend of active storage providers "running away" has been difficult to conceal since the end of 2023. From a traditional valuation perspective, the decrease in fees has led to an inflated P/F Ratio in Q3.
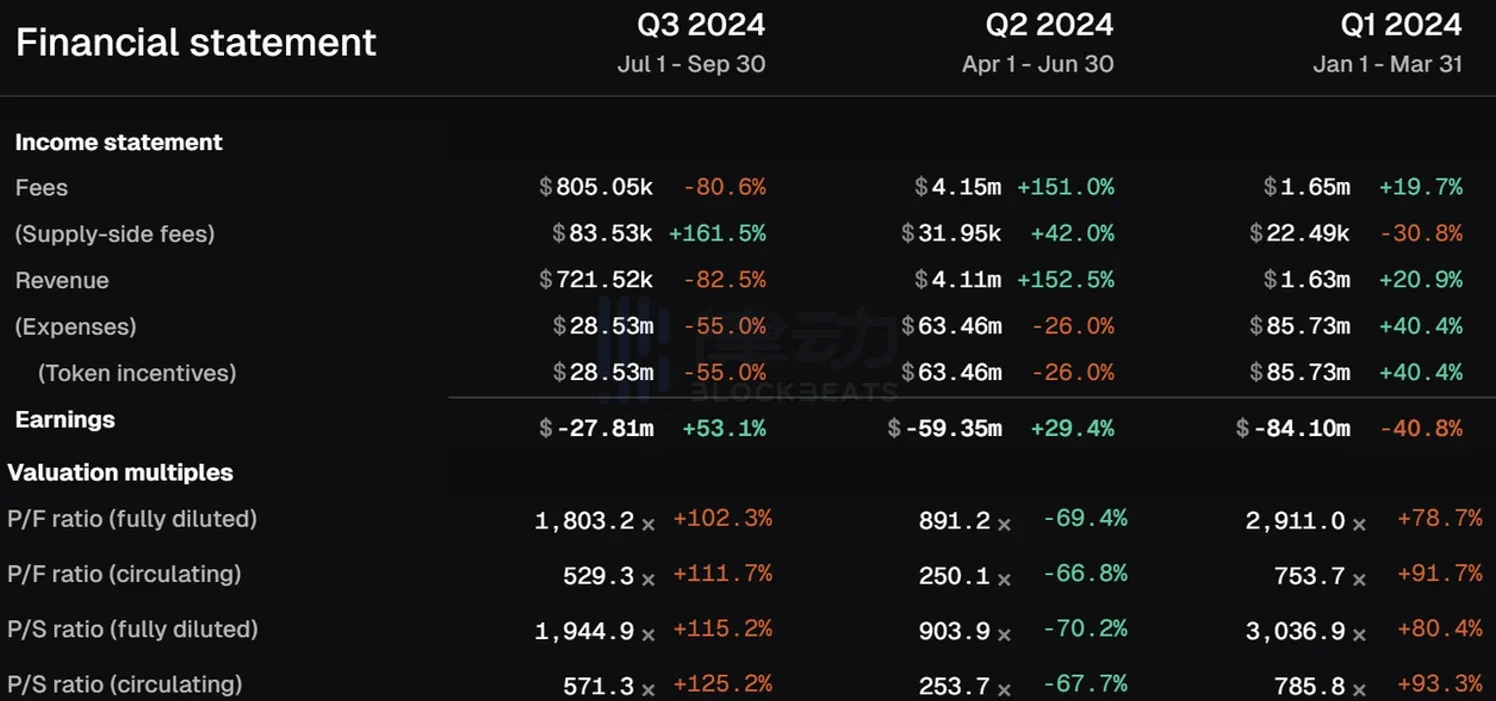
Changes in various financial indicators of Filecoin, data source: TokenTerminal
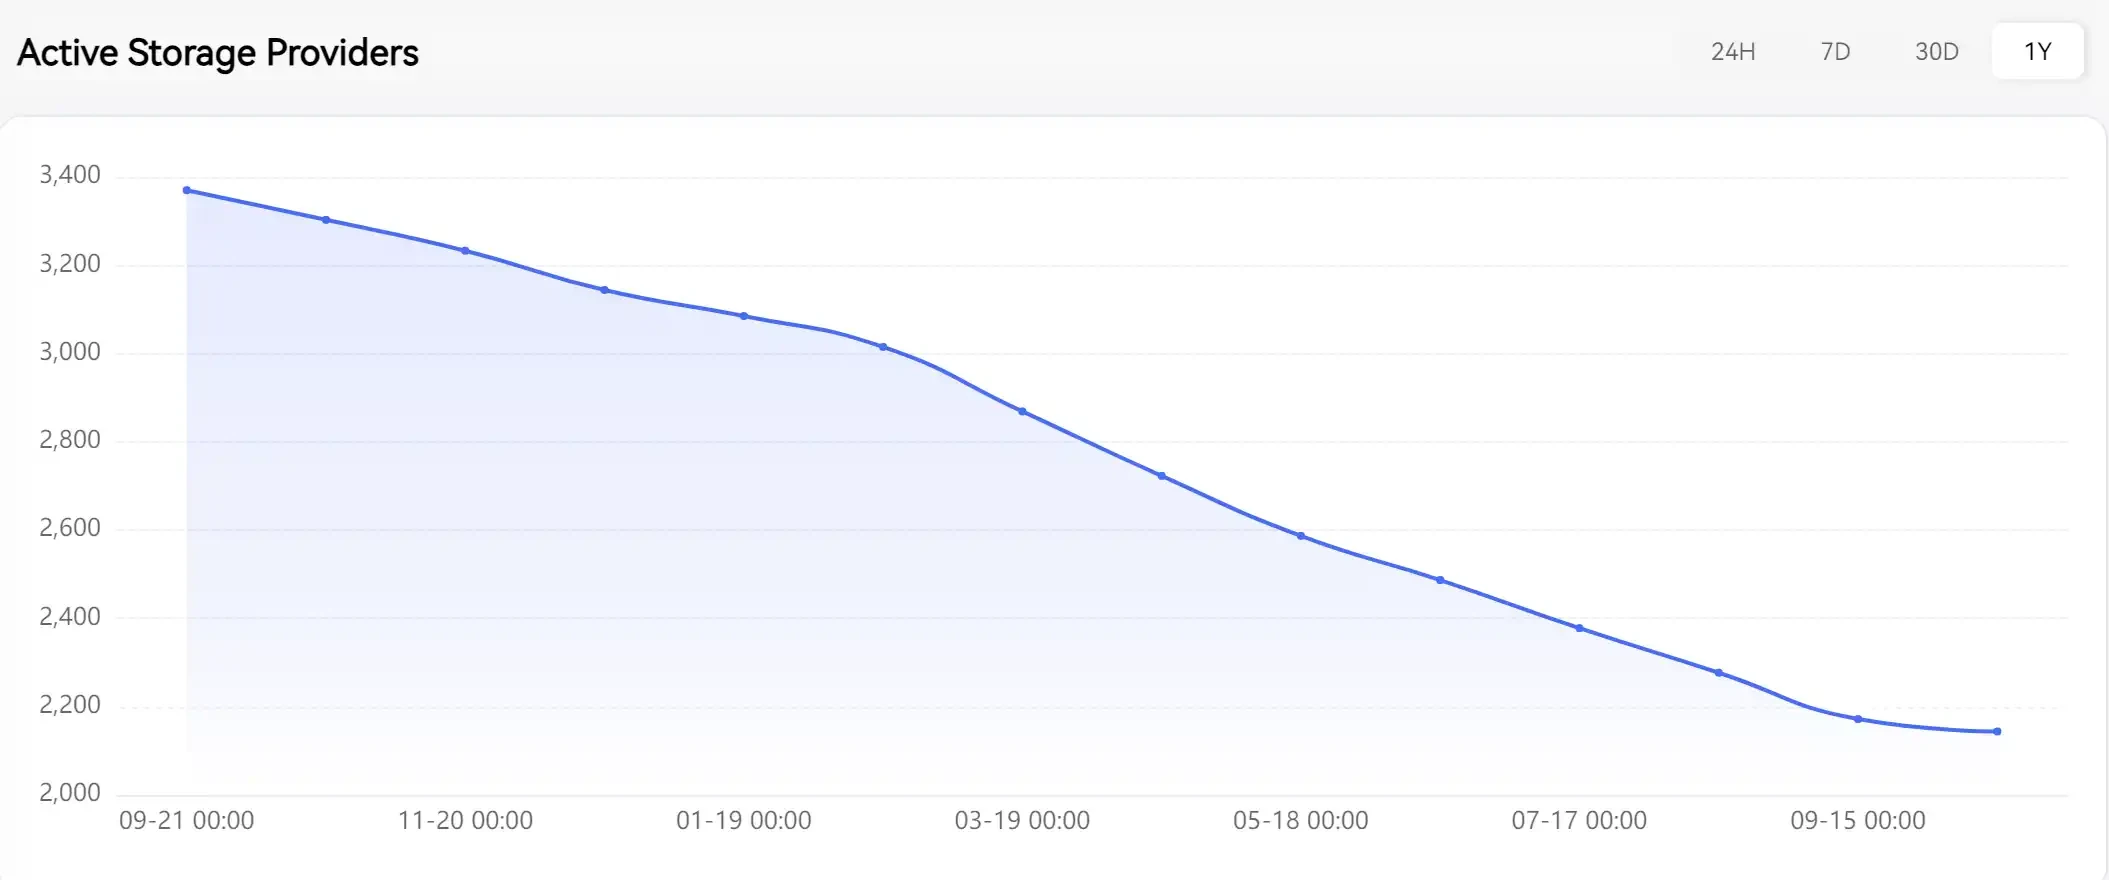
Statistics of active storage providers, data source: Filecoin official website
In terms of token value capture, its token $FIL not only serves as GAS within the Filecoin network but can also be used as token incentives for "miners" providing storage services. Moreover, "miners" are required to stake $FIL tokens to ensure network security and service quality when providing storage services. The overall token economics design of Filecoin presents a spiral ascent model.
Filecoin's price during the last bull market was quite exaggerated, peaking at $200 per $FIL, with its FDV reaching an astonishing $380 billion. The reasons for the price surge include the relatively low unlocking volume of $FIL and the fact that miner rewards are denominated in $FIL. When the token price rises, it attracts more miners to enter the market, leading them to purchase more $FIL for staking. Thanks to the design of the token economics, this ultimately resulted in a surge in the price of $FIL.
However, after the recent Bitcoin ETF approval brought a minor bull market, the price of $FIL did not experience the explosive growth seen in the last bull market. As of the completion of this writing, the price of $FIL has only increased by 4.6% over the past year, while its competitor Arweave's native token $AR has seen a price increase of 313% over the same period.
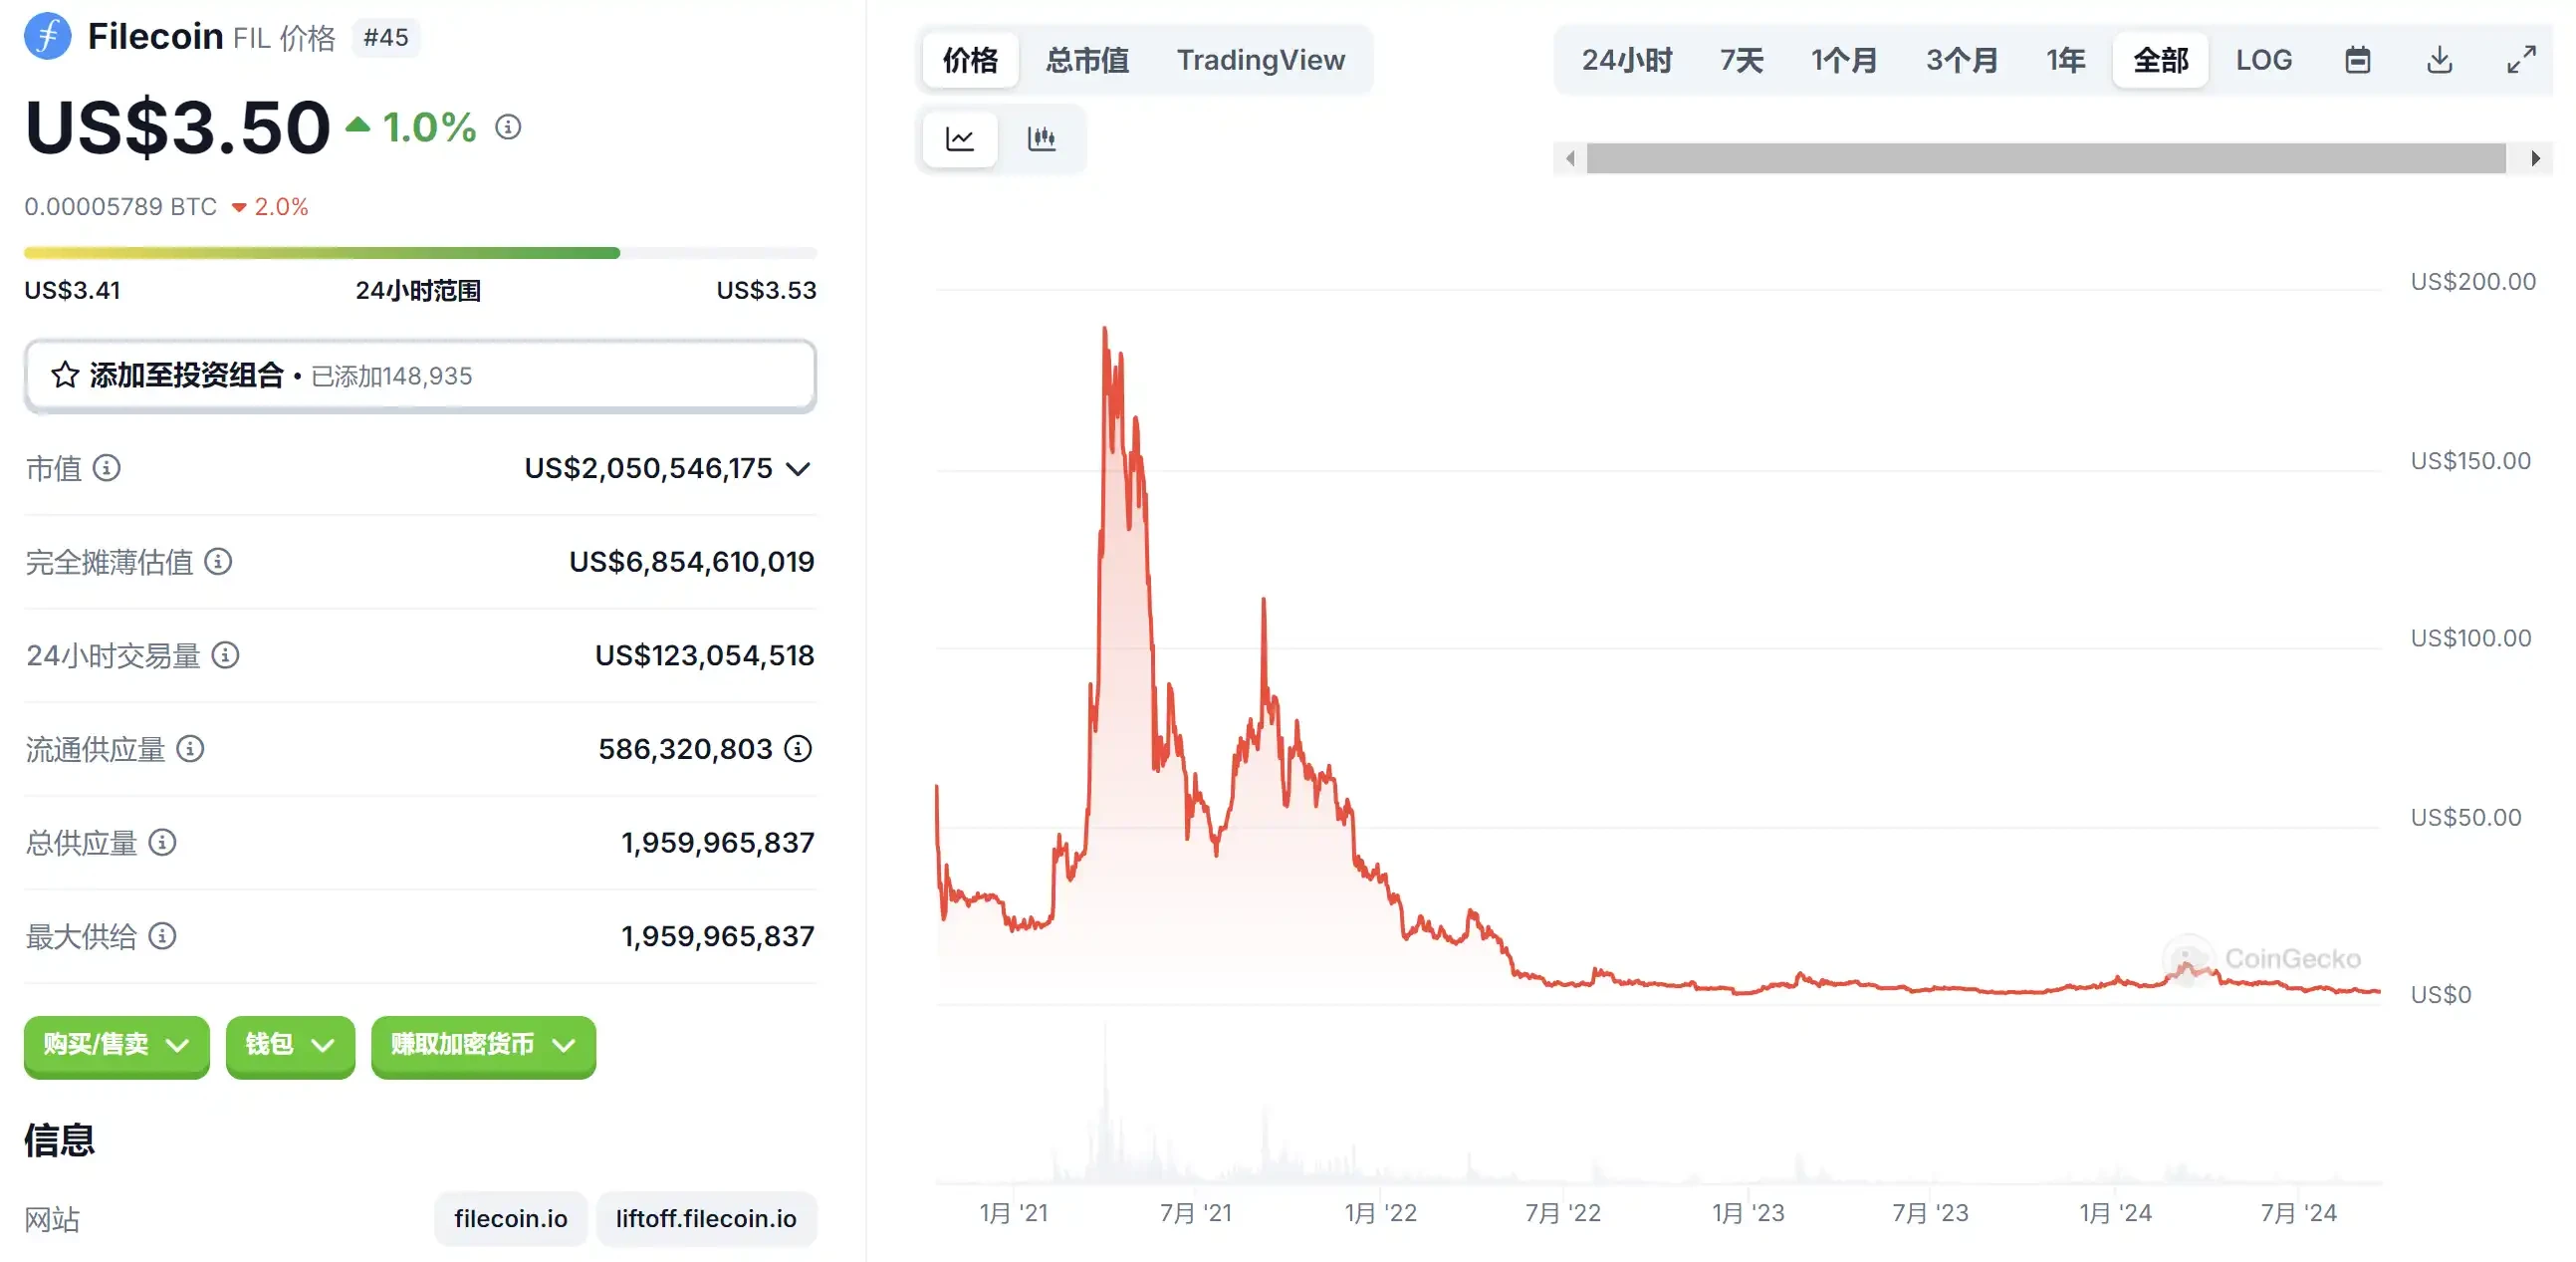
Data source: CoinGecko
On one hand, the overall market environment is not as expected; on the other hand, unlike $AR, which is close to full circulation, $FIL has a liquidity of about 30%, with a large number of unlocked tokens putting some selling pressure on the overall token price. Investors need to carefully consider between investing in projects and their tokens.
Arweave
Arweave differs from Filecoin in that its selling point is achieving on-chain decentralized permanent storage of user data. The Arweave protocol is built on top of the HTTP protocol, allowing users to access Arweave through Web2 browsers like Google Chrome and enabling individuals with idle hard drive space to store data in exchange for AR tokens.
Arweave adopts a one-time payment business model, where users only need to pay a corresponding fee based on the storage capacity of the data to achieve permanent storage. A portion of the one-time fee paid by users goes towards the initial storage cost, while another portion is donated to the Arweave fund for future storage costs.
Although the amount of data uploaded by Arweave users has remained on par with the last bull market, even slightly surpassing it, peaking at 8.79T/month, it still falls short of expectations when compared to Filecoin's user-uploaded data. According to Starboard data, Filecoin's daily upload volume has reached the level of 1.5E (where 1 EiB = 1024 TiB), showing a significant difference in storage scale between Arweave and Filecoin.
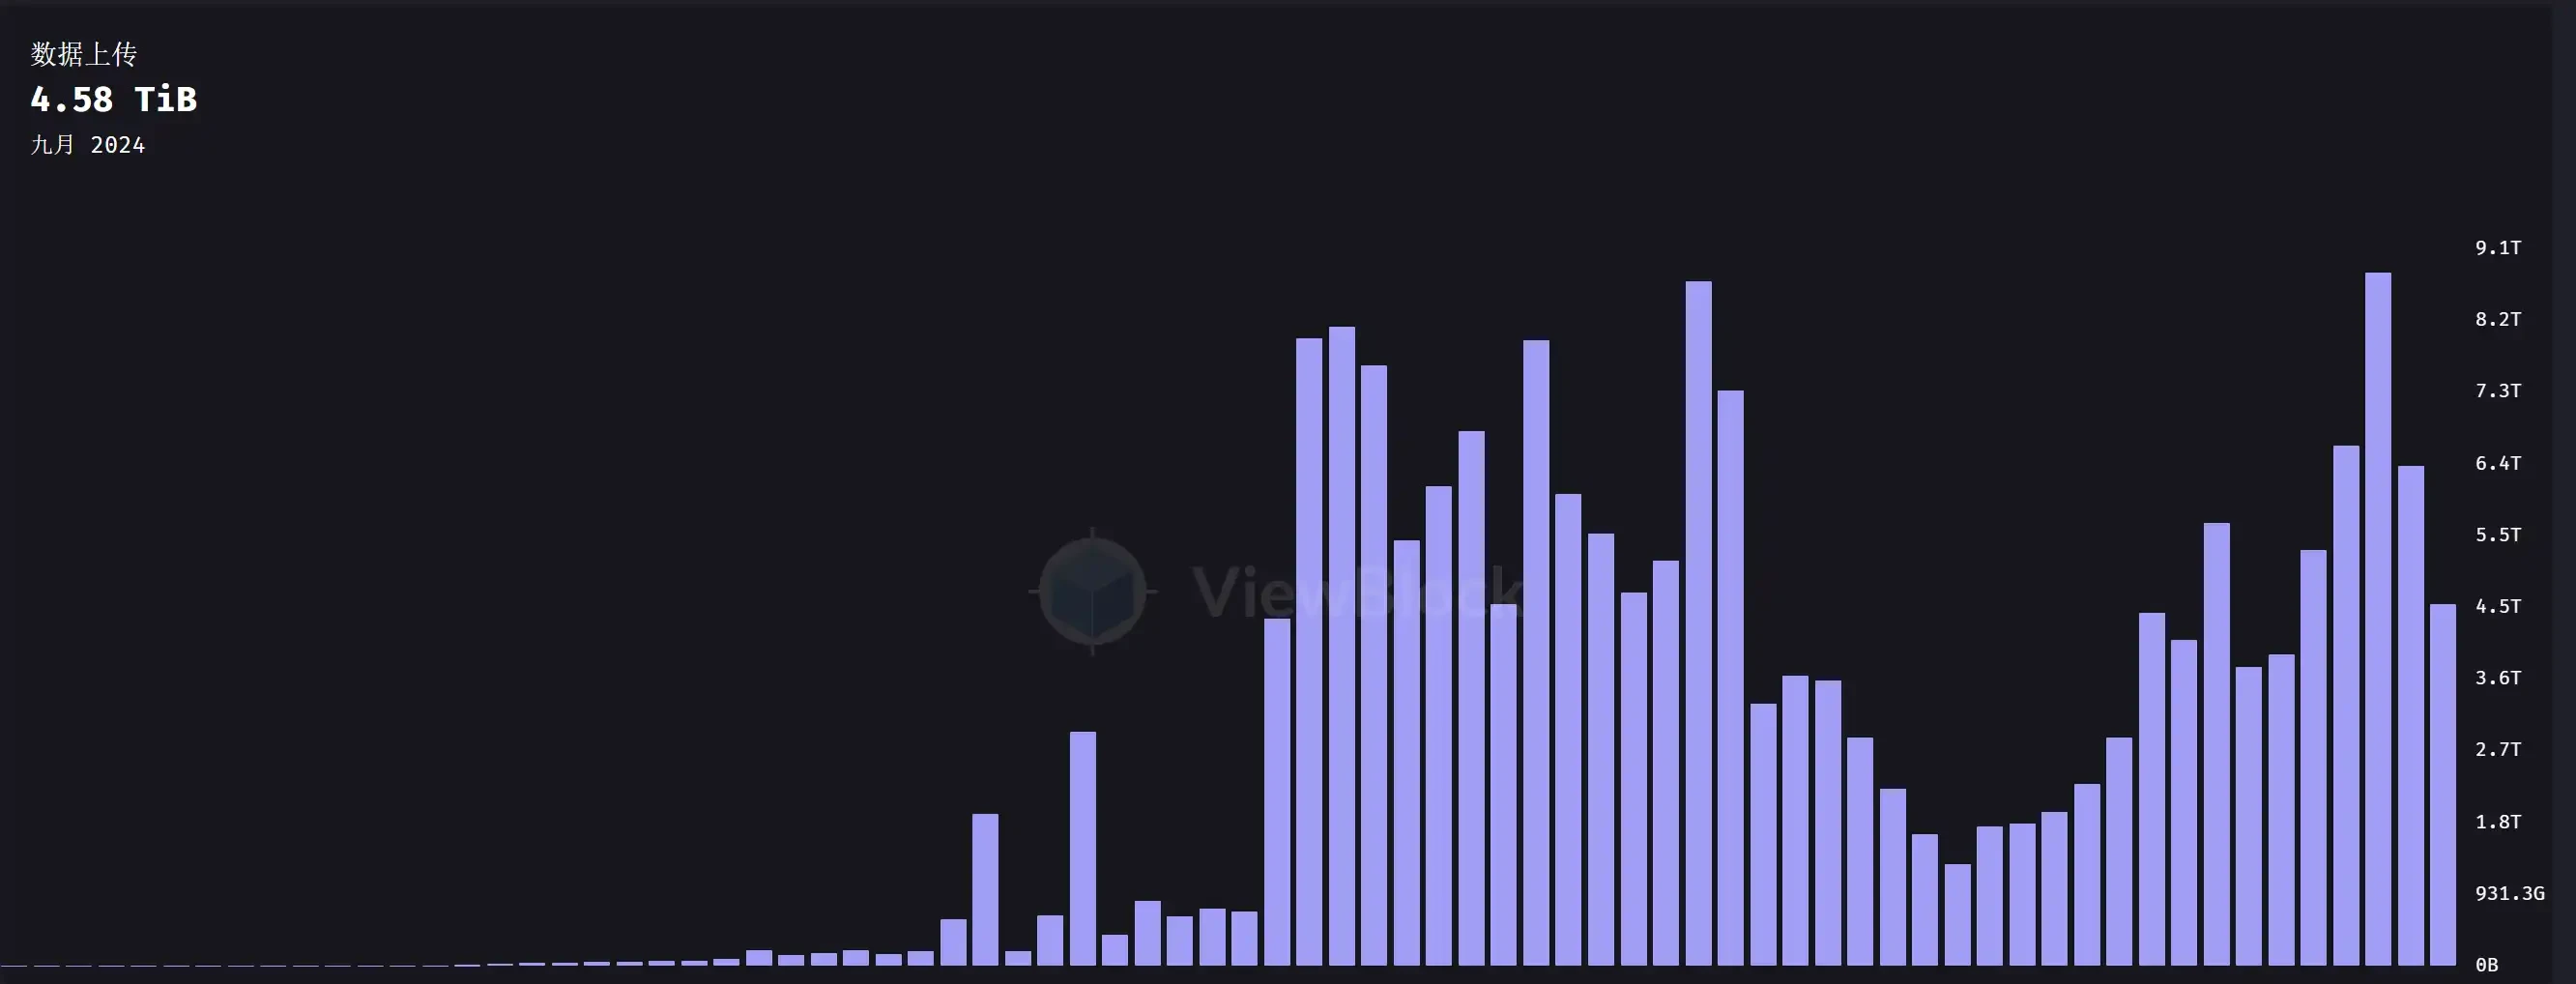
Daily upload data volume of Arweave, data source: ViewBlock
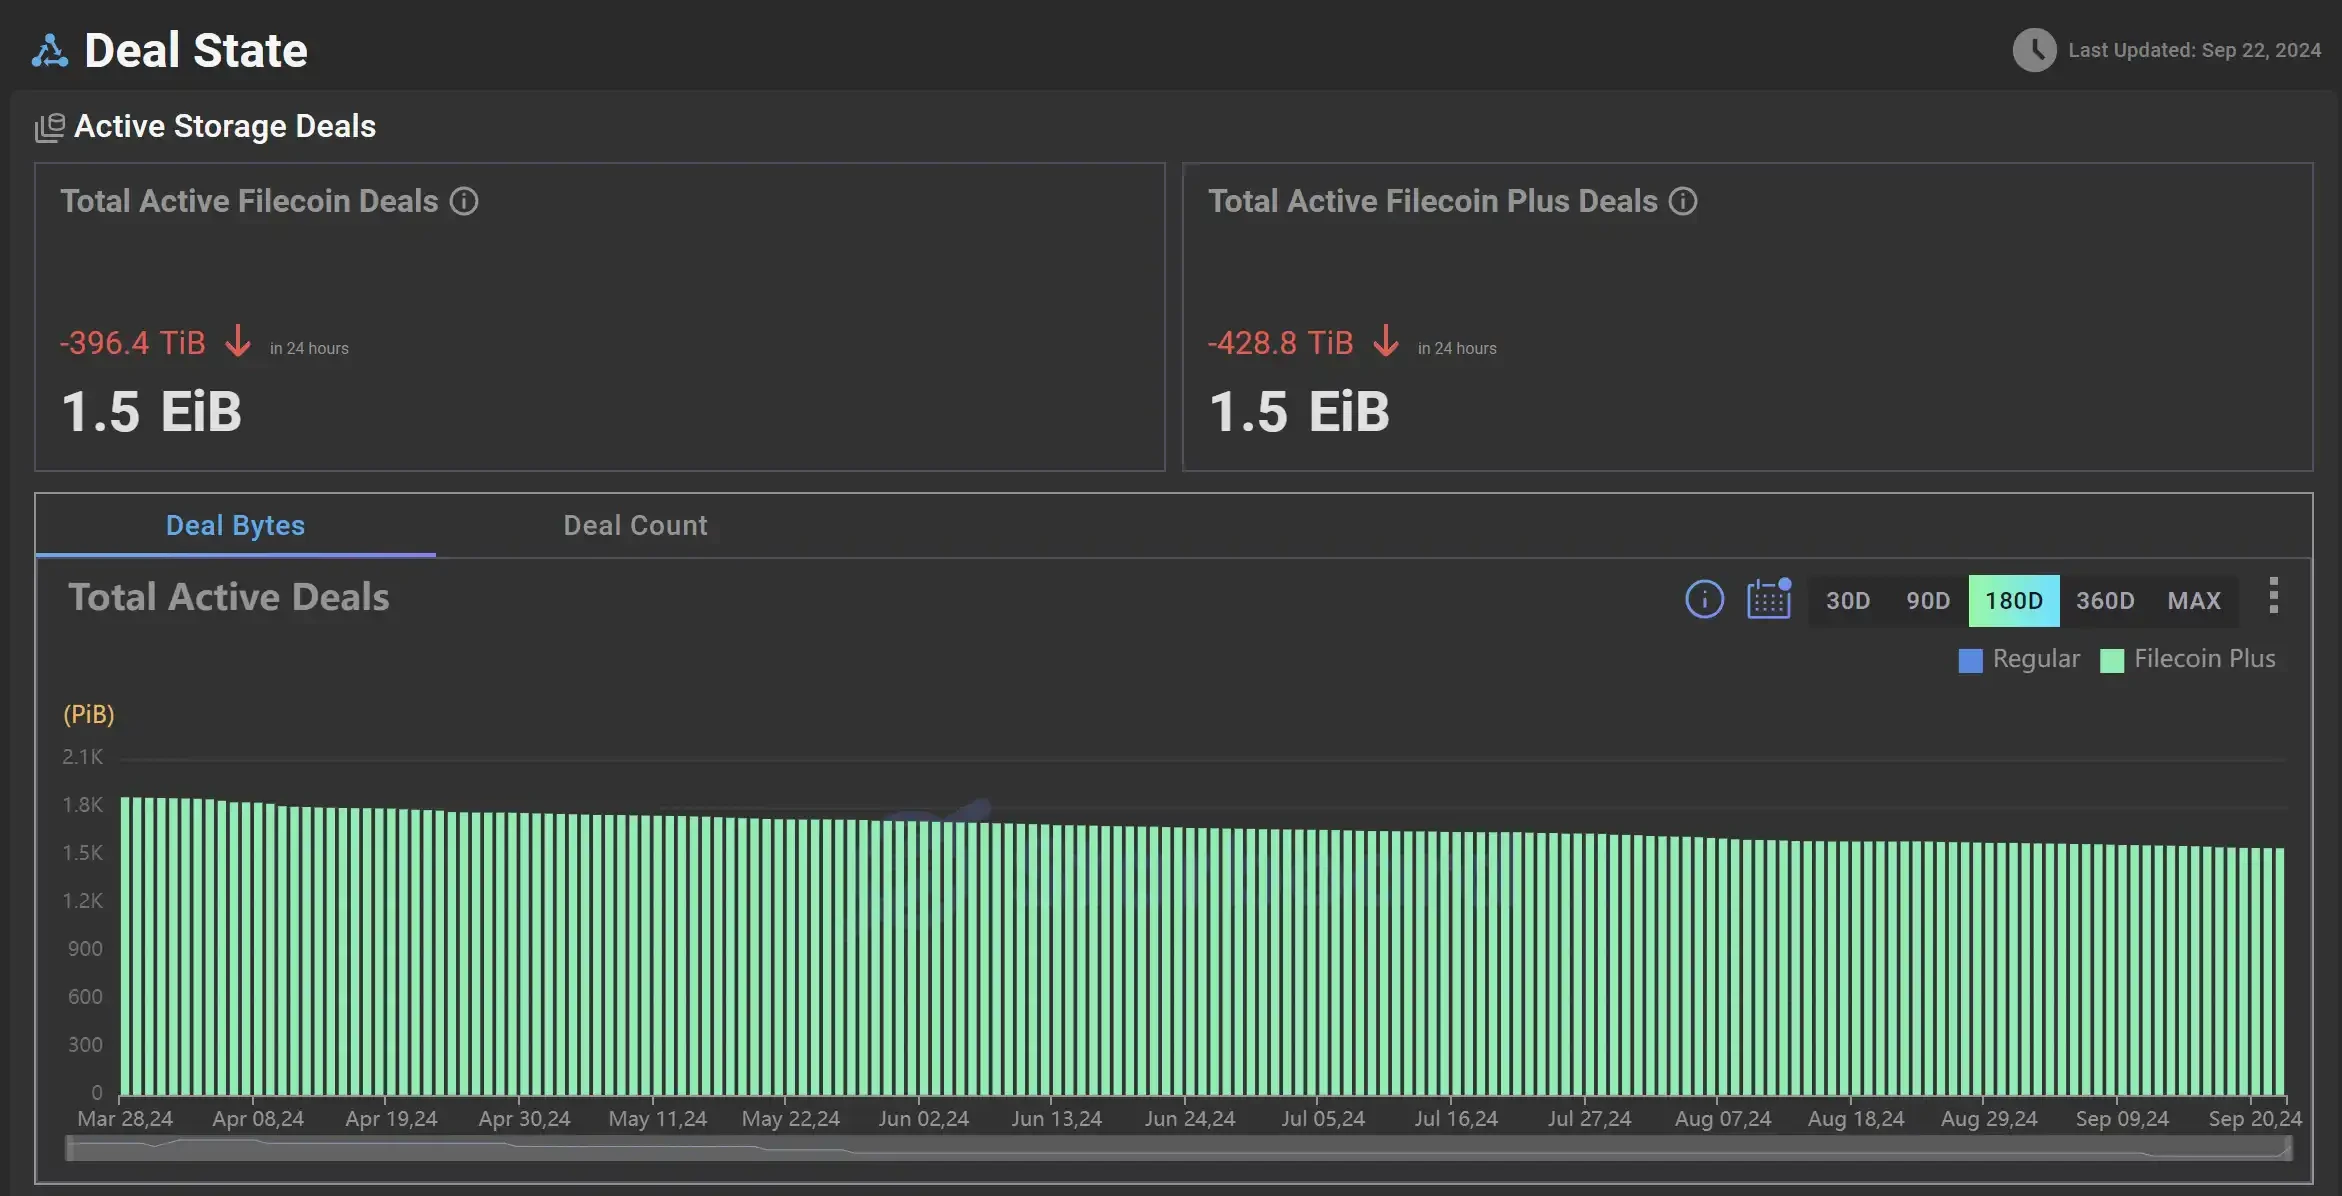
Daily upload data volume of Filecoin, data source: Starboard
Estimating by month, taking Arweave's average storage of 4T as an example, according to calculations from the ar-fee website, storing 4T of data would cost approximately $70,000. According to CoinGecko data, the storage cost for 4T of data on Filecoin is $0.76 per month. With the same expenditure of $70,000, using Filecoin allows for storage for 7,675 years. Compared to "permanent storage," 7,675 years is clearly negligible, but for a business or individual, it is almost equivalent to eternity.
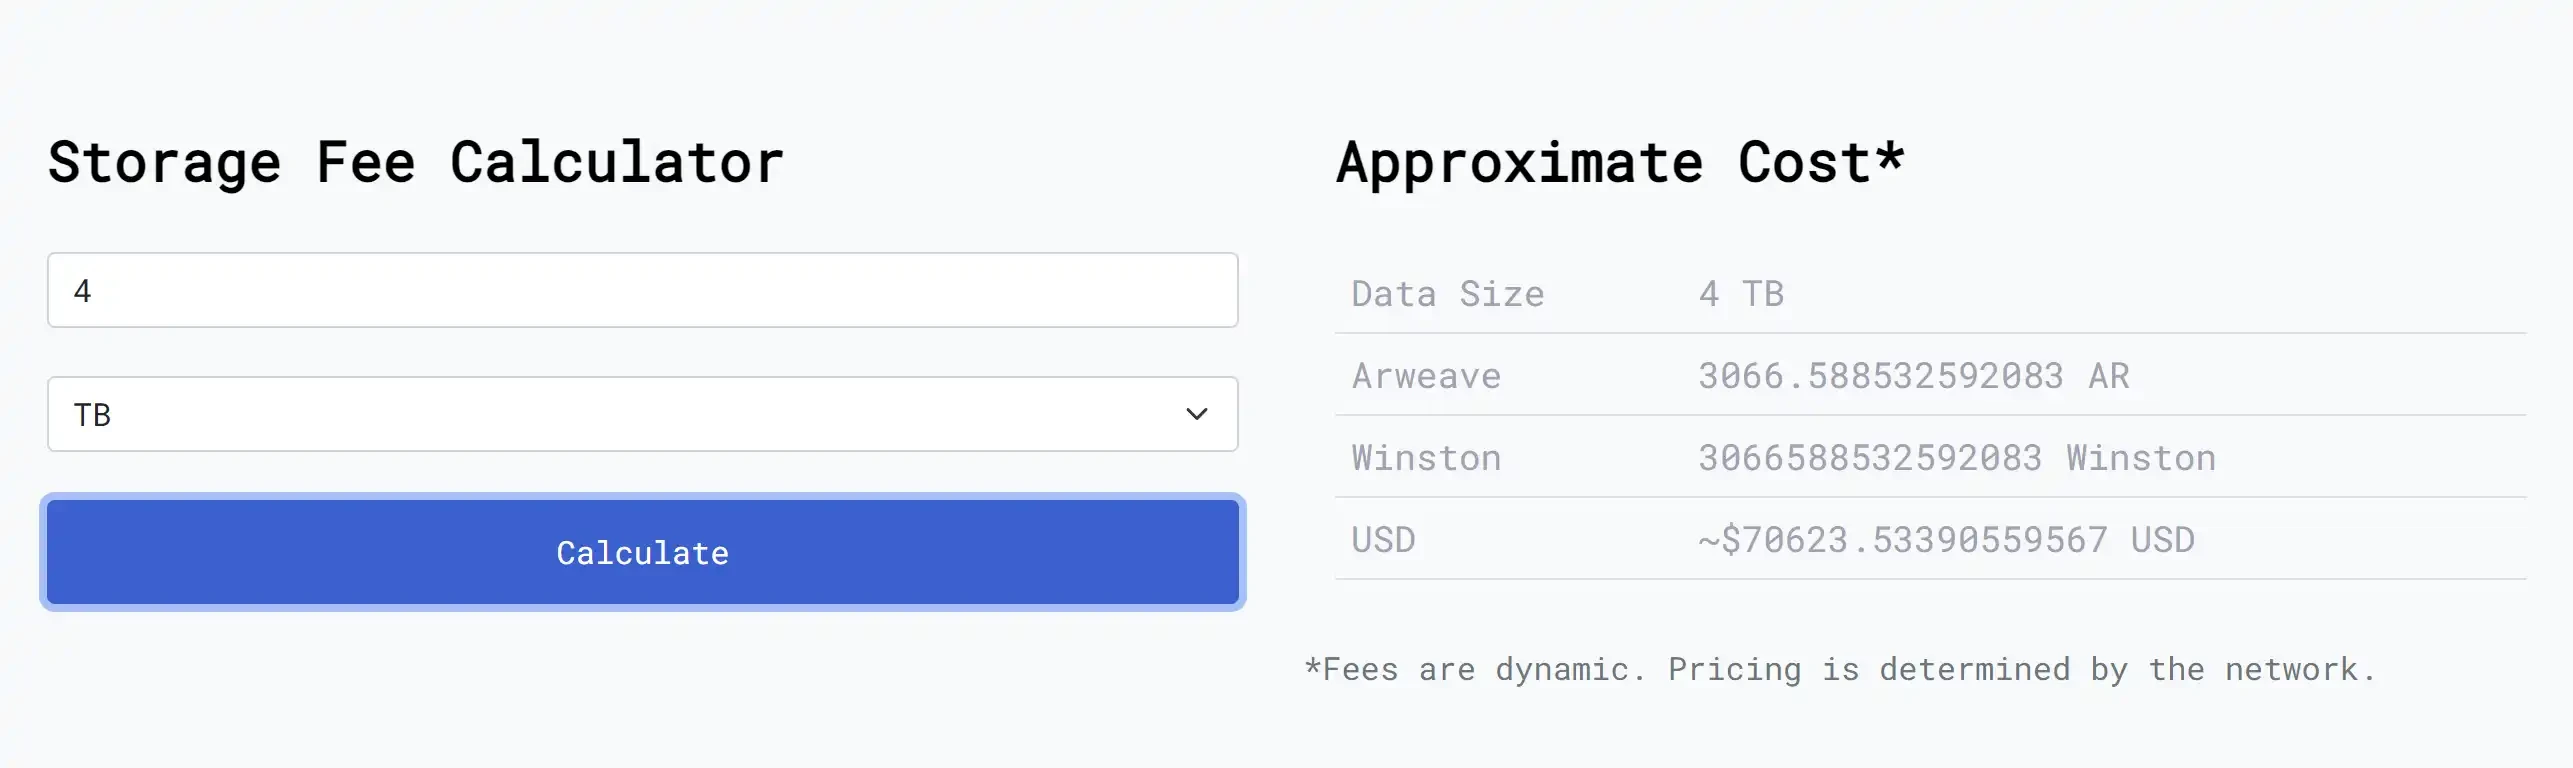
Arweave storage cost calculation, data source: https://ar-fees.arweave.dev/
When we re-examine Arweave's "one-time payment, permanent storage" business model, this narrative is not particularly appealing from a fundamental logic perspective. Firstly, Arweave's essence is similar to a "time capsule," targeting small and beautiful projects. It is not attractive to large enterprises, which typically need to store private information rather than public data. On the other hand, from a cost perspective, many of a company's data do not require such expensive storage fees for permanent storage, making Filecoin's storage solution more cost-effective. Therefore, fundamentally, Arweave struggles to attract large clients, which is why its data upload scale remains at 4T.
Although Arweave has a limited audience and a relatively low product ceiling compared to Filecoin, from a micro data perspective, if priced in terms of tokens, Arweave's transaction fees are only slightly lower than during the last bull market. In September 2021, the transaction fee was 4,468 $AR, valued at approximately $223,400 (50 * $4,468); in August 2024, the transaction fee was 6,685 $AR, valued at approximately $167,125 (25 * $6,685).
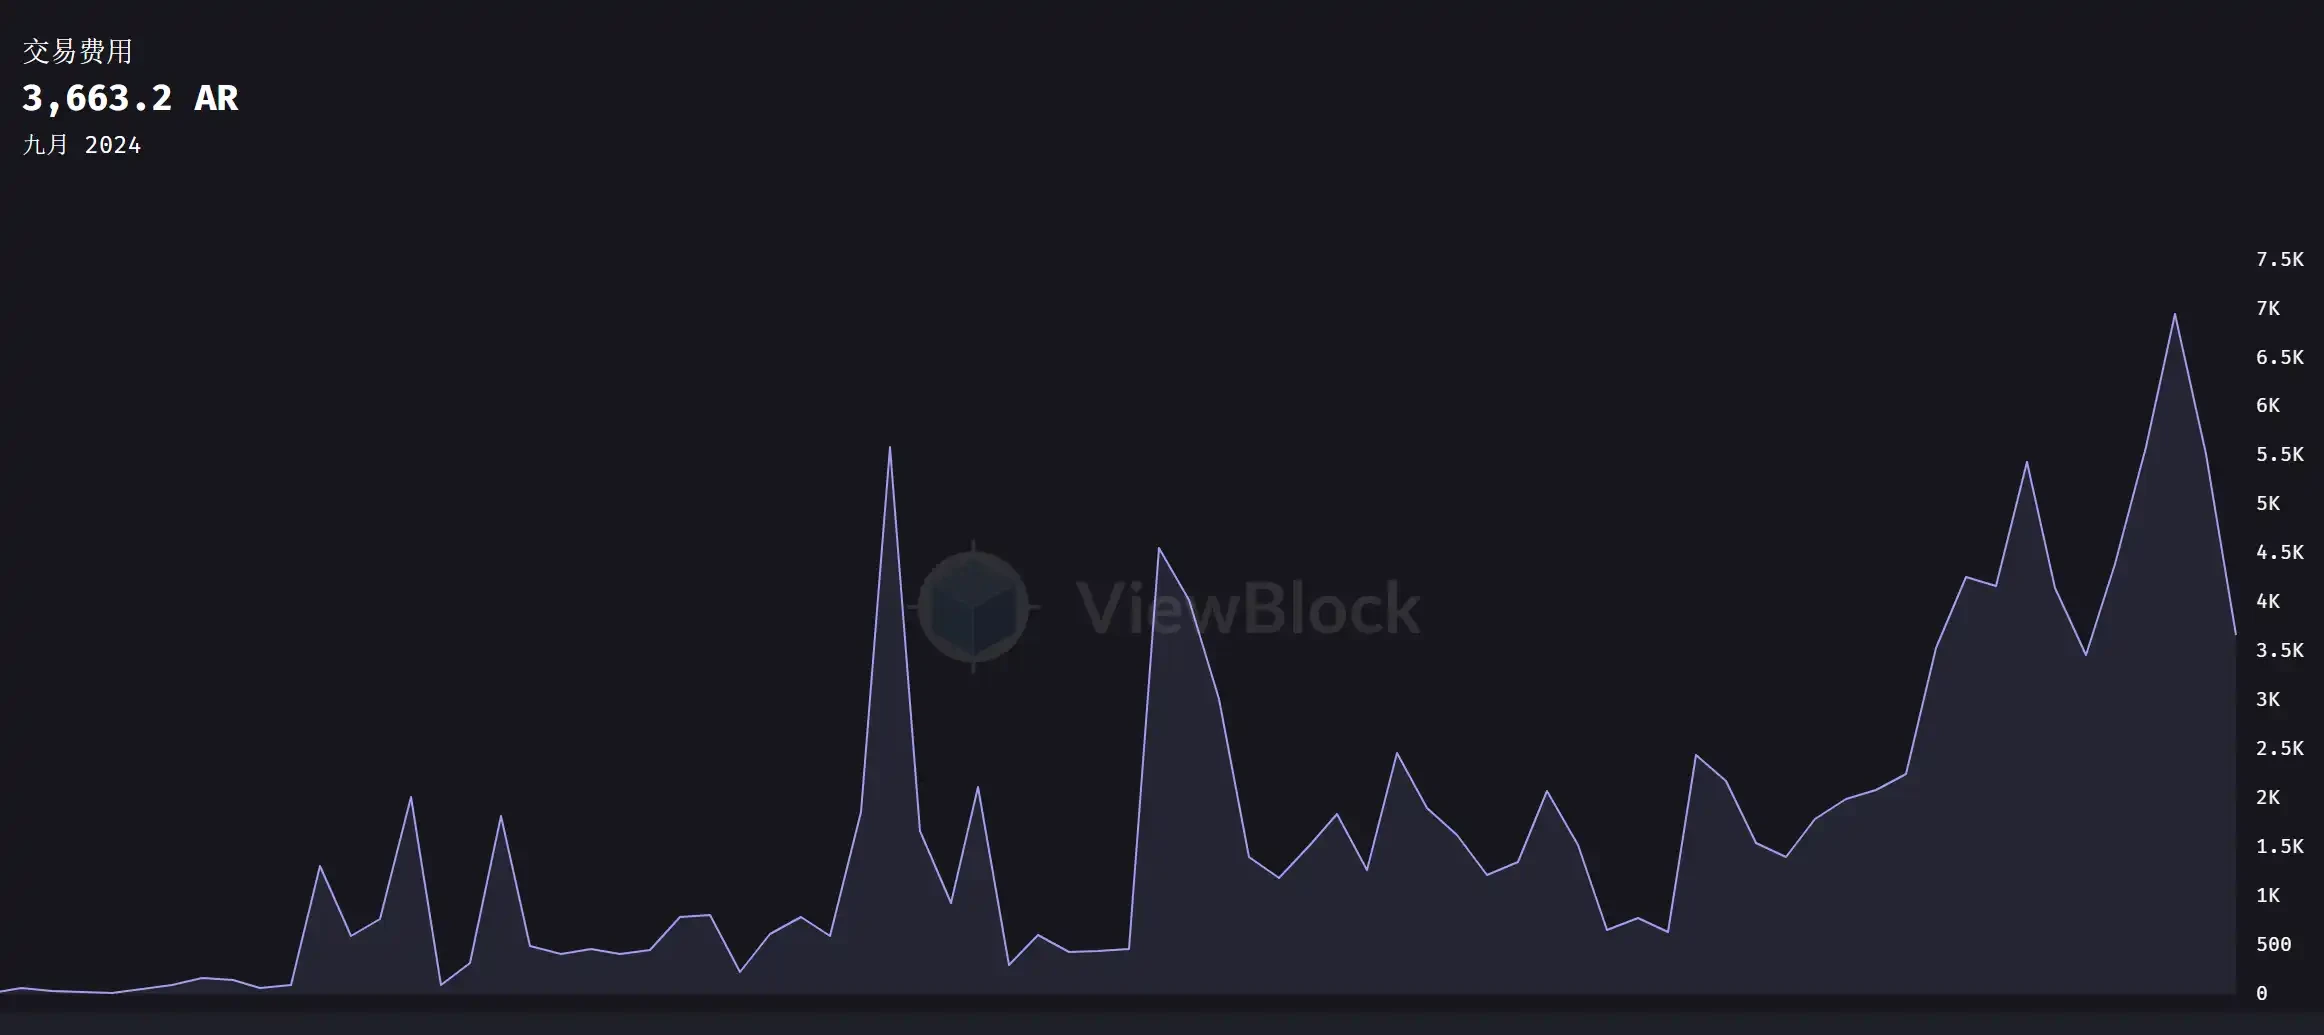
Arweave token-based transaction fees, data source: ViewBlock
For investors in the $AR token, $AR serves the fundamental payment function of currency. The native token of Arweave is $AR. On one hand, $AR can be used as a means of payment for data storage fees. When users store data on the Arweave network, they need to use AR tokens to pay a one-time storage fee. These fees ensure the permanent storage of data. On the other hand, miners earn AR tokens as rewards for storing and verifying data. For information on token price performance, please refer to the previous analysis.
DA Data Availability
The well-known public chains we are familiar with typically adopt an integrated, monolithic design, where a single blockchain handles all transactions. However, whether in social division of labor or in crypto, the development of refined division of labor seems inevitable. Since the advent of modularization, Data Availability (DA) has become an indispensable component in the Ethereum Lego blocks. Among them, Celestia, EigenDA, and Avail are relatively representative. Due to the limited data from EigenDA and Avail, we will analyze Celestia.
Celestia
Celestia's native token is $TIA. Celestia supports developers in creating new public chains and using $TIA to pay for GAS, while users can also stake $TIA to earn rewards. Due to the popularity of the $TIA airdrop, its initial beneficial effect was significant, reaching as high as $20/TIA. After the market cooled down, the price of $TIA gradually returned to normal levels.
The user profile of Celestia is mainly concentrated in Rollups. L2s in the market that use Ethereum for data availability and transaction settlement incur high costs, while adopting Celestia leads to a "qualitative" change in costs. Taking Arbitrum and Optimism as examples, if Celestia is chosen instead of Ethereum, the DA costs for processing 100 million transactions would be $32,598 and $15,333 respectively, reducing total costs by 89% and 92%.
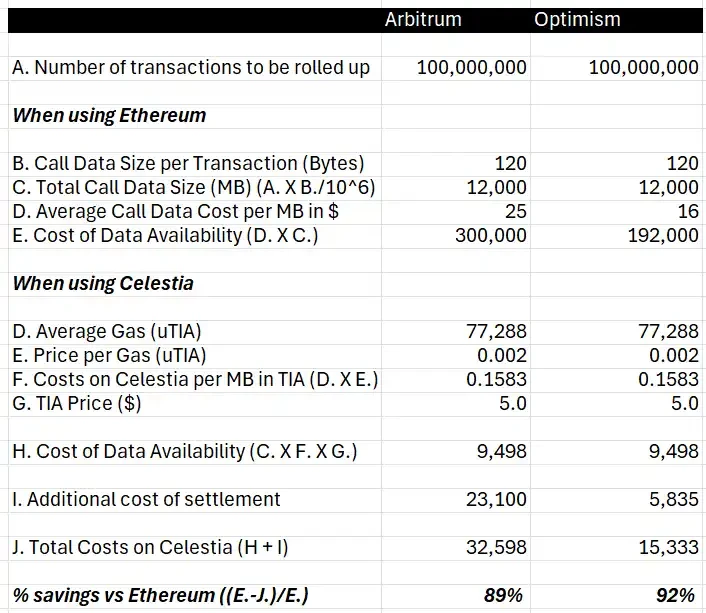
Comparison of DA cost savings using Celestia for Arbitrum and Optimism, data source: hashedem.substack.com
Modular projects like Celestia provide great convenience for L2s. This is reflected in the fundamental data, as Celestia's market share is gradually increasing, currently reaching 44% according to Blockworks data. Although Celestia's security cannot be compared to Ethereum, the market needs low DA costs more than security. The low-cost strategy has effectively helped Celestia expand its market size.
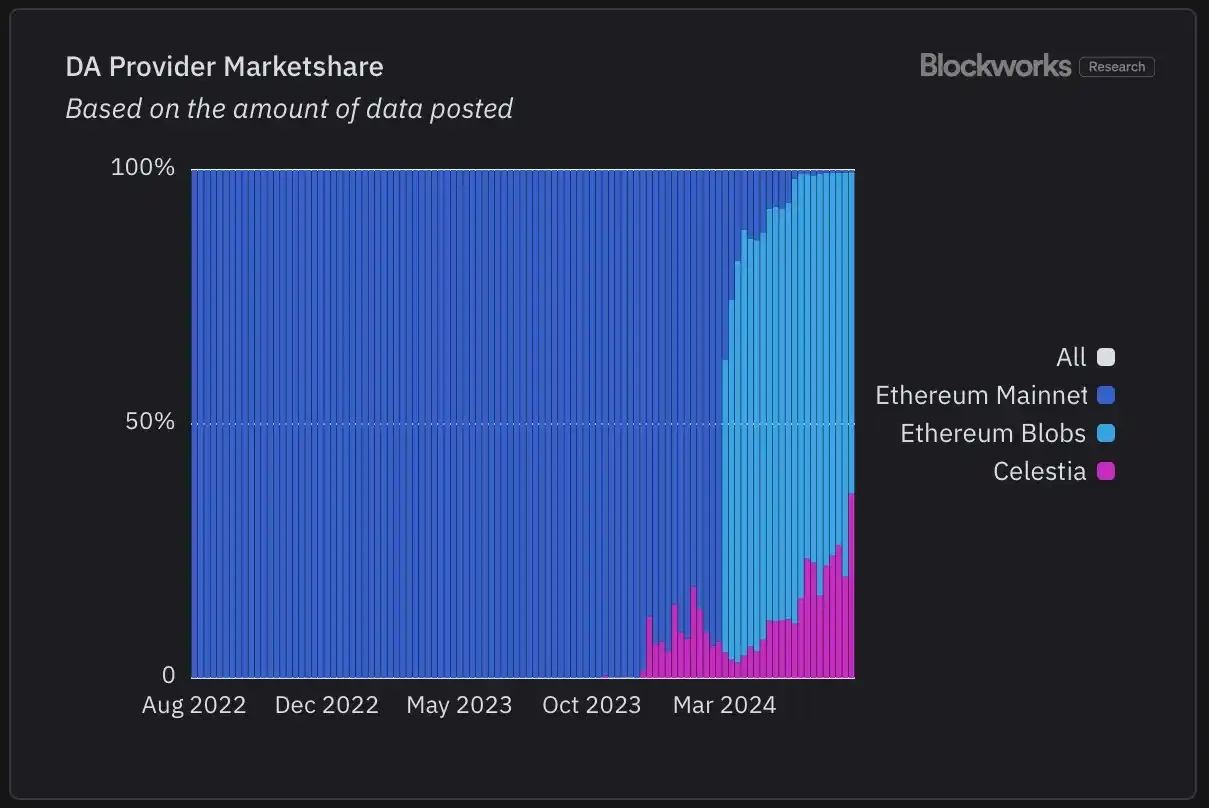
DA market share (according to Data post statistics), data source: Blockworks
From the chart below, it can be intuitively seen that after adopting Celestia, the average costs for various projects can be reduced to about 80%-90% of the original.
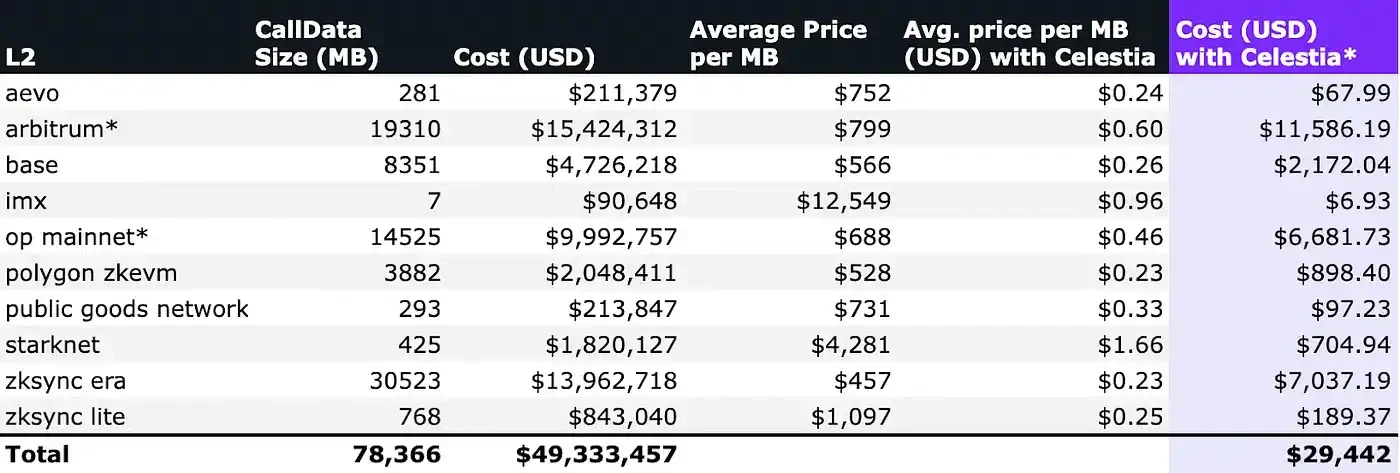
Cost savings for various projects using Celestia, data source: numia.data
Since Celestia can provide DA services at such a low price, is Celestia still making a profit?
According to Artemis data, Celestia's average daily upload data is about 3.5K/MiB, and the data upload fees in USD have decreased from $0.5/MiB in June-July to $0.3/MiB in August-September, plus the GAS consumed. Therefore, Celestia's potential annual revenue is relatively low, around the million-dollar level.
Although Celestia is still profitable on the data layer, there is a significant divergence from its valuation. According to CoinGecko data, its FDV is $6.4 billion. Perhaps for an FDV of $6.4 billion, there is no intuitive feeling; we can compare it to Chainlink mentioned at the beginning of the article, which currently has a market cap of about $7 billion and an FDV of about $12 billion. Given Celestia's million-level revenue situation, it is clear that the valuation is inflated compared to Chainlink's half. The actual business model and operations are insufficient to support its inflated market cap.
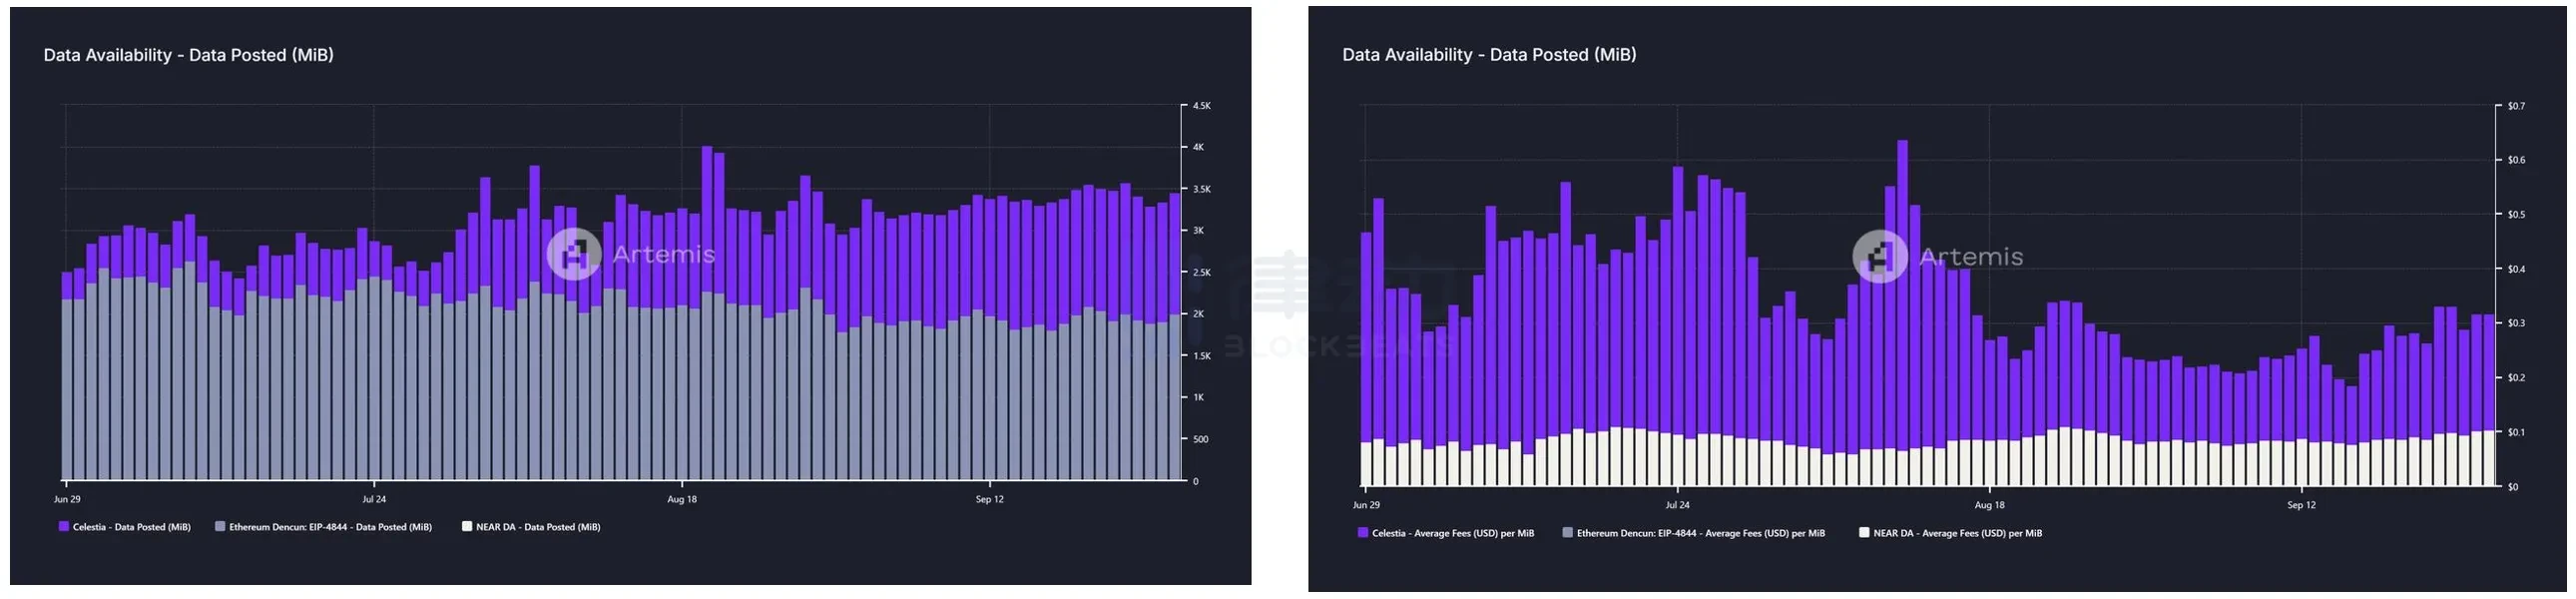
Left: Celestia/Ethereum Data Post situation; Right: Average cost per MiB for Celestia/Ethereum, data source: Artemis
On the other hand, currently, only 26% of $TIA is unlocked, and on October 30, there will be a large unlock worth $1 billion. Additionally, there is no maximum supply limit for TIA. It is also worth noting that the Celestia Foundation announced on September 24 that it completed a $100 million financing led by Bain Capital Crypto, with participation from Syncracy Capital, 1kx, and other institutions. The official announcement of completing the $100 million financing just before the upcoming unlock is intriguing.
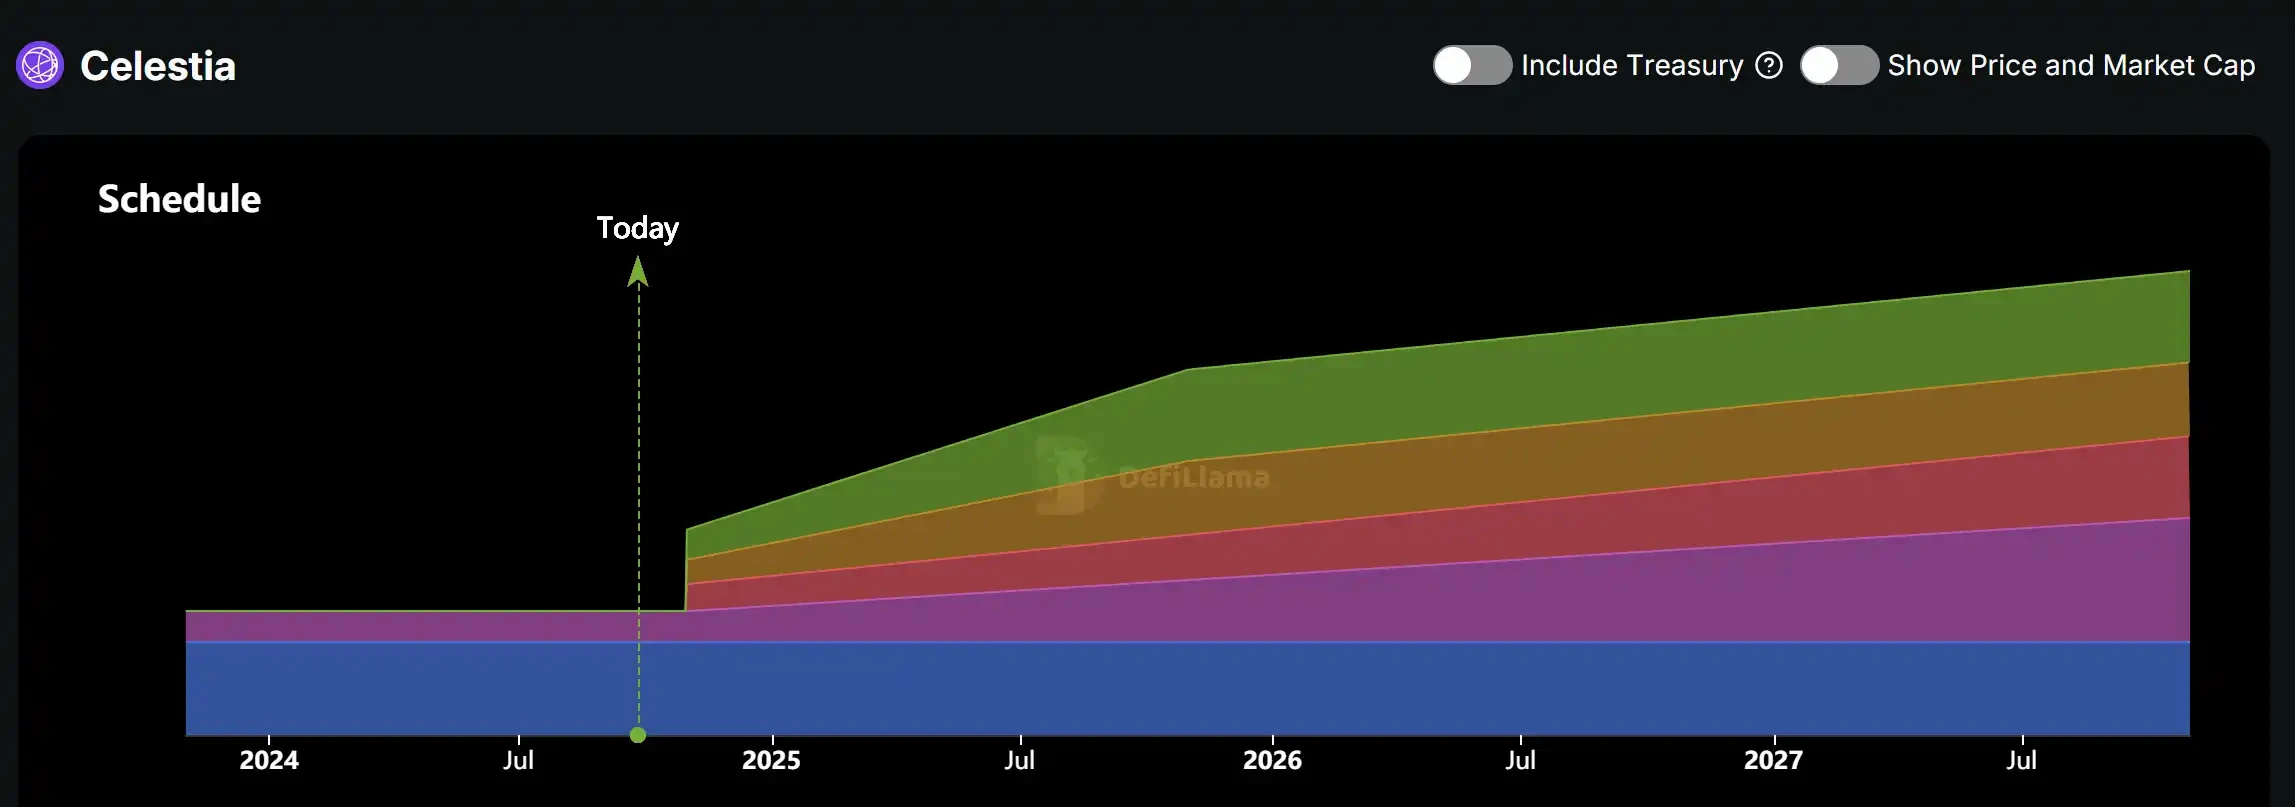
Token $TIA unlock status, data source: DeFiLlama
For the DA track, its main clients are various Rollups, but currently, mainstream L2s still use the Ethereum mainnet as DA, with very few L2s choosing Celestia. The survival of Celestia depends not only on whether its business model can be implemented but also on the subtle relationship between Ethereum and various L2s. Choosing Celestia is tantamount to publicly opposing Ethereum, and in this cycle where survival is only possible by huddling together, market economics seem less important.
L2s
As the main theme of this round of infrastructure, L2s have achieved "easy profits" compared to L1s, which often burn money recklessly. With the technical support of OP STACK, the development costs of L2s have significantly decreased, truly achieving "one-click chain deployment." Typically, the costs of L2s consist of components such as sorters, DA, and development. After the Cancun upgrade, the GAS for L2s has generally decreased by 50%-90%. While the market enjoys the advantages of low GAS in L2s, it is also gradually discovering the drawbacks of L2s. Do we really need so many L2s? With this question in mind, we categorized them based on technical principles and market capitalization, selecting OP series Arbitrum, Optimism, Base, and ZK series Starknet, zkSync for analysis.
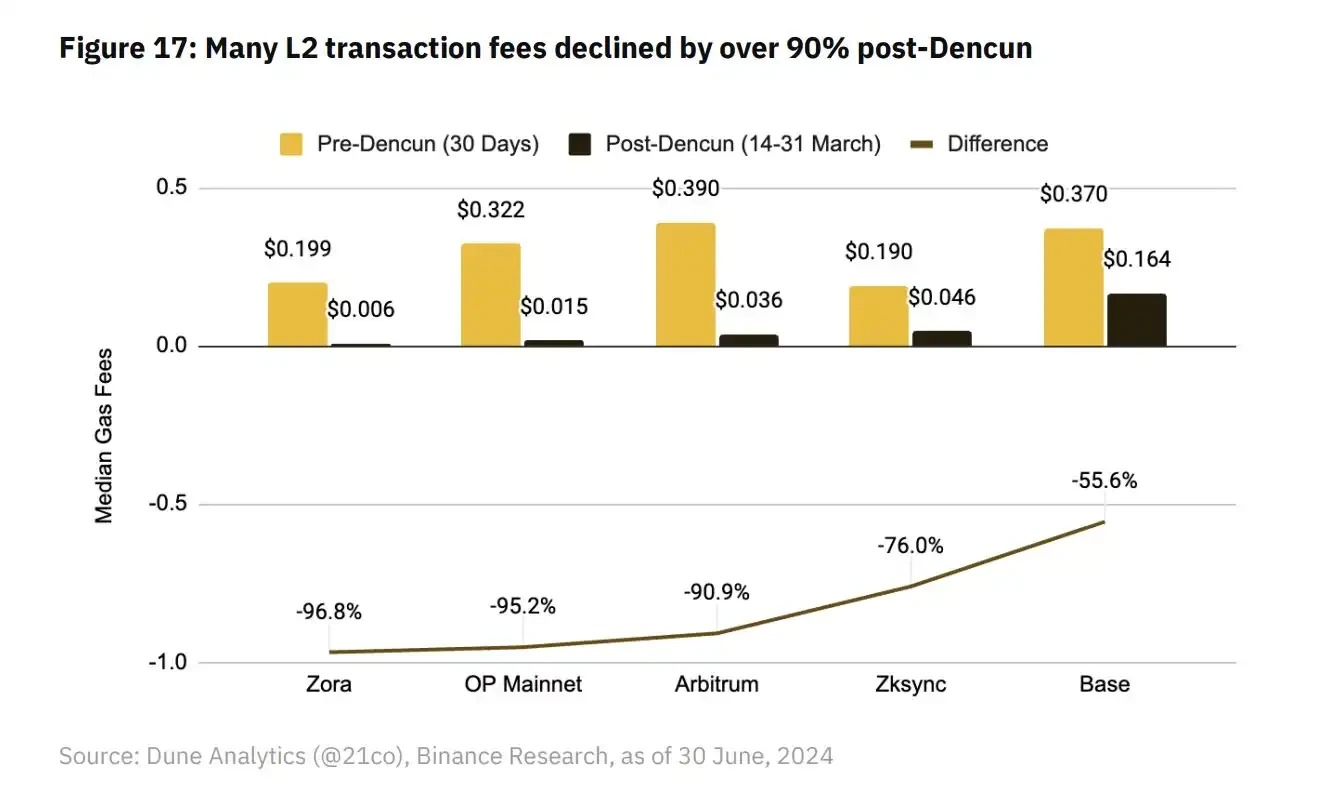
Comparison of transaction fees before and after the L2 Cancun upgrade, data source: hashedem.substack.com
Arbitrum
Specifically, Arbitrum's revenue experienced a sharp decline after Q1. Compared to $27.38 million in Q1, the figures for Q2 ($7.37 million) and Q3 ($3.34 million) are dismal, partly due to the unfavorable market environment during Q2 and partly due to competition for traffic from other L2s.
It is worth noting that due to the Cancun upgrade, Arbitrum's costs have also significantly decreased, resulting in a net profit decline of only 7.3%. Compared to the 70% profit retracement seen in most other infrastructure projects, Arbitrum's performance is already much better than most peers.
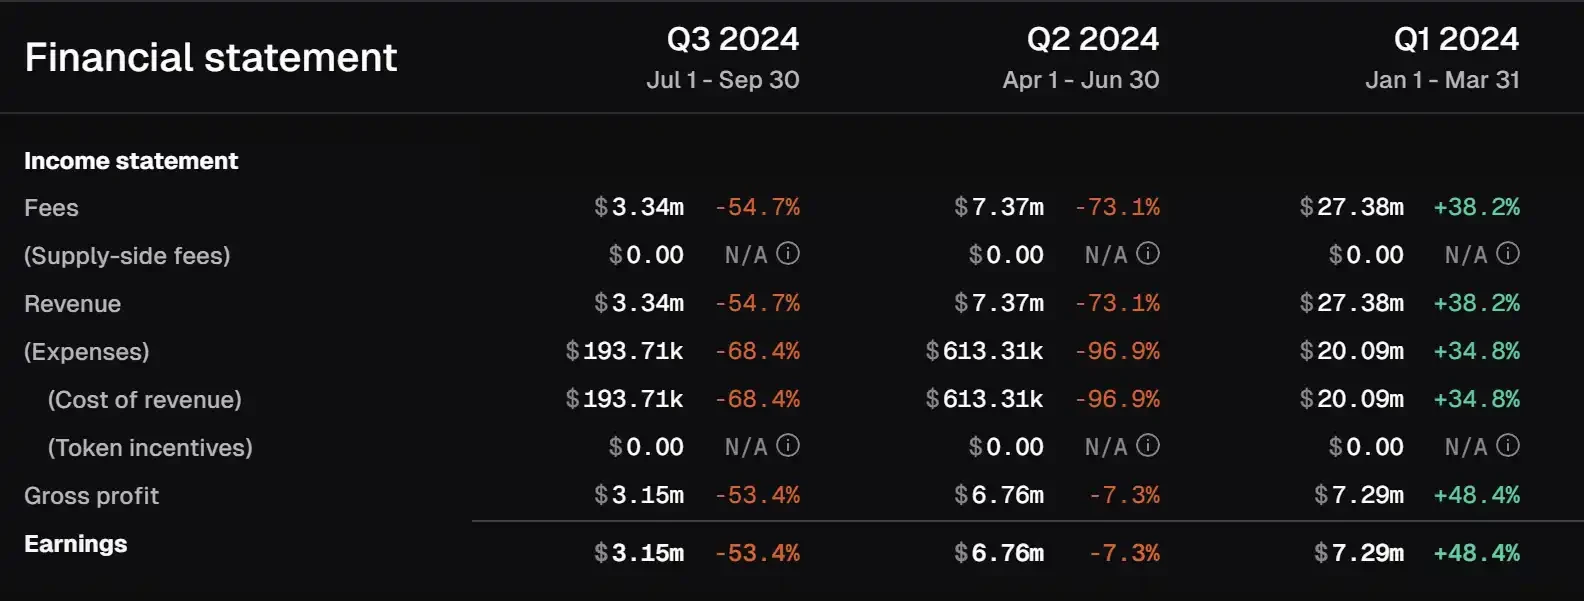
Changes in various financial indicators of Arbitrum, data source: Tokenterminal
As mentioned earlier, the largest expenditure for L2s is the DA and settlement costs paid to L1. Taking Arbitrum as an example, the L1 cost for processing 100 million transactions reaches $25,000 per month; of course, using Celestia's services would be even lower. If GAS covers these costs, then running L2 only needs to consider how to reduce the costs of sorters and initial development. When these costs are low enough, L2 becomes a "rental" business that earns easily, and indeed, this is the case.
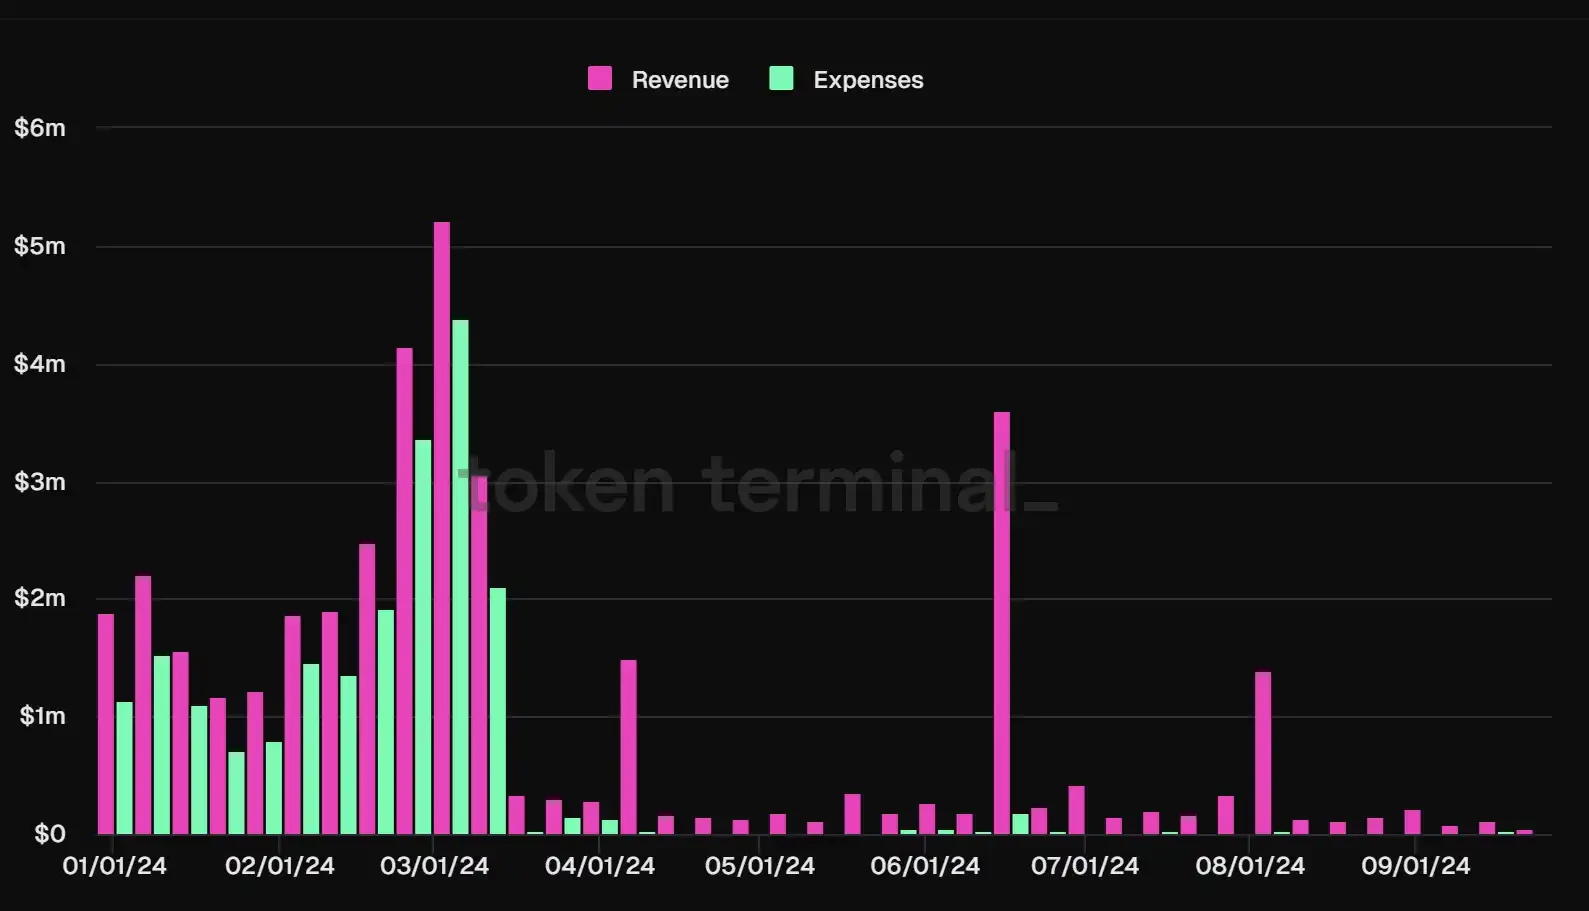
Arbitrum revenue and expense statistics, data source: Tokenterminal
User bottlenecks have always been a constraint on development. The number of active users on Arbitrum has struggled to break through 10 million, and now, with the market cooling, the monthly active users have dropped to around 2.8 million. On one hand, Arbitrum is being overtaken by Base; on the other hand, Arbitrum's ecosystem not only struggles to attract new users but also needs ecological innovation to revitalize existing users.
Arbitrum monthly active user data, data source: Tokenterminal
Optimism
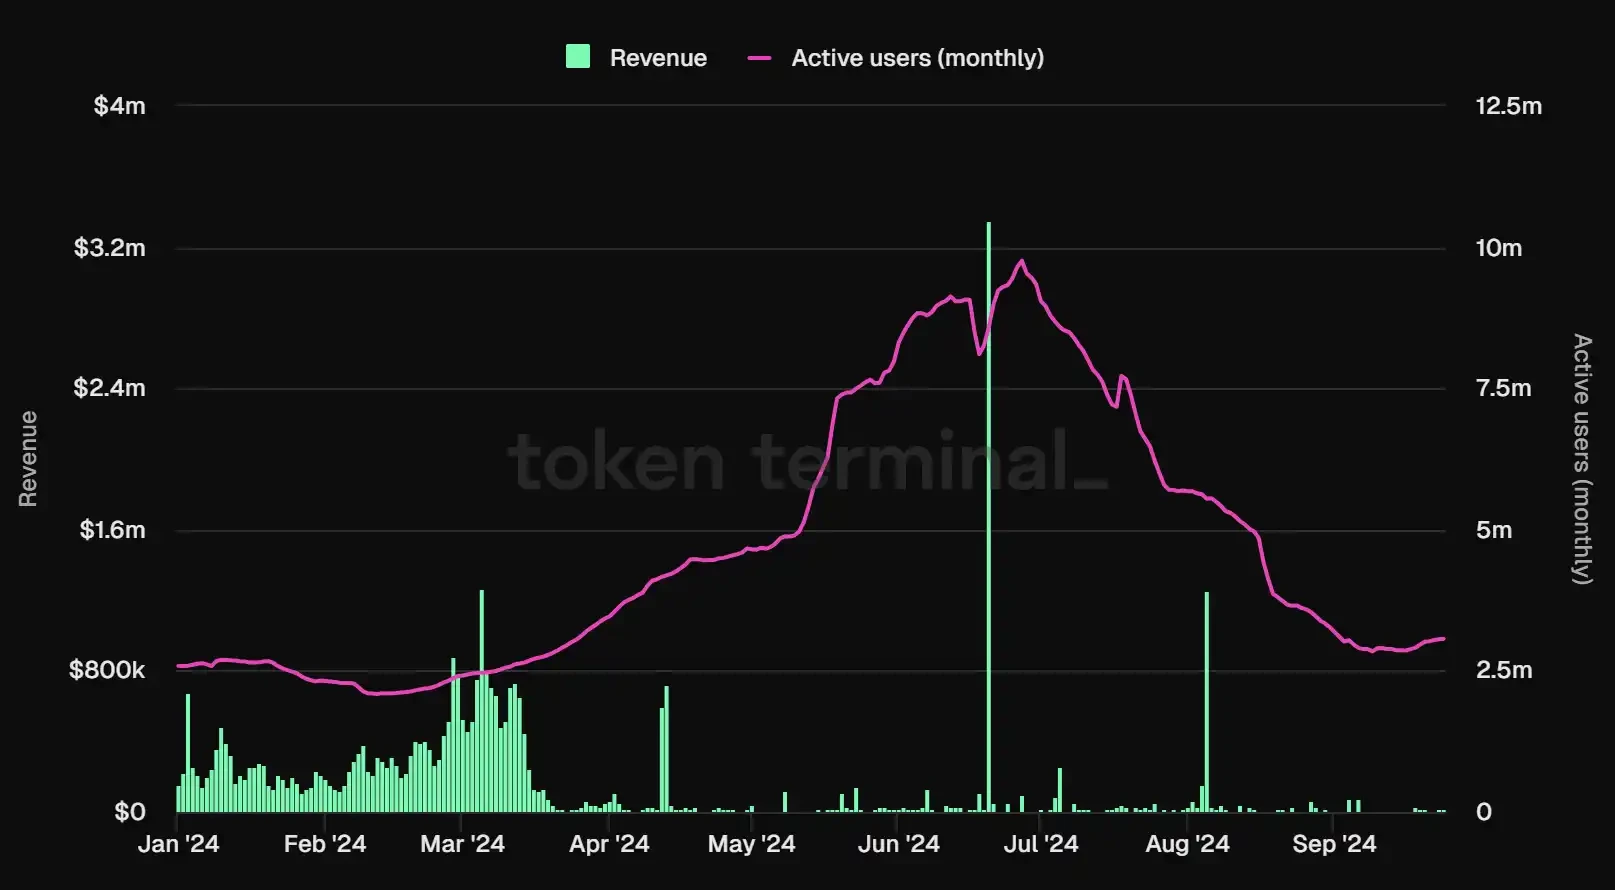
The overall operating situation of OP is similar to that of most others, with revenue peaking at $18.83 million in Q1, then halving in Q2 and Q3 to $8.95 million and $3.32 million, respectively. Although from a "politically correct" perspective, the Optimism project team has a close relationship with the Ethereum technical community and foundation, representing the heir to Ethereum's will among L2s, it is more orthodox compared to Arbitrum's Ivy League circle. However, the market's correct answer is not Optimism: Arbitrum is neck and neck with it, and Base, introduced later, is even better.
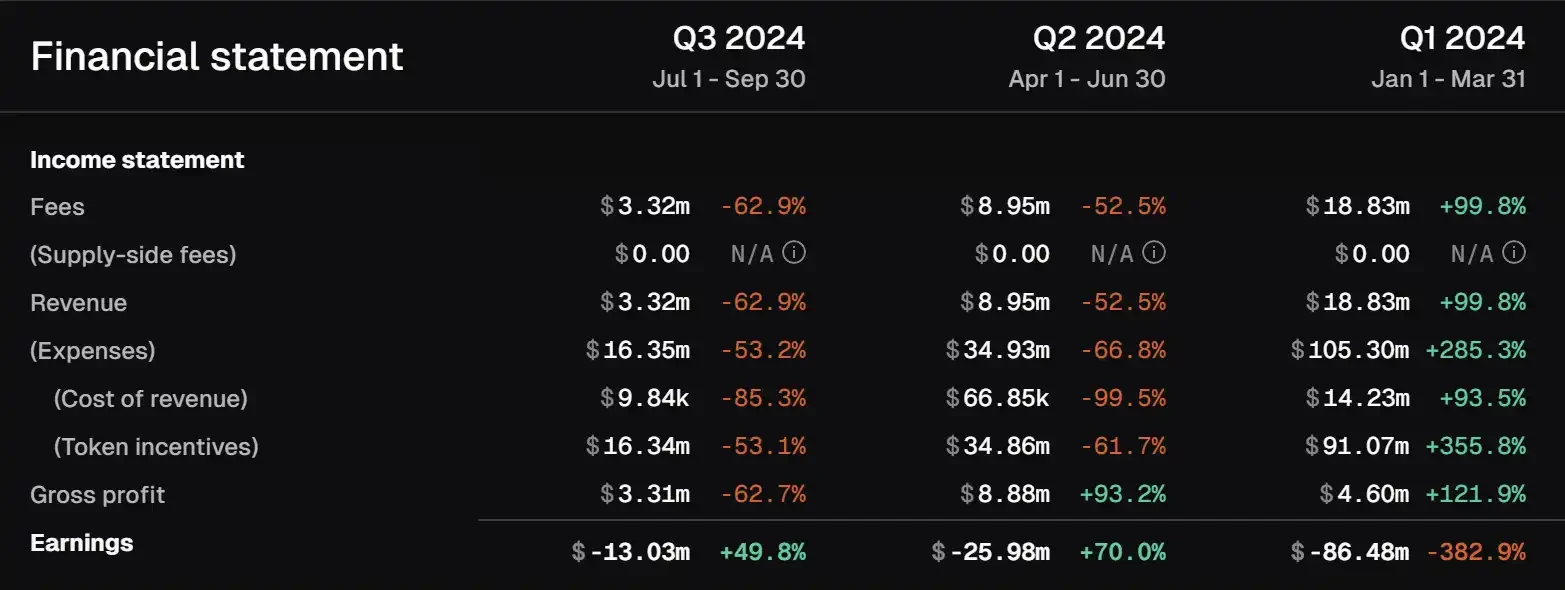
Changes in various financial indicators of Optimism, data source: Tokenterminal
It is worth noting that Optimism and Arbitrum have different retention earnings. Although its on-chain net income is continuously increasing, when considering the impact of token incentives, Optimism is operating at a loss. In USD terms, it needs to pay $91 million, $34 million, and $16 million in token costs for the first three quarters of this year, far exceeding its operating costs.
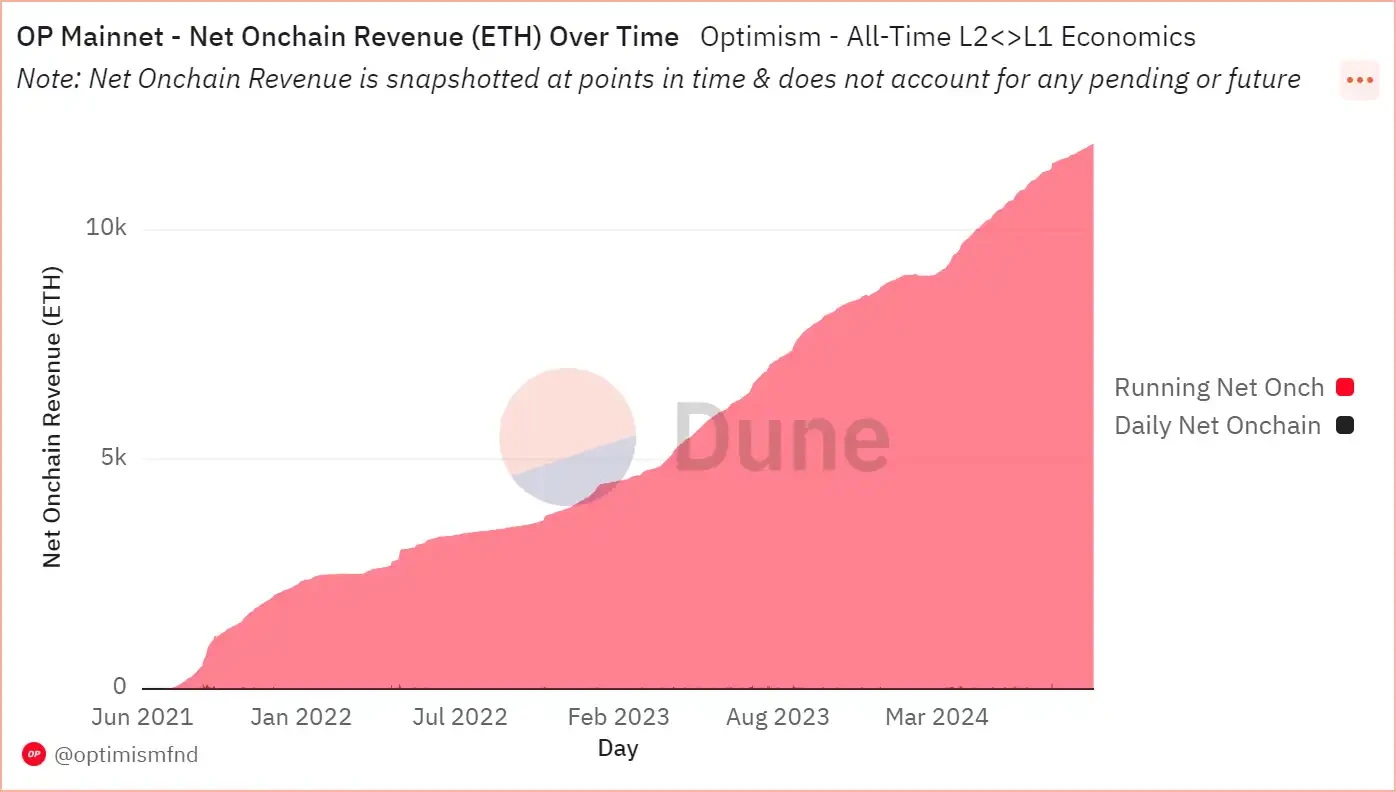
Optimism on-chain net income, data source: Dune
In terms of active user data, although Optimism's active users peaked at only 1.6 million, which is not as impressive as the 10 million figures of other OP series L2s, its lower limit is very stable, maintaining a steady "decline" around 1.2 million. Compared to its ZK counterparts, the overall user data of the OP series looks much better, with both a higher ceiling and a solid lower limit.
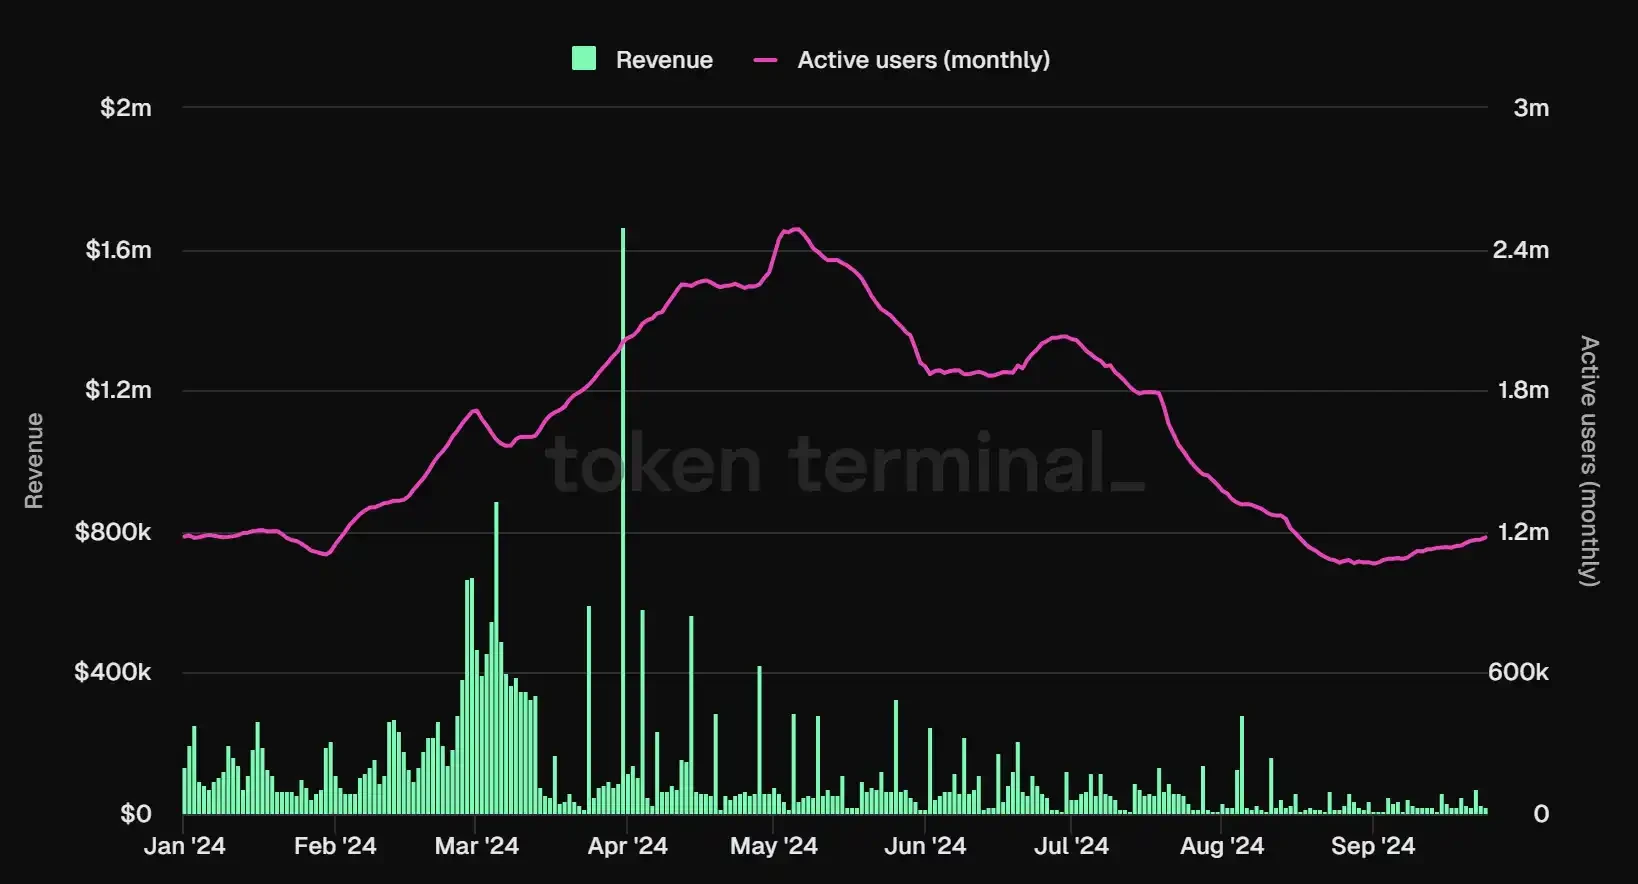
Optimism monthly active user data, data source: Tokenterminal
For Optimism, the overall atmosphere and positioning of the team are more tech-oriented. The OP Stack developed by OP Labs has already helped many L2s achieve one-click chain deployment, and it has further upgraded to OP Succinct and ZK Stack to compete for traffic. Whether the vision of SuperChain can be realized is a question for the team and the market.
Base
Backed by the exchange CoinBase, Base was born with a golden spoon and has a much healthier fundamental compared to other L2s. As a rising star, it has now become a leading player on the L2 chessboard. In Q1 of this year, Base's trading fees surged by 400% month-on-month. Prior to this, Base relied on "MEME" and "social" to spiral upwards. Due to its lower trading fees, Base retraced Solana's old path, igniting a MEME craze. BALD, BRETT, and DEGEN successively ignited BASE's MEME heat. Subsequently, BASE integrated social applications friend.tech and Farcaster, becoming a true Social-L2.
With a series of strategic moves, Base has overtaken Arbitrum and Optimism. Its Q1 revenue reached $27 million, matching Arbitrum's, and despite experiencing a 70% drop in Q3 revenue, its net profit still reached an impressive $5.84 million.
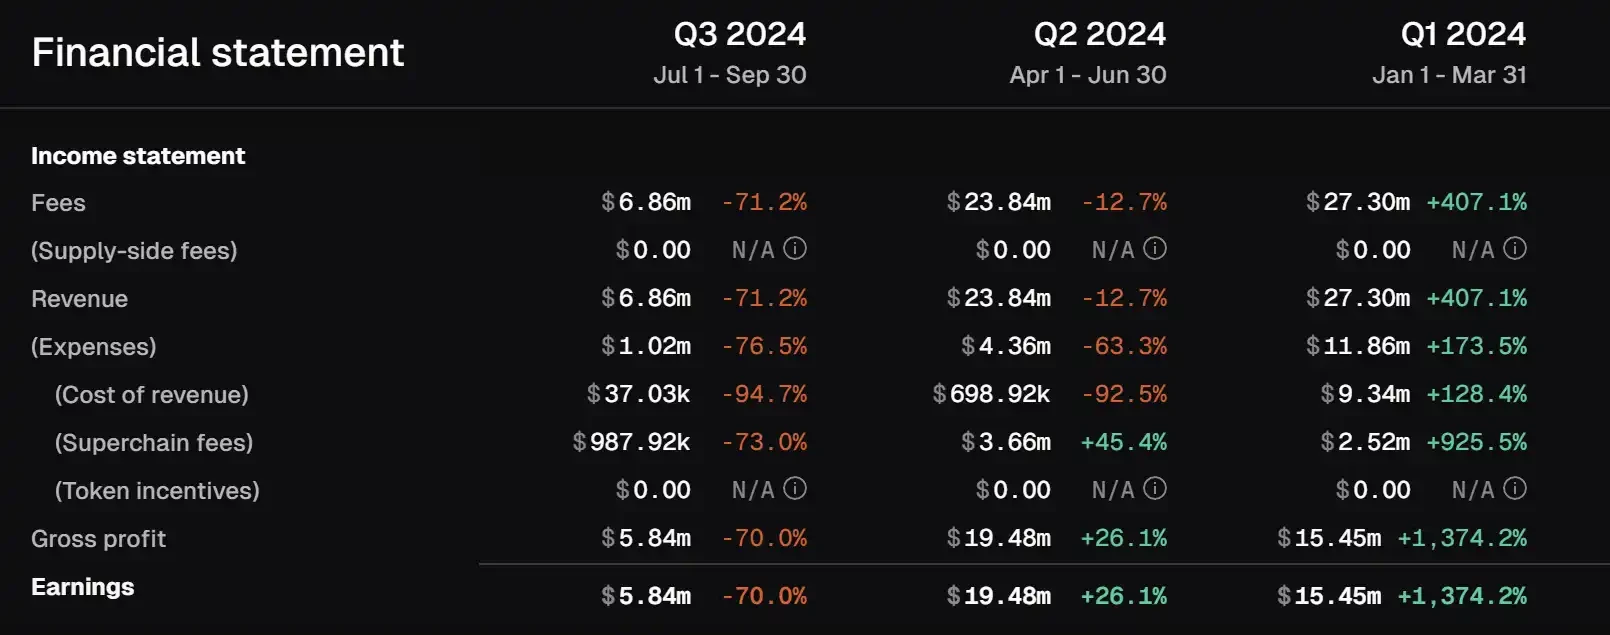
Changes in various financial indicators of Base, data source: Tokenterminal
From the perspective of TVL, Base's success depends on two replicable social explosions. From an initially lukewarm start, the launch of Friend.tech brought a flood of new users and funds, helping Base emerge from the novice village, with TVL reaching the level of $500 million. Then, in March of this year, the Cancun upgrade reduced GAS, and Base embarked on a MEME craze similar to Solana, with on-chain users becoming active, and with the help of Social-Fi like Farcaster, Base's TVL has reached $1.5 billion. As of now, Base's TVL continues to rise steadily.
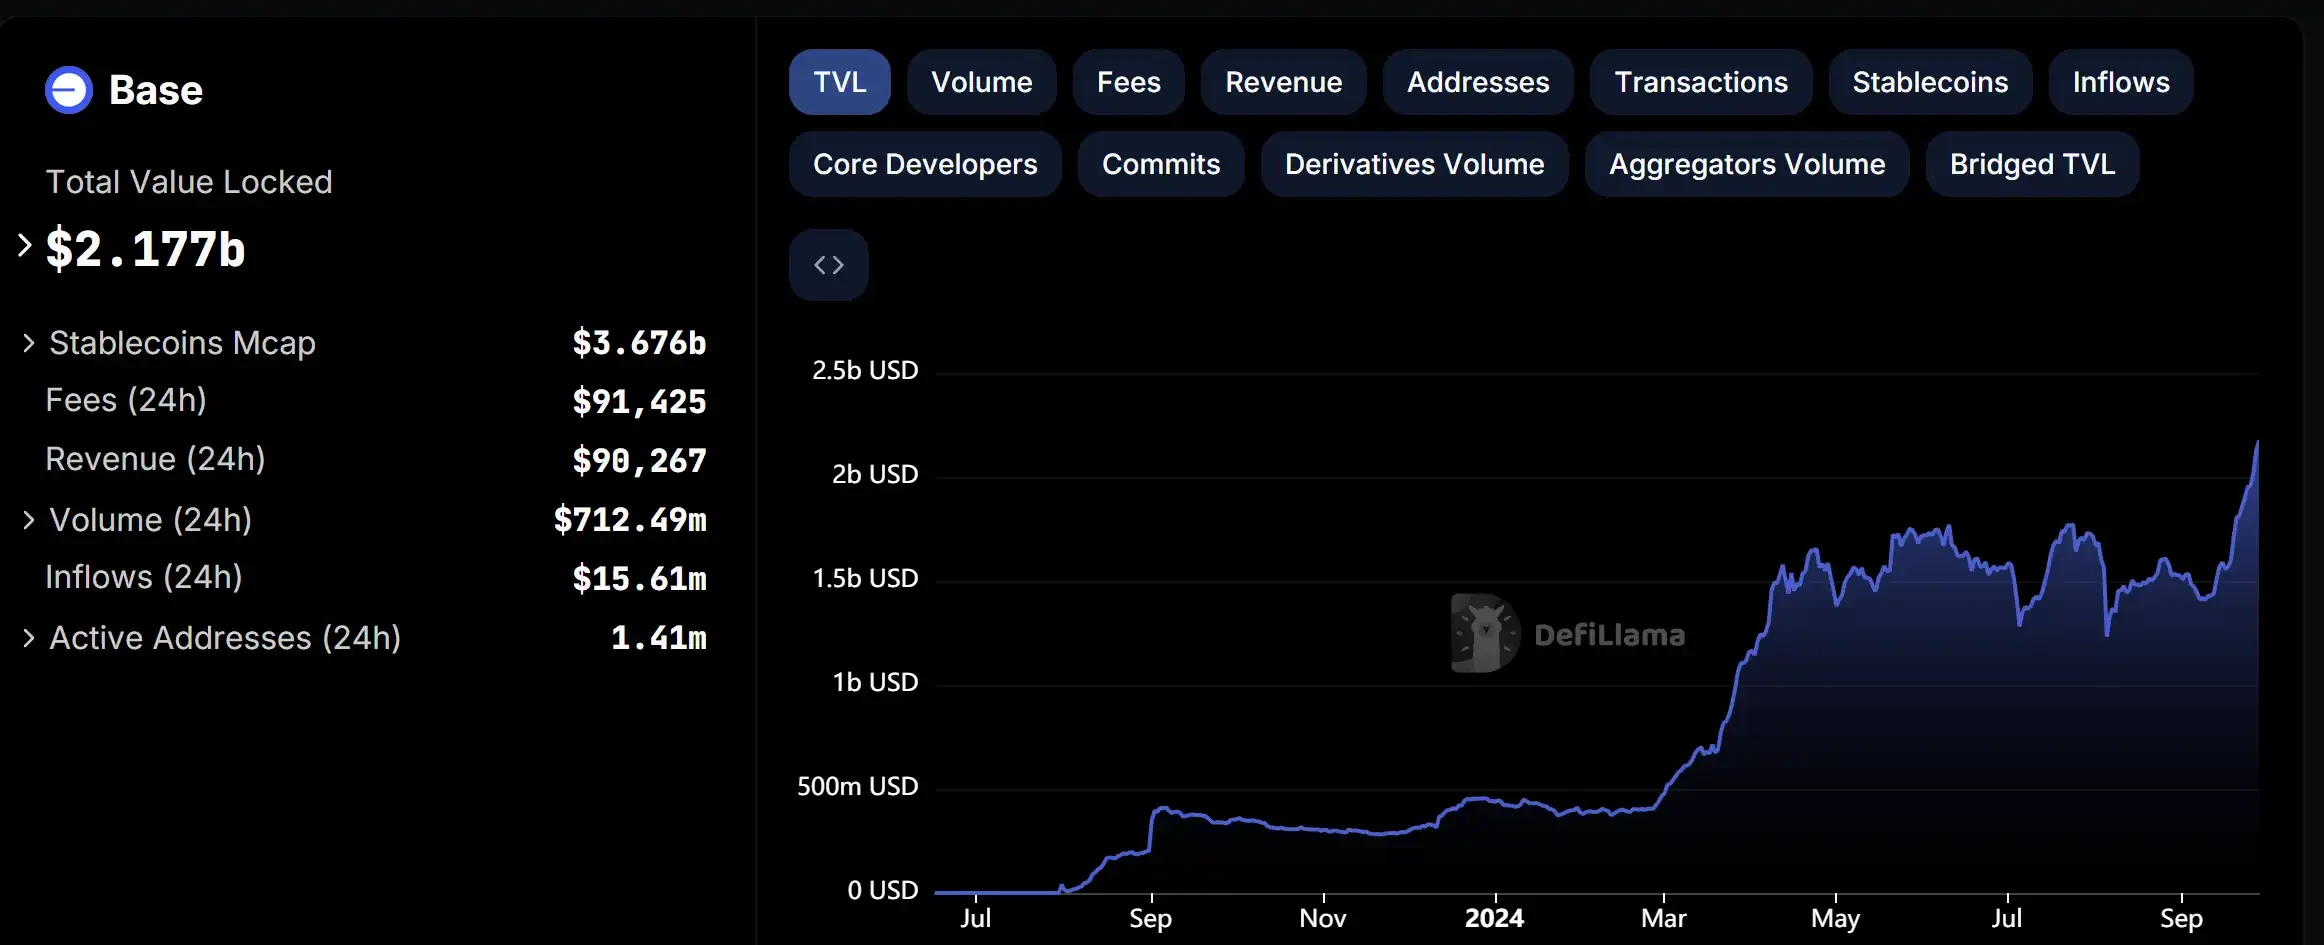
Base TVL growth situation, data source: DeFiLlama
Unlike other L2s, user data is not a bottleneck constraining Base's development. Base has shown steady improvement in user data. Monthly active users reached 20 million in September, surpassing other "king" level L2s. Relying on CoinBase's massive user traffic, the active users that are hardest for other L2s to capture have become a unique moat for Base.
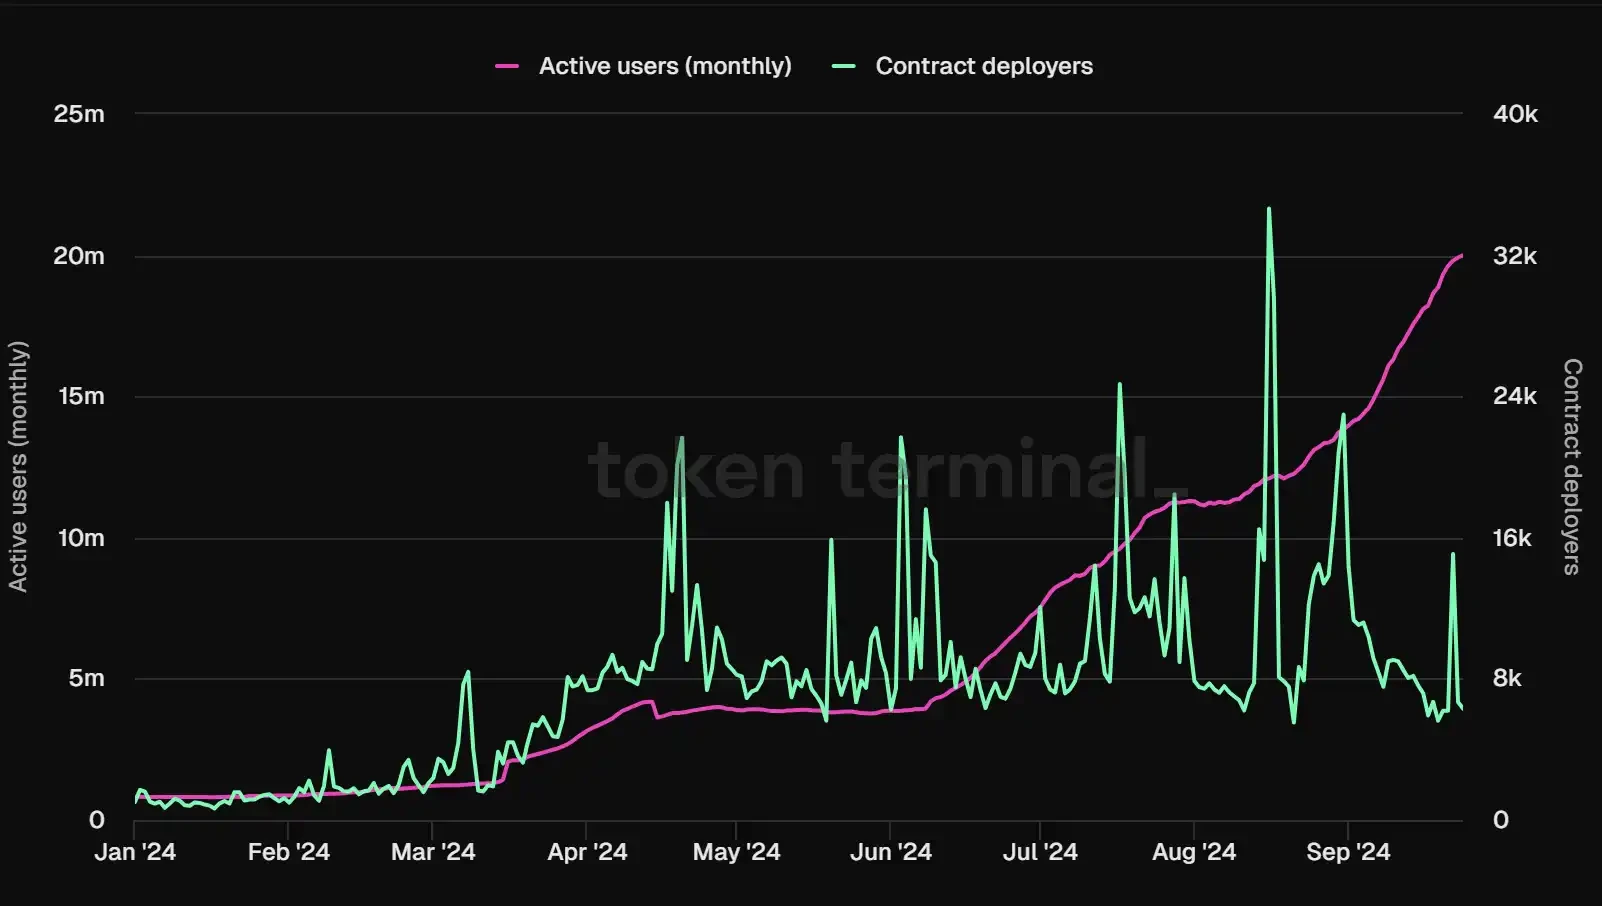
Base monthly active user data, data source: Tokenterminal
Similarly, Base is also a guaranteed profit. In addition to the Base project team being skilled in marketing and gameplay, maximizing traffic, Base's impressive financial data is also due to the support from Coinbase. As the only sorter on Base, Coinbase has minimized costs outside of DA. Therefore, according to TokenTerminal data, except for a few specific points in time, the vast majority of the time, Base's revenue far exceeds its costs.
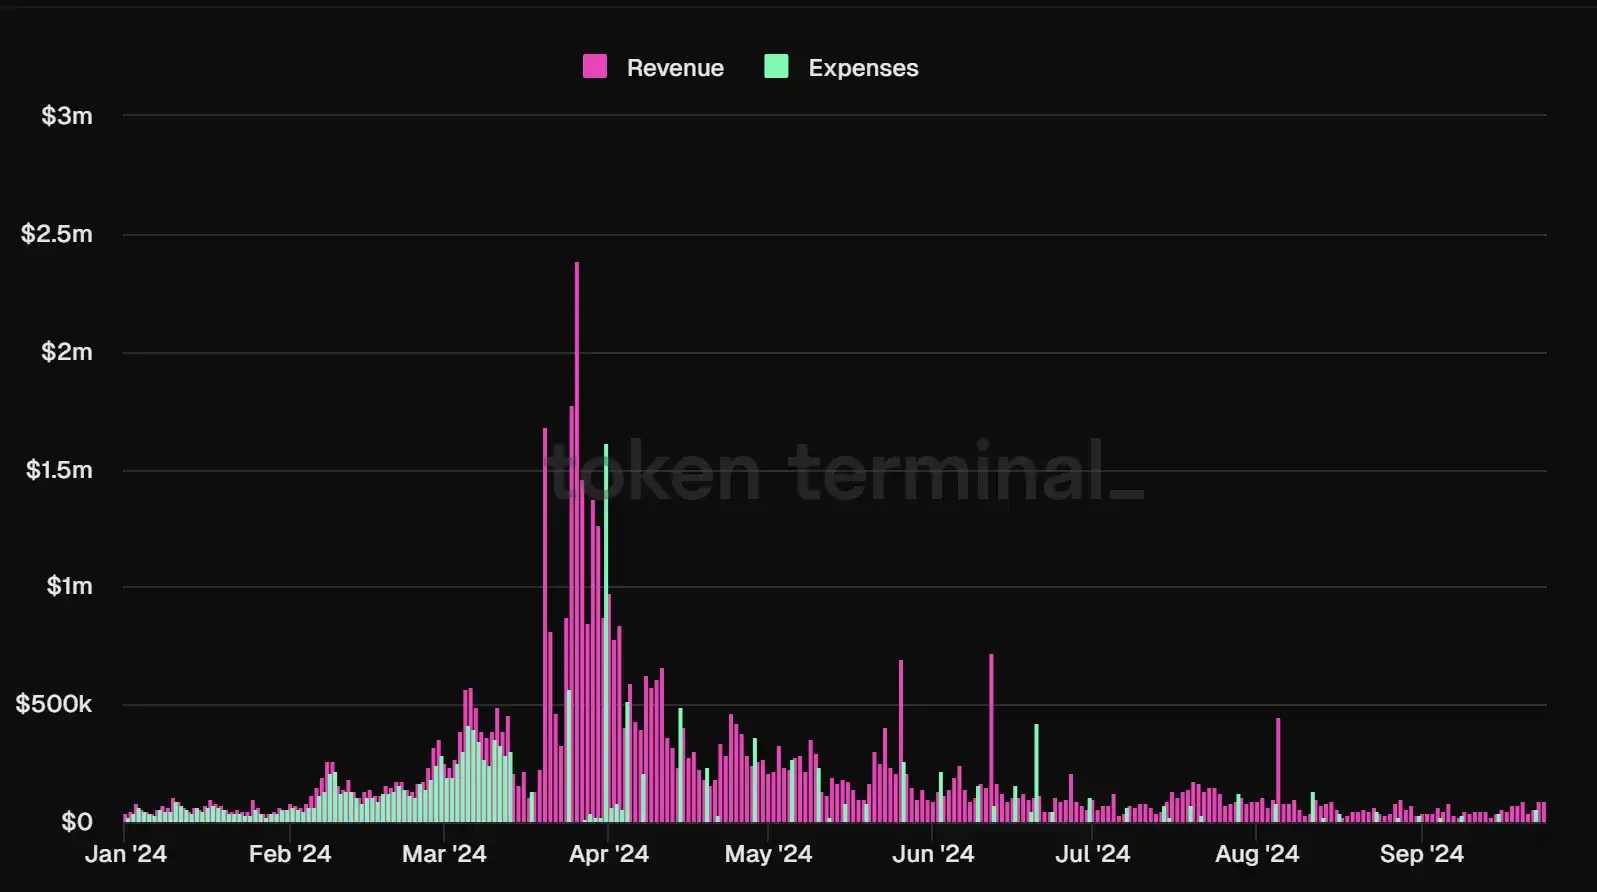
Base income and expenditure situation, data source: Tokenterminal
Starknet
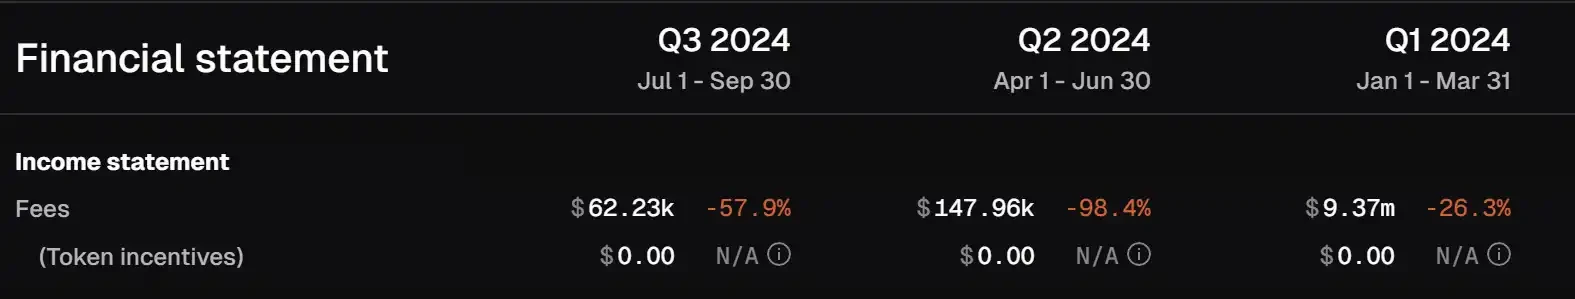
As the prince of ZK technology, Starknet has always been highly sought after, but its fundamental performance has been disappointing. Since entering 2024, Starknet's revenue, like its token price, has only seen declines without rebounds. Among them, the decline in Q2 2024 was the most severe, with only $147,900 in trading fees compared to $9.37 million in Q1.
In addition to the negative impact of a sluggish market environment in Q2, EIP-4844 and the Cancun upgrade were also significant factors. Although the Cancun upgrade brought extremely low DA costs for L2s using Blobs, it also led to a decline in network transaction fees. Since the Cancun upgrade, Starknet's on-chain transaction fees have plummeted. The chart below clearly shows that Starknet's revenue has been in decline since Q1.
Starknet transaction fee quarterly changes, data source: Tokenterminal
From the user's perspective, Starknet has gradually become a "ghost town." In January 2024, Starknet broke through the bottleneck of 1.2 million monthly active users, peaking at 2.2 million. After that, active users began to leave in large numbers, and the user bubble was ultimately burst. Currently, the monthly active users stabilize around 130,000. Whether on primary or secondary platforms, Twitter or group chats, Starknet's presence has gradually faded.
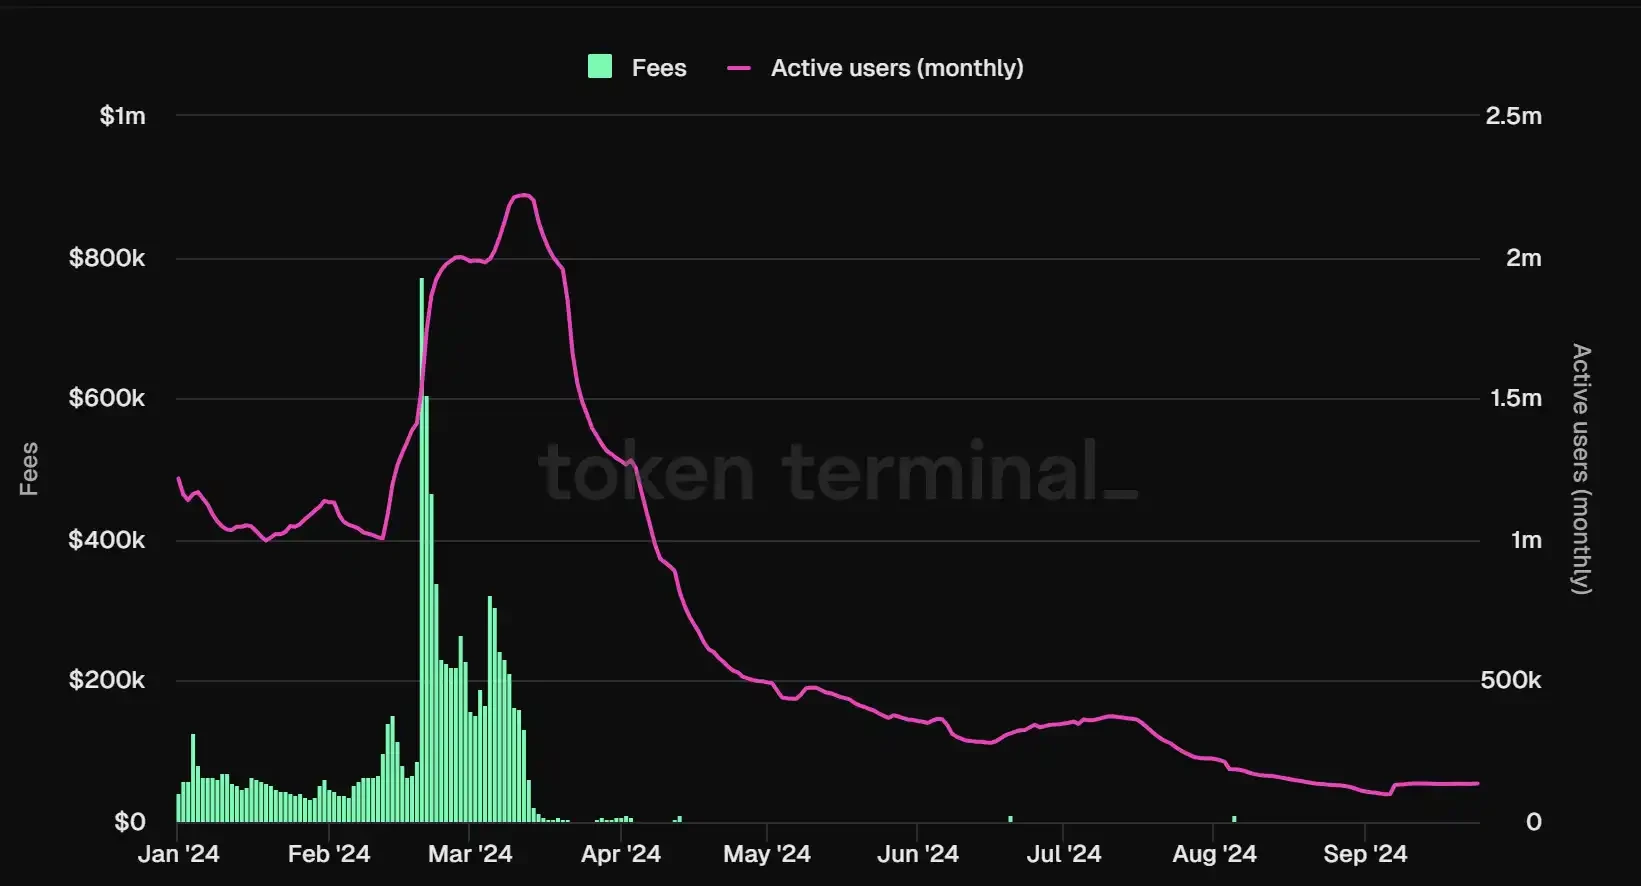
Starknet monthly active user data, data source: Tokenterminal
zkSync
The last of the four L2 kings to launch its token, zkSync has been under market and public scrutiny since its inception until its listing on Binance. zkSync launched its testnet in 2021, but development progressed slowly, and it wasn't until 2023 that the mainnet was officially launched. Although zkSync has top-tier venture capital backing, its ecosystem development has not met expectations, lacking any phenomenal or widely recognized dapps, giving off a "loud thunder, little rain" vibe. Before the release of its native token $ZK on June 17 this year, the main market traffic was focused on how to "brush data" for zkSync to gain airdrops.
Changes in various financial indicators of zkSync, data source: Tokenterminal
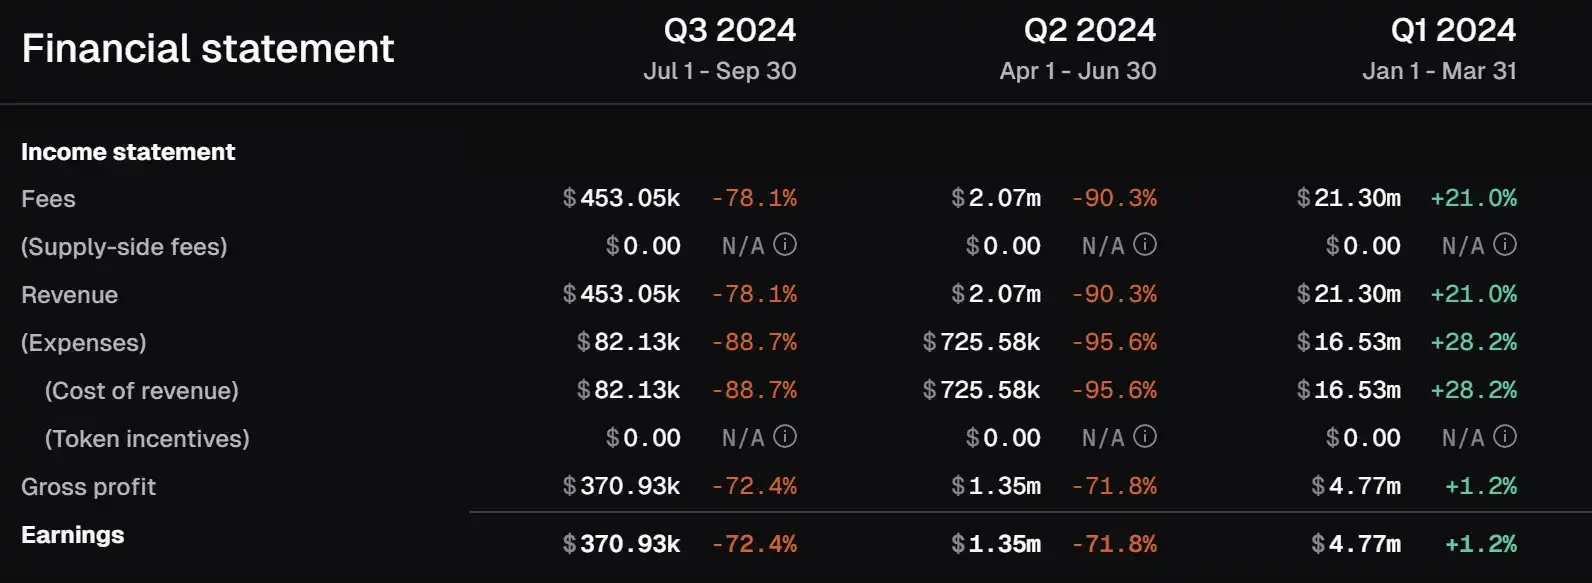
Although zkSync's revenue is as dismal as most L2s, this merely indicates that zkSync is earning less, but at least it is still at the level of "profit retraction." According to data from Tokenterminal, its overall revenue can still cover its expenses. However, its net profit is relatively low compared to other L2s, declining from $4.7 million in Q1 to the current $370,000.
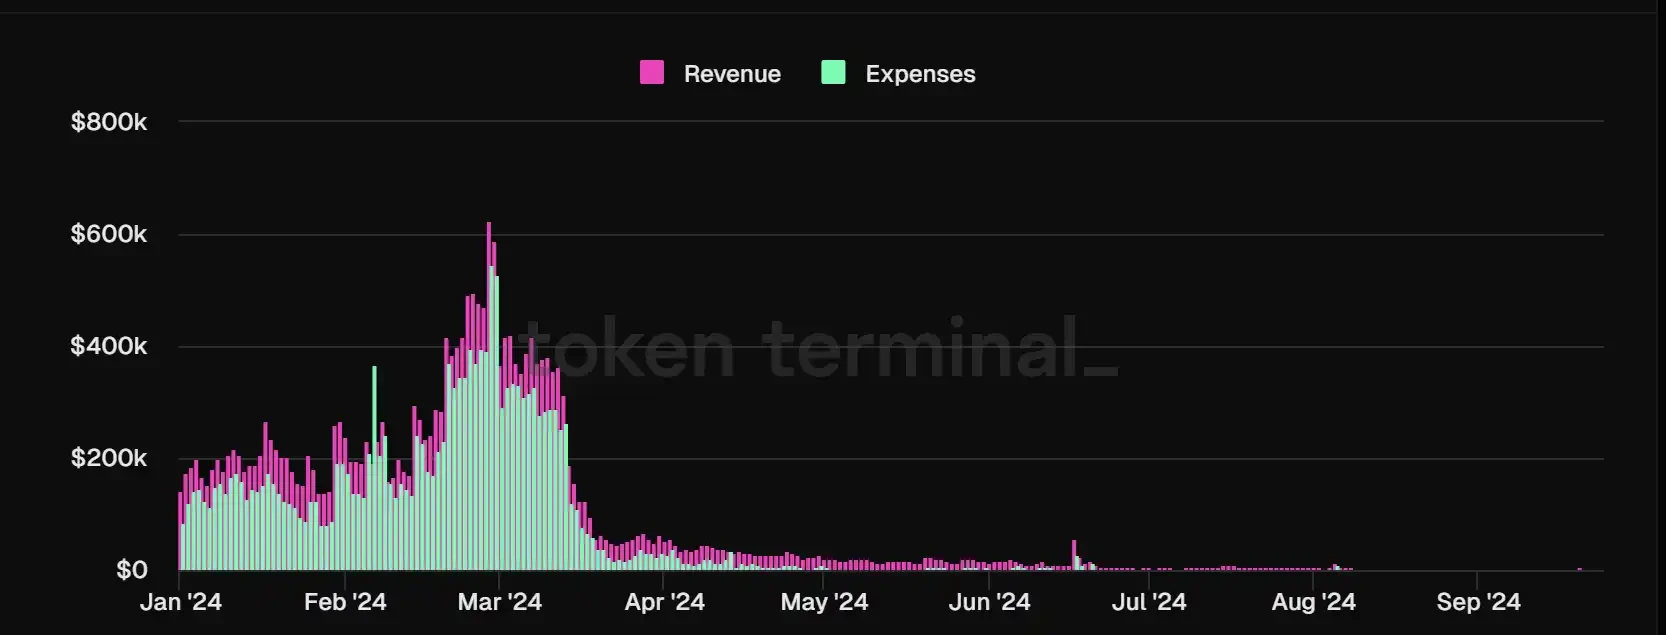
zkSync income and expenditure situation, data source: Tokenterminal
It is noteworthy that in July of this year, zkSync faced a double blow of declining revenue and developer numbers, but its active users experienced a brief resurgence, increasing from 2 million in June to 3.8 million, before plummeting to around 800,000. For zkSync, it is not only necessary to consider how to build its own ecosystem to attract funds and users, striving for a larger stake in the L2 competition, but it also needs to pay attention to how to avoid the vicious cycle brought about by its own "ghost town" phenomenon.
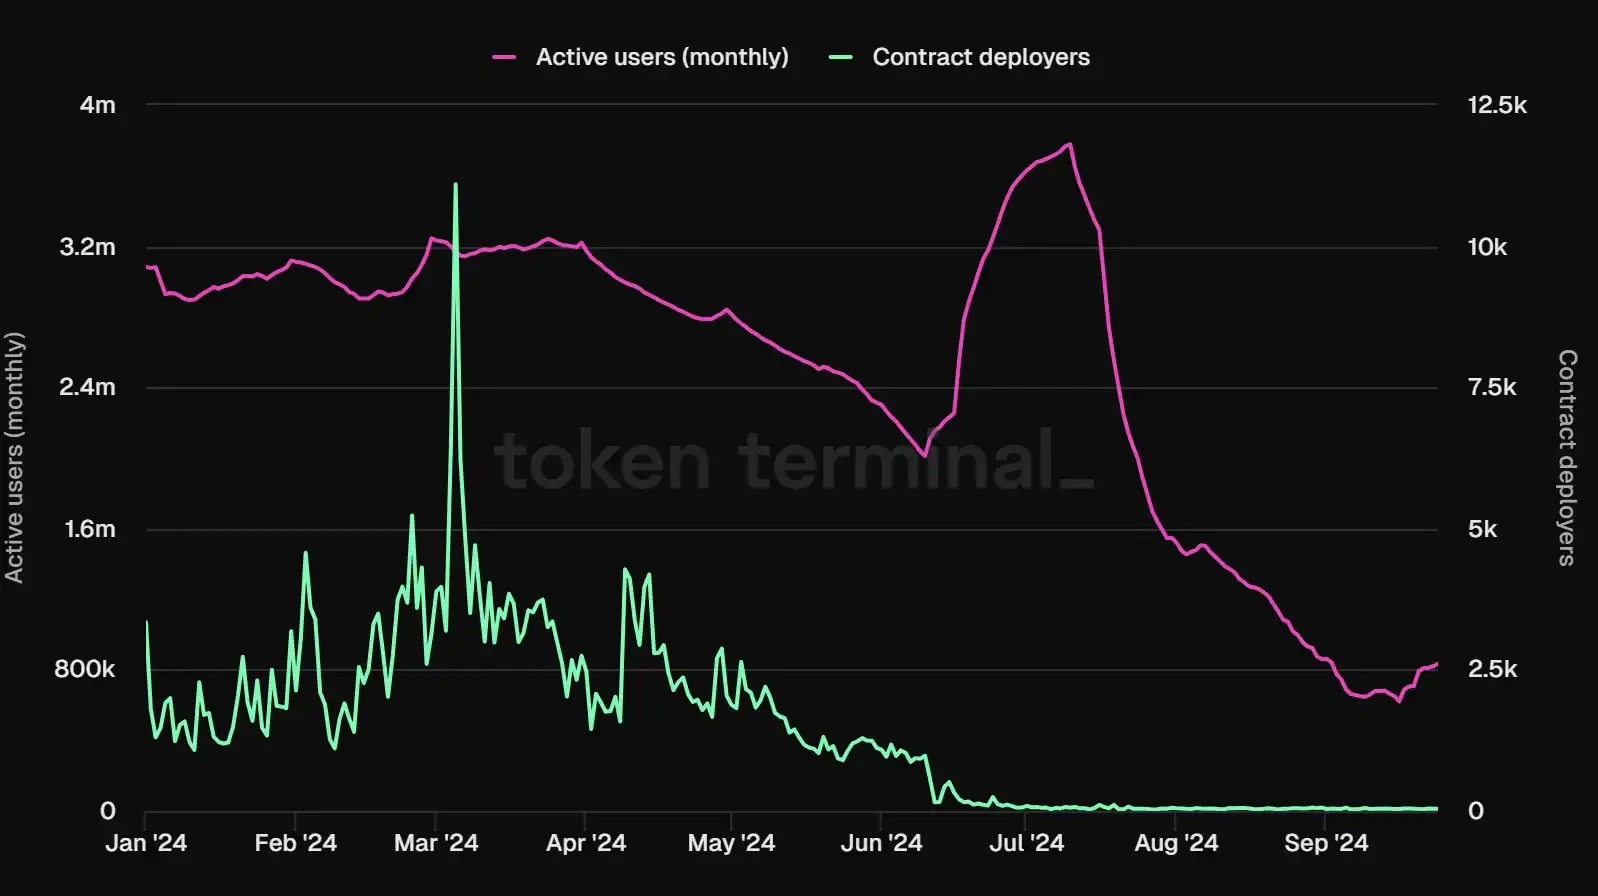
zkSync monthly active user data, data source: Tokenterminal
Clearly, zkSync has realized the issues of its weak ecosystem and the loss of existing users in the fierce L2 competitive landscape. zkSync's TVL has increased from $76 million on September 20 to $140 million, successfully doubling. The recent fluctuations in TVL are mainly attributed to the Venus Core Protocol, which grew by 2434% within a week. At the same time, zkSync recently became the third-ranked L2 in terms of weekly active users, but there is still an order of magnitude difference compared to Arbitrum and Base. Although zkSync is making a strong push recently, it still has a long way to go.
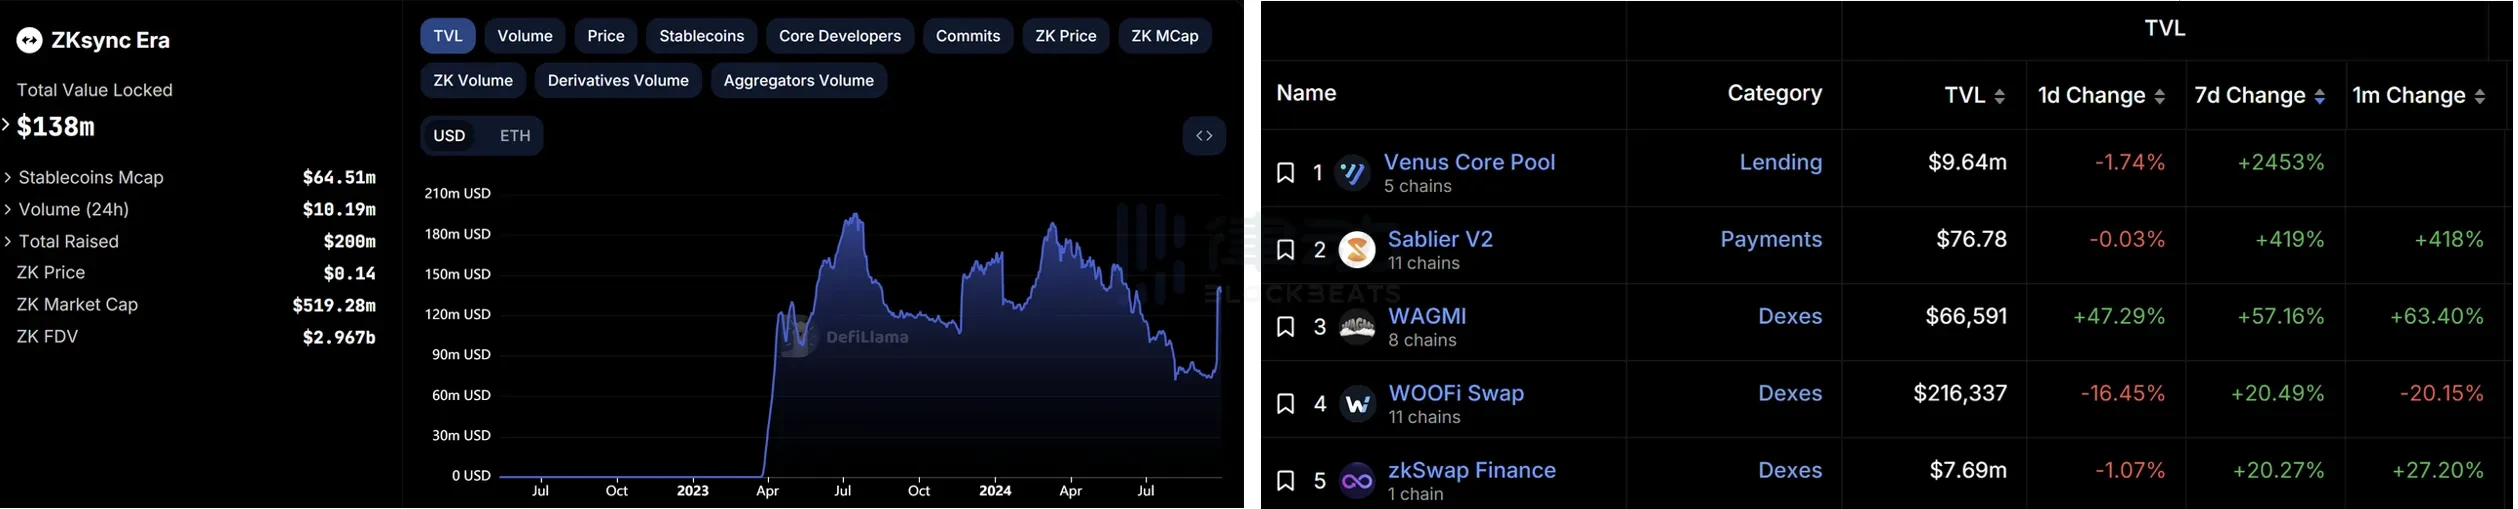
Left: zkSync TVL growth situation; Right: zkSync TVL distribution, data source: DefiLlama
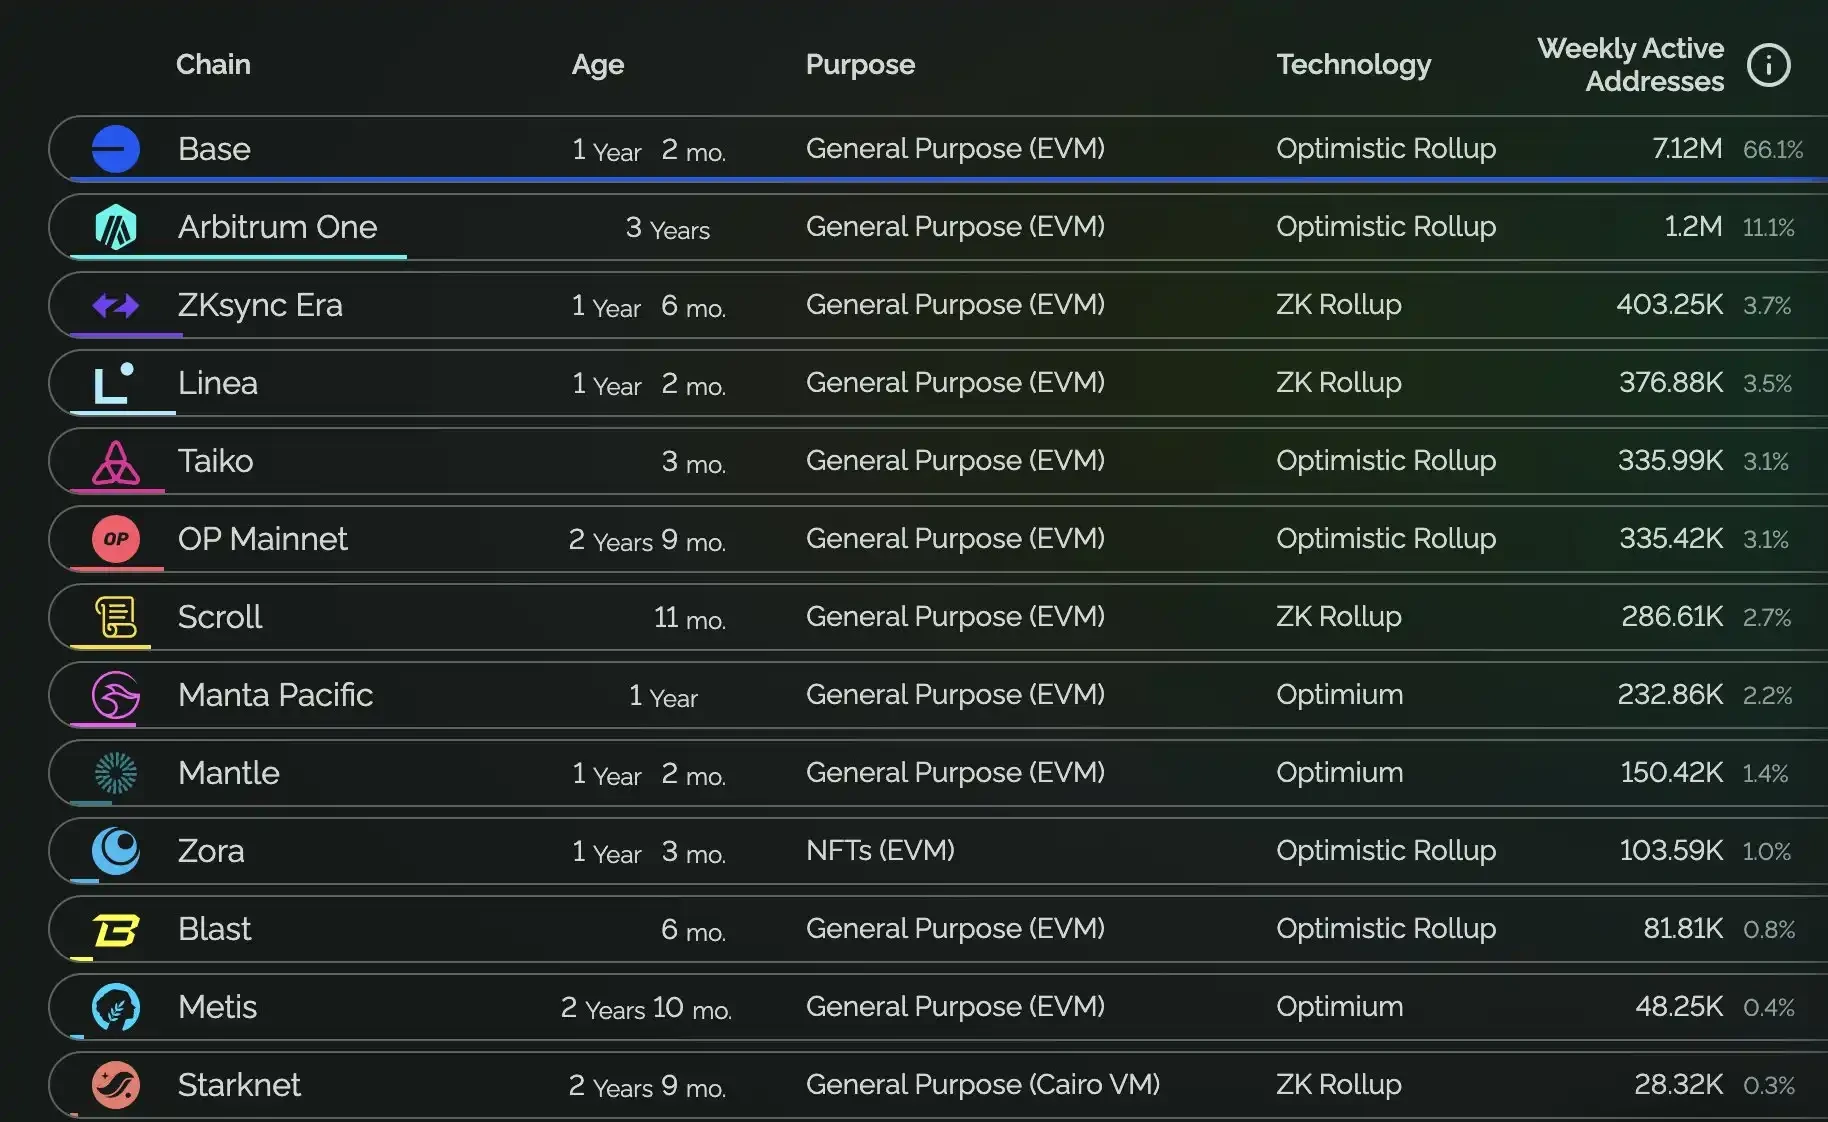
L2 weekly address activity ranking, data source: L2BEAT
As for the token economics of the above L2s, except for Base, which has not issued a token, the native tokens of the other L2s almost only serve governance functions. Although L2s are the right-hand man of Ethereum, users do not need to consume their native tokens during actual transactions, as they still pay GAS in ETH. This also determines that if each L2 does not develop an ecosystem that attracts users, it can only serve as a cost-saving "transit chain." Vitalik, who holds the highest authority in the Ethereum ecosystem, recently advocated for aligning the entire Ethereum ecosystem. Now, the development of the L2 track not only needs to consider the objective economic laws of market operation but also adds many uncontrollable "political" factors.
Summary
For current infrastructure projects with large valuations, maintaining a high FDV relies more on the imaginative space of their narratives. However, the exaggerated valuations of infrastructure projects, which do not match their actual operating conditions, could lead the market into the bubble of the last bull market, where everyone wants to earn passive income. This mindset poses the risk of a tragedy of the commons for Crypto.
免责声明:本文章仅代表作者个人观点,不代表本平台的立场和观点。本文章仅供信息分享,不构成对任何人的任何投资建议。用户与作者之间的任何争议,与本平台无关。如网页中刊载的文章或图片涉及侵权,请提供相关的权利证明和身份证明发送邮件到support@aicoin.com,本平台相关工作人员将会进行核查。


