Daily Sharing
After reaching 64745 yesterday, the price of Bitcoin experienced a continuous decline on the 15-minute chart, dropping to around 62700. In the short term, there may be another surge to 65000, but it's uncertain whether there will be such an opportunity. It is expected that there will be a 4-hour level pullback this week, with attention around 60000~61000.
If the 4-hour level pullback successfully occurs, it is recommended to consider buying or going long, as Bitcoin may accelerate its upward trend.
BTC
Due to the rapid changes in the market, the analysis in this article only applies to the moment it was published. Short-term traders should pay attention to the latest market changes and use the information as a reference only.
1H:
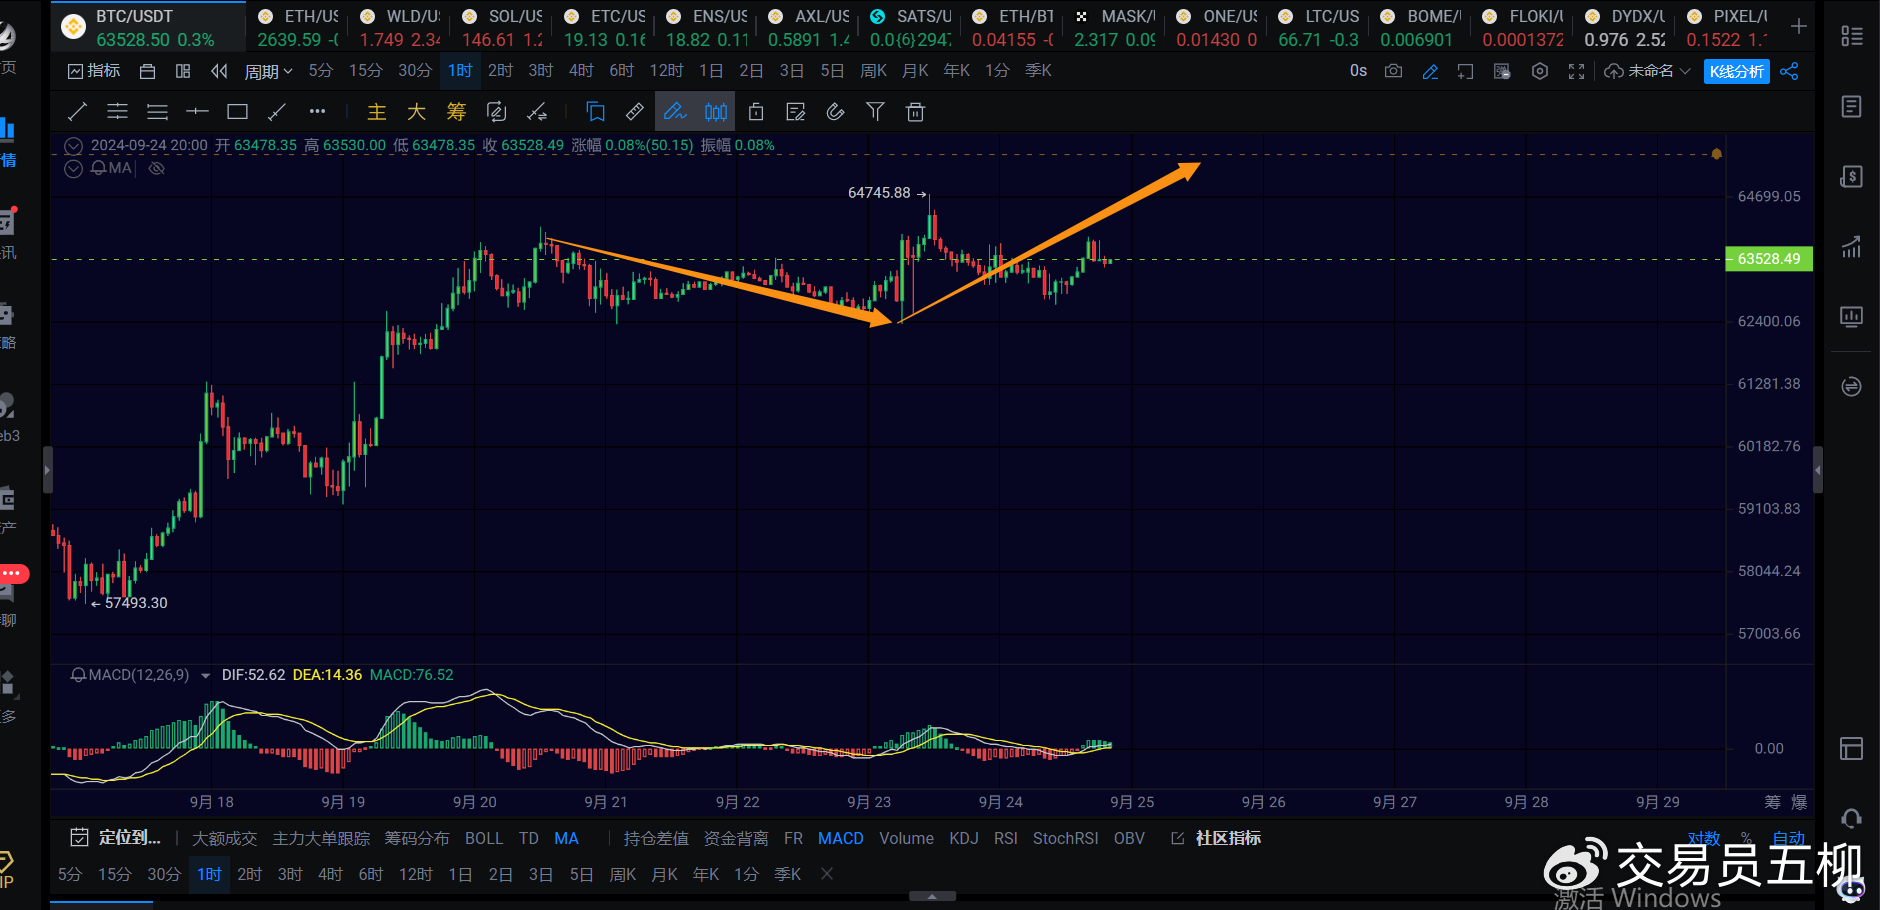
On the 1-hour chart, another surge to 65000 would complete the rebound structure perfectly. However, as the short-term pullback broke below 63000, it's necessary to prepare for a direct 1-hour level pullback.
The short-term strategy is to hope for a surge to 65000, which would lead to a perfect trend before starting the 4-hour level pullback. If the upward trend does not continue, a direct 4-hour level pullback may occur. Pullbacks are more likely, and short positions may not be favorable unless at a suitable position.
15M:
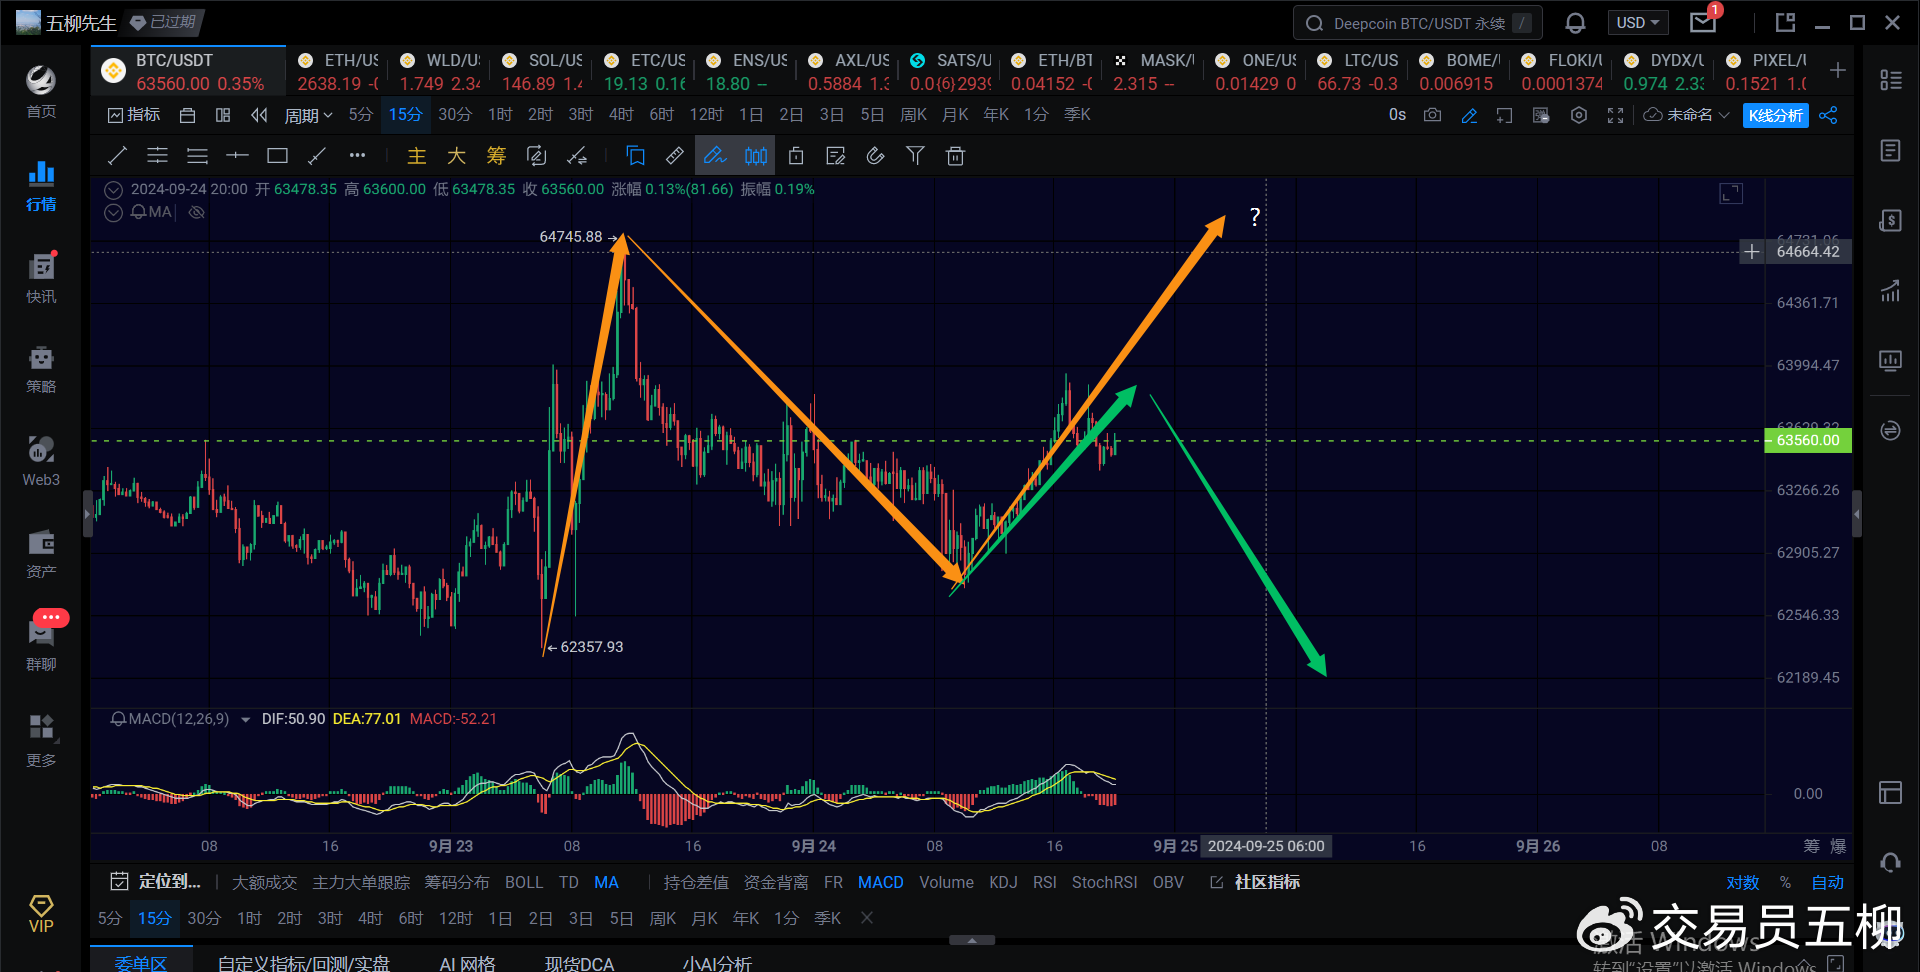
On the 15-minute chart, it is uncertain whether there will be another surge to 64745, as indicated by the yellow arrow, or if there will be another decline below 62700. If there is another decline below 62700, a direct 4-hour level pullback may occur, as shown by the green arrow in the image.
Due to the uncertainty of the short-term structure, it is advisable to observe the market first. If the yellow arrow goes up, consider shorting opportunities. If the green arrow goes down, consider long opportunities.
ETH
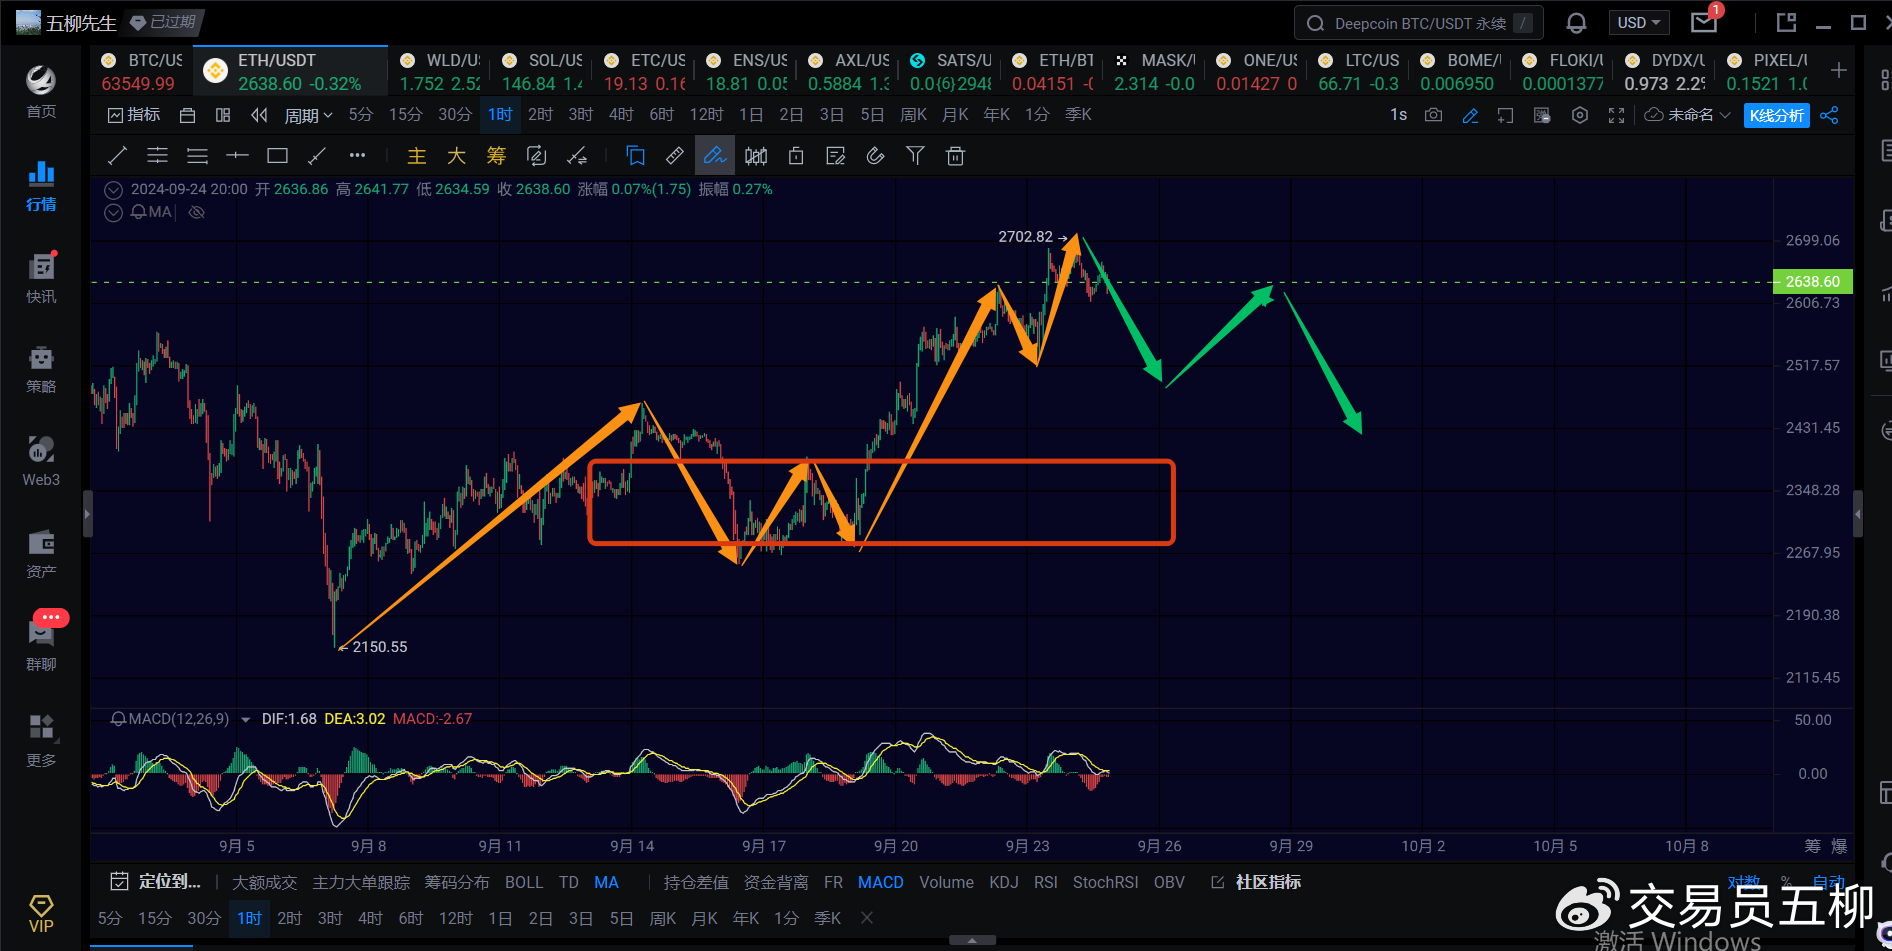
On the 1-hour chart of Ethereum, the current trend is close to perfect. Another surge to 2700 in the short term would be ideal, but the structure is already close to perfect without it. It is expected that a 4-hour level pullback will occur after another surge, and if the 4-hour pullback is successful, attention should be given to around 2450. A 1-hour pullback is expected in the short term, with attention around 2500.
Trend Direction
Weekly Chart: Downward direction, with the possibility of reaching around 49000, and a potential range of 45000~48000. Further observation is needed to confirm if the downward trend has ended.
Daily Chart: Upward direction, with a short-term target range of 67000~70000.
4-hour Chart: Upward direction, with the rebound on the 4-hour chart approaching its end. Observing whether there will be another surge in the short term.
1-hour Chart: Upward direction, with the 1-hour rebound considered successful if Bitcoin surges to 64745 again. Otherwise, a new 1-hour pullback may occur.
15-minute Chart: Upward direction.
Feel free to follow my public account for further discussion and exchange:

This article is time-sensitive. Please be aware of the risks involved. The views expressed in this article are personal opinions and are for reference only!
免责声明:本文章仅代表作者个人观点,不代表本平台的立场和观点。本文章仅供信息分享,不构成对任何人的任何投资建议。用户与作者之间的任何争议,与本平台无关。如网页中刊载的文章或图片涉及侵权,请提供相关的权利证明和身份证明发送邮件到support@aicoin.com,本平台相关工作人员将会进行核查。


