The previous article analyzed in depth the causes and consequences of the recent Fed rate cut. The core point is to tell everyone that any event is the result of various decision-making factors in the past. The rate cut is a signal for the bull market to start, which the author fully agrees with. However, we cannot rely solely on a correct statement to hastily enter the market. The rate cut does not mean that we have already entered a bull market at this moment.
In this article, I will further analyze and judge within the framework of the previous article to seek more solid evidence for bottom fishing.
From the fundamental logic of the cryptocurrency market—The bull market in the cryptocurrency market is not generated by a single piece of news, but by various policy news stimulating capital inflows into the cryptocurrency market. Only when money flows into the cryptocurrency market will prices rise. The fundamental logic is: policy news stimulates capital—capital flows into the cryptocurrency market—cryptocurrency prices rise—rising prices attract more capital, triggering a bull market.
The reason why everyone is enthusiastic about the rate cut this time is that the rate cut will release a large amount of US dollars. When there is more money in the market, asset prices, including Bitcoin, will passively rise. However, many people, including market analysis experts, have not mentioned one point: where does this money come from? Has this money already been released into the market, or will it be released at some point in the future?
I can now tell you clearly that this money was printed by Trump and Biden during their respective terms, totaling approximately $10 trillion. Why hasn't this money circulated in the market? It's because the Fed temporarily controlled this money in banks by raising the interest rate to 5.5%. As a reference, domestic banks, including funds, rarely have a return of more than 3%. In this situation, capital chooses to lie flat in the Fed for higher returns.
Even though the Fed has already started cutting rates, we can see that the first rate cut of 50 basis points still leaves the rate at 5%. This rate is still more attractive than in other global regions. So, just from the perspective of rate cuts, we can infer that the bull market has not yet started. For example, it's like telling athletes to prepare, but the referee has not given the starting signal. If you start running when you see the referee raise the starting gun, you will be penalized for breaking the rules.
The real sprint is from the Fed lowering the interest rate to the point where there is no interest rate differential in capital, which is the 3% threshold. When the interest rate is below 3%, money lying in the Fed will not yield enough returns, and it will naturally flow into the market. This is just the nature of capital seeking profit and cannot be decided by personal emotions.
According to the current path of Fed rate cuts and the official statements of the Fed, there will be two more rate cuts within this year, each by 25 basis points. So, the latest the interest rate will be lowered to 3% is June next year. If there are additional rate cuts of 50 basis points along the way, the earliest would be in March next year. Therefore, our bottom-fishing time window is concentrated from March to June, and the latest time to get on board is before the announcement of the rate cut in June, otherwise, it will be too late.
From the perspective of historical similarity—This bull market resulting from the rate cut is compared to the bull market in 2021. Both are the result of rate cuts, with the first rate cut being 50 basis points. However, what I want to tell you is that this rate cut is completely different from the one in 2021.
What was the environment like for the 2021 bull market in the cryptocurrency market? It was caused by the epidemic leading to three single-day circuit breakers in the US stock market, liquidity exhaustion, and the urgent need for the Fed to rescue the market. So, in addition to the rate cut that year, a large amount of liquidity was also injected, and the printing press was working overtime.
What is the external environment like this time? The US stock market is at a historical high. As of now, the US stock market is still at a high level. The US stock market's economy is experiencing high inflation, and the reason for high inflation is high interest rates. The reason for high interest rates is the large amount of debt, with a debt of $35 trillion, requiring an interest payment of $1.8 trillion per year. So, the US is on the verge of exploding due to high blood pressure, and the rate cut is like lowering blood pressure. If you understand this point, you won't have any delusions of persecution or various conspiracy theories.
In summary: This bull market will definitely not replicate the bull market of 2021. The situation is completely different, so don't expect the rate cut to immediately kickstart the bull market.
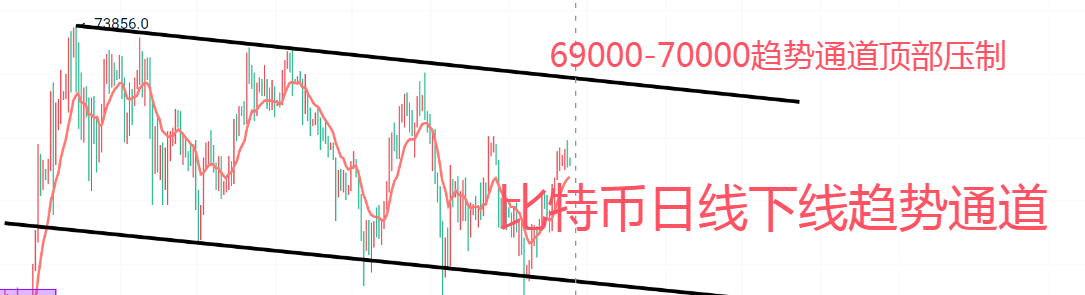
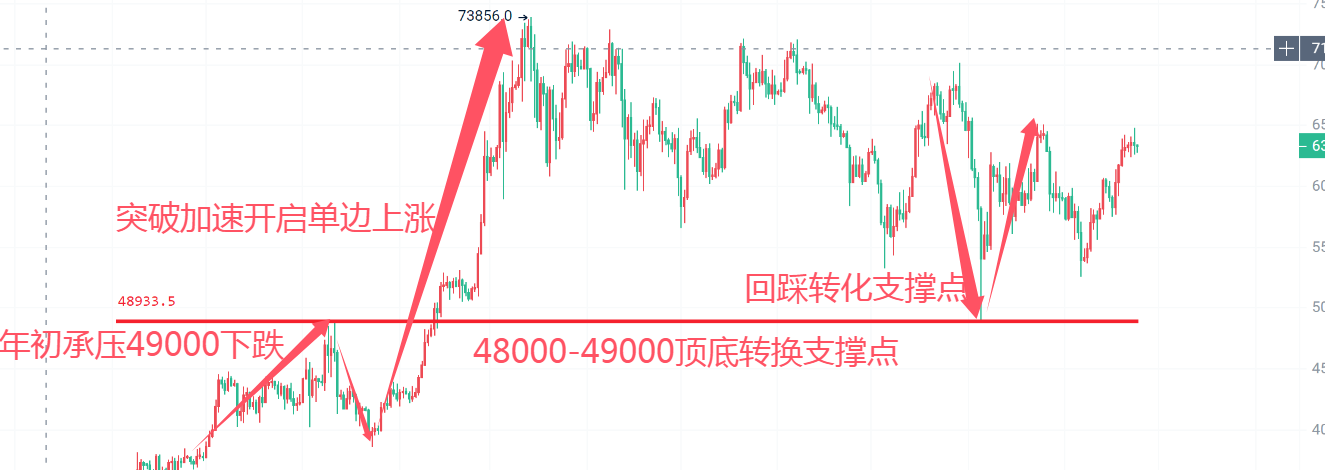
From a technical perspective—Currently, Bitcoin's daily chart is still in a large downward channel. To start a bull market, it is necessary for the price of Bitcoin to break through the 69,000-70,000 area, which is the top of the downward channel. Technically, only by breaking the downward channel can a trend reversal occur, leading to a frenzied bull market.
The characteristic of a bull market is the periodic formation of a bottom over a large range of cycles. During the bottoming phase, there is a long period of sideways movement, causing the market to lose confidence before starting to rise. However, the current market situation does not show any effective multiple bottoms or periodic sideways movement. On the contrary, the daily fluctuations are still very active, indicating high market participation but lacking any characteristics of a bull market.
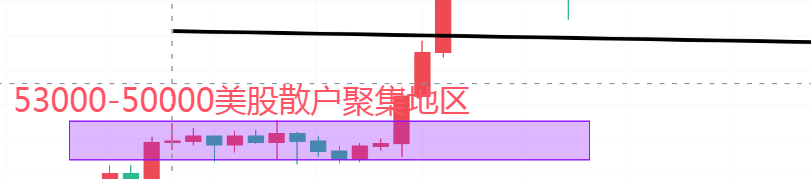
From the perspective of market chip distribution and market participants—In March 2024, the market situation for Bitcoin at the daily level showed periodic box oscillations, concentrated in the 50,000-53,000 range. March is the point when the Bitcoin ETF was listed. The appearance of box oscillations at the listing point is definitely not a coincidence but a manifestation of the entry of US stock retail investors. We can also determine that the 50,000-53,000 range is where US stock retail investors gather. To put it simply, the ETF can be understood as a spot product.
The characteristic of US stock retail investors is that they treat ETFs as one of the products in the US stock market and have a similar attitude towards US stocks as they do towards retirement insurance, holding for the long term to receive dividends. This is completely different from the speculative behavior in our domestic market, where we buy low and sell high based on price fluctuations. Both the scale of funds and the attitude towards investment are completely different, which means that these people will not easily exit the market. If the bull market were to start now, these retail investors would not only be beneficiaries but would also hinder the entry of institutional investors.
As market whales, institutional investors do not want anyone to divide the cake, nor can they tolerate retail investors sitting at the same table as them. Therefore, they must find ways to drive people out of the market. Here, the author simulates possible fluctuations based on the needs and pain points of various market participants.
The current market situation shows: It is known that 69,000-70,000 is the top of the daily downward channel. Breaking this position means the end of the downward trend and the start of a one-way upward trend.
It is known that 53,000-50,000 is where US stock retail investors gather.
It is known that 48,000 was the highest point of the uptrend in January this year. In August, it acted as the strongest support after piercing 48,000, confirming the technical turning point.
Retail investor perspective: The rate cut is great news, the bull market is here. The current price is in the middle, not a good entry point. Need to wait for a pullback to see if the price can drop to 53,000-48,000. If it doesn't pull back, and breaks the 70,000 downward trend channel, then consider adding more positions.
US stock retail investor perspective: I didn't sell when it surged to 70,000 multiple times in the first half of the year. In August, it unexpectedly plummeted to 48,000, but fortunately, it held up and confirmed the strongest support level. The rate cut has come, as long as it doesn't fall below 48,000, the price will only go higher in the future.
At this point, understanding the needs and pain points of retail investors, as a market maker, continuing to push the market higher at this point without breaking 70,000 is meaningless. If it breaks 70,000, combined with the rate cut boost and the completion of the bull market sprint in terms of trend, even if there is further selling pressure, it won't shake the spot market. After all, everyone knows that next year will be a big bull market. If you break through 70,000 at the end of the year and then sell off, apart from catching some contract retail investors, the spot market won't care about you. Selling off will actually provide an opportunity for people to add to their positions.
Since pushing up to 70,000 is causing trouble for the market makers themselves, the possibility of further increases is ruled out. Now, there are only two paths left: consolidation and decline. If the market continues to consolidate, the spot market is in a profitable state, and with the passage of time, the impact of the rate cut will become stronger, bringing the bull market closer, making it even less likely for the spot market to exit. Now, there is only one path left—decline.
After determining the path of decline, let's consider how far it can fall. US stock retail investors are confident that 48,000 is the support level after the top-to-bottom reversal. Regular retail investors see 53,000-50,000 as the gathering place for long positions, with strong support at 48,000 below. When the market falls to the 50,000-53,000 range, it will gradually attract bottom fishers. The further it falls, the more people will bottom fish. When the market falls below 48,000 again and accelerates downward, it will be the stage of concentrated market panic. At this point, all retail investors will be forced to cut their losses or exit. Even die-hard holders who withstand the panic decline will find their positions at risk during subsequent rallies, as the bottom structure has been broken and they could be forced to exit early due to a significant pullback or sudden news-induced decline.
Follow our WeChat public account for first-hand cryptocurrency information. Pionex provides real-time positions, practical teaching, complete layout planning, and reasonable theoretical support. Join our live trading sessions every evening. Our cryptocurrency exchange group welcomes knowledgeable individuals from all over. Don't ask me how profitable it is, just follow the rhythm of the hunter, make money quickly, and look handsome!
免责声明:本文章仅代表作者个人观点,不代表本平台的立场和观点。本文章仅供信息分享,不构成对任何人的任何投资建议。用户与作者之间的任何争议,与本平台无关。如网页中刊载的文章或图片涉及侵权,请提供相关的权利证明和身份证明发送邮件到support@aicoin.com,本平台相关工作人员将会进行核查。


