Coin Circle Liying: The dual opportunity of Bitcoin and Ethereum on September 23: Who will lead the market? Latest market analysis
Article release time: 2024.9.23----07:25
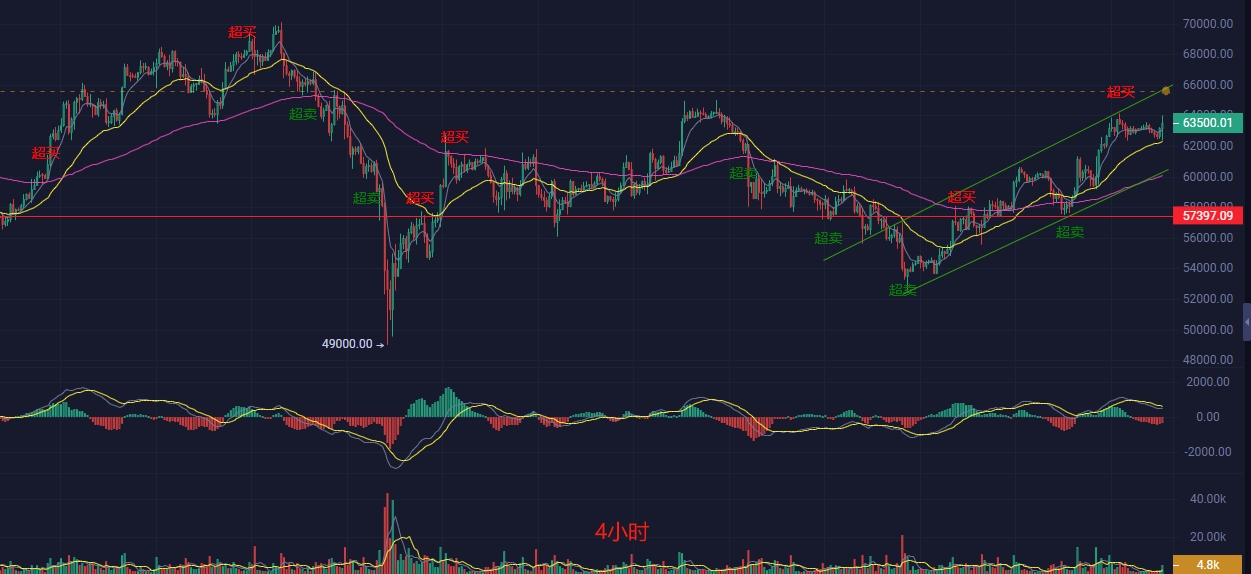
After yesterday's market exploration, it rebounded to the support point of 62500 after probing the bottom, providing a clear entry point. It is highly probable that the market will reclaim the previous high this Monday. Let's take a look at the current performance of the K-line in the market. The current price is fluctuating in the range of 63000 to 64000, forming a relatively stable oscillation range. However, there was a clear upward trend in the early stage, from the low point of 59150 on the 18th to the high point of 64150 on the 20th. However, it then entered a phase of adjustment, indicating that the bullish momentum is insufficient and a retracement is needed to absorb funds.
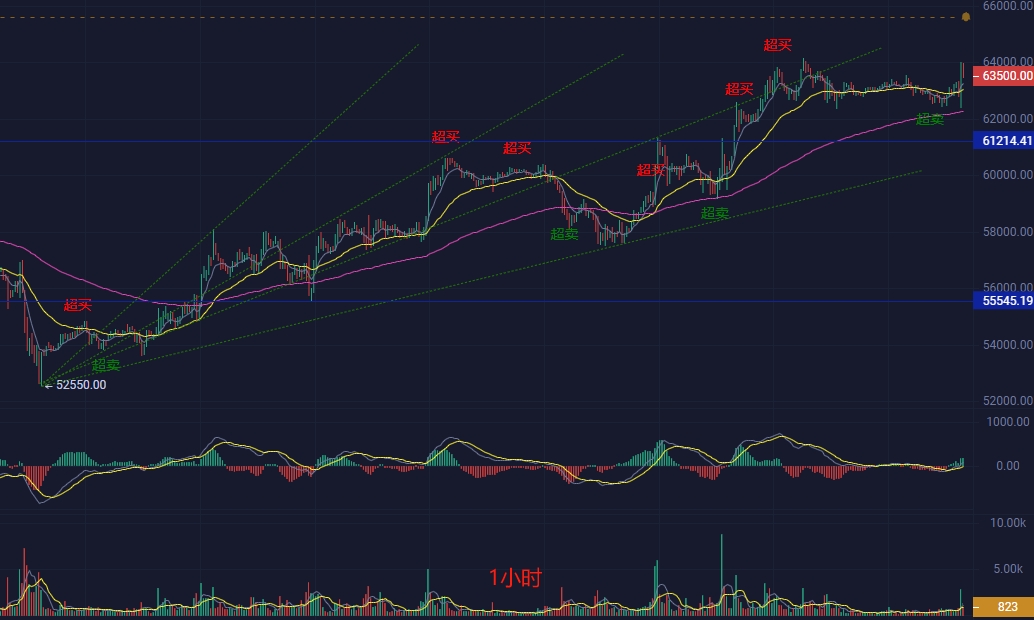
The fast and slow lines DIF and DEA of the 4-hour MACD are both above the zero axis, indicating significant short-term retracement pressure. The daily MACD still maintains a bullish arrangement, indicating that the trend is still bullish. A short-term retracement is an opportunity to enter the market. The 4-hour RSI is currently at 63.8, indicating that the upward space has not been fully realized. The daily RSI is also above 60, supporting the overall upward trend. The current price is above EMA7, EMA30, and EMA120, a typical bullish arrangement.
Today's reference points: Trend (up)
Long at 63000, defend at 62500, stop loss at 62000, target at 65000
Short at 65000, defend at 65500, stop loss at 66500, target at 63000
Ethereum
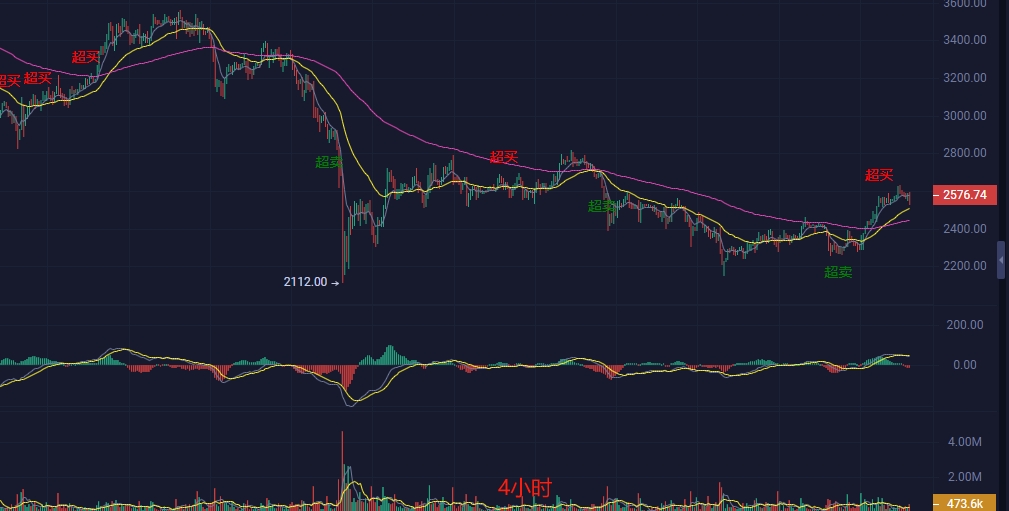
The large-scale trend has clearly formed a U-shaped closing pattern. The K-line pattern at the 4-hour level has been fluctuating within the range of 2500 and 2600 recently, showing an overall oscillating upward trend. The appearance of multiple long lower shadow lines in the K-line indicates strong support below, without providing a clear support point, and has not fallen below 2500. Fortunately, it returned to 2550, providing the first entry point for long positions.
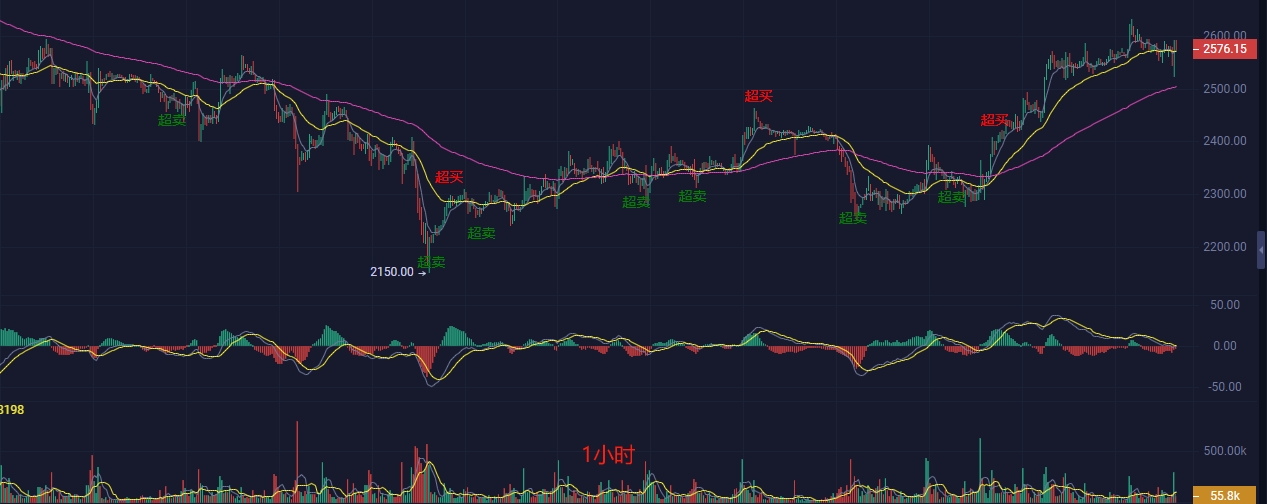
Looking at the MACD technical indicators again, the average values of DIF and DEA are gradually stabilizing, and the MACD histogram has turned from negative to positive. From this, it can be judged that the short-term area between 2520 and 2630 is a high-density area. The RSI14 value hovers between 60 and 70, but if it continues to stay at a high level, it indicates a strong market, and the bullish trend will once again stretch. The short, medium, and long-term EMA lines are in a bullish arrangement, supporting the upward trend.
Today's latest reference points (up)
Long at 2550, additional position at 2520, stop loss at 2490, target at 2650
Short at 2650, additional position at 2700, stop loss at 2730, target at 2550
The content of the article is time-sensitive and is for reference only. Trade at your own risk.

The above analysis by Liying is based on market data and trend analysis of the market, and is for reference only. It does not constitute investment advice. For the reference of family members. Over the past decade, Liying has continuously explored and experienced hundreds of different types of digital assets. In this process, Liying has experienced the brilliance of the bull market and the dimness of the bear market, accumulating numerous valuable experiences and profound lessons. As a female trader who has been striving in this challenging field, Liying deeply feels the responsibility to share her insights and hopes to help others with dreams to find their own position in this unpredictable market and embark on their journey to success.
免责声明:本文章仅代表作者个人观点,不代表本平台的立场和观点。本文章仅供信息分享,不构成对任何人的任何投资建议。用户与作者之间的任何争议,与本平台无关。如网页中刊载的文章或图片涉及侵权,请提供相关的权利证明和身份证明发送邮件到support@aicoin.com,本平台相关工作人员将会进行核查。


