Author of the original article: Chainalysis Team
Original translation: Deep Tide TechFlow
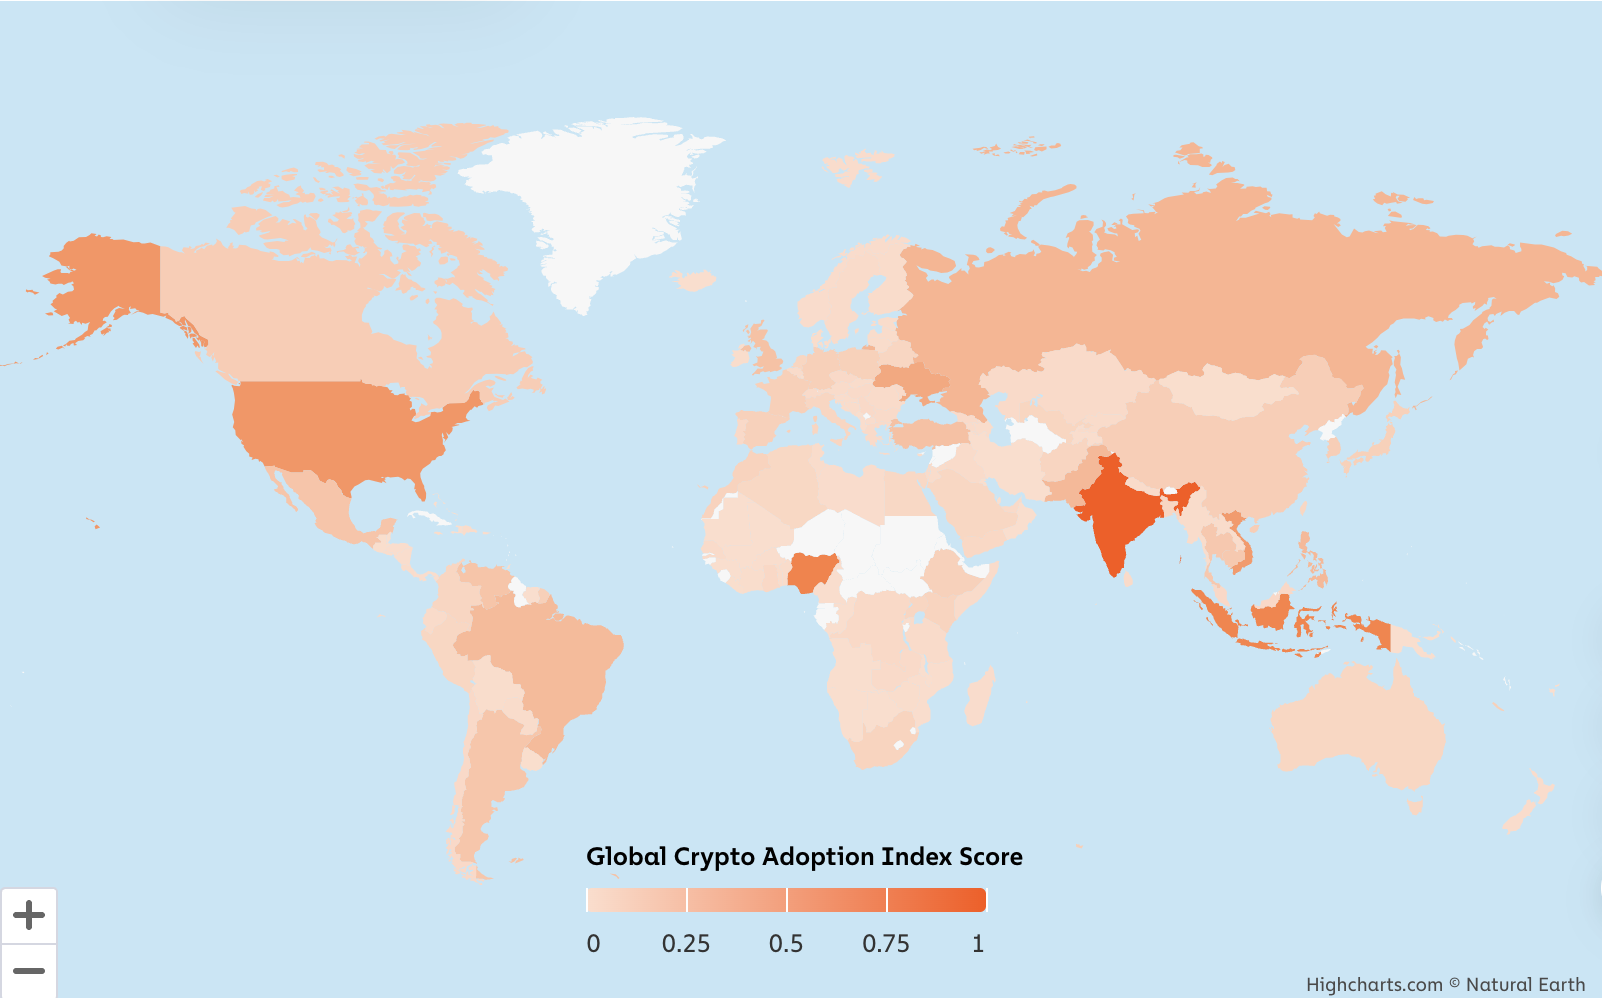
Check the ranking of your country in the 2024 Chainalysis Global Cryptocurrency Adoption Index through the interactive map.
This article is excerpted from our 2024 "Cryptocurrency Geography Report".
We are pleased to share the fifth annual Chainalysis Global Cryptocurrency Adoption Index. In each year's report, we analyze on-chain and off-chain data to determine which countries are leading in the grassroots adoption of cryptocurrencies. Our research highlights the unique cryptocurrency use cases forming in countries and explores why people around the world are choosing to embrace cryptocurrencies.
Continue reading to learn more:
Methodology of our Global Cryptocurrency Adoption Index
The Global Cryptocurrency Adoption Index consists of four sub-indices, each based on the usage of different types of cryptocurrency services by various countries. We rank all 151 countries that have sufficient data on each sub-index. We weight the rankings based on characteristics such as population size and purchasing power, calculate the geometric mean of each country in the four sub-indices, and then normalize the final results to a range of 0 to 1, giving each country a score to determine its overall ranking. The closer a country's final score is to 1, the higher its ranking.
To calculate our sub-indices, we estimate the transaction volume of different types of cryptocurrency services and protocols based on the network traffic patterns of these services and protocol websites. We acknowledge the limitations of network traffic data, as some cryptocurrency users may use tools such as VPNs to conceal their actual physical location. However, considering that our index covers billions of cryptocurrency transactions and over 13 billion web page visits, any misattribution of transaction volume due to VPNs is negligible in such a large dataset. We also compare the research results with insights from global local cryptocurrency experts and operators, which enhances our confidence in this approach.
Below are the descriptions and calculation methods of the sub-indices, as well as improvements in our methodology since last year.
Sub-index Category 1: On-chain cryptocurrency value received by centralized services adjusted by purchasing power parity (PPP) per capita GDP
We introduce this sub-index to rank countries based on the total cryptocurrency value received by centralized services and weight the rankings to favor countries where this amount is relatively higher compared to the average income. To calculate this, we estimate the total value received on-chain by users of centralized services in each country and weight it by the purchasing power parity (PPP) adjusted per capita GDP, reflecting the income of each resident. The higher the ratio of on-chain received value to PPP-adjusted per capita GDP, the higher the ranking. In other words, if two countries receive the same amount of cryptocurrency on centralized services, the country with lower per capita GDP will rank higher.
Sub-index Category 2: On-chain retail cryptocurrency value received by centralized services adjusted by purchasing power parity (PPP) per capita GDP
We also estimate the activities of non-professional individual cryptocurrency users on centralized services, based on the comparison of the cryptocurrency value they transact with the average purchasing power. We achieve this by estimating the cryptocurrency value received by users on centralized services in each country, but only for retail transactions with a value below $10,000. We then rank countries based on this indicator and weight the rankings to favor countries with lower per capita GDP (adjusted by purchasing power parity, PPP).
Sub-index Category 3: On-chain cryptocurrency value received through decentralized finance (DeFi) protocols adjusted by purchasing power parity (PPP) per capita GDP
We rank countries based on their DeFi transaction volume and weight the rankings to favor countries with lower per capita GDP (adjusted by purchasing power parity, PPP).
Sub-index Category 4: On-chain retail cryptocurrency value received through decentralized finance (DeFi) protocols adjusted by purchasing power parity (PPP) per capita GDP
We rank countries based on their DeFi transaction volume in retail-scale transfers (also cryptocurrency values below $10,000) and weight the rankings to favor countries with lower per capita GDP (adjusted by purchasing power parity, PPP).
Methodology Changes
Methodology Change 1: Measuring decentralized finance (DeFi) activity
The main change in this year's methodology is how we measure the cryptocurrency value received by decentralized protocols. For DeFi services, we only consider the received value from suspicious individual wallets, excluding the received value from other known DeFi wallets. This new methodology ensures that the total received value is not inflated by intermediary steps required by certain smart contracts.
Here is an example of how decentralized finance (DeFi) transfers typically operate:
An individual wallet initiates a swap in DeFi protocol A, transferring Ether (ETH) from the individual wallet to the router contract address of DeFi protocol A.
ETH is deposited from the router contract address into the wrapped Ether (wETH) token contract.
The router contract receives wETH.
Transfers are made from the DEX pool contract to the router contract.
Transfers are made from the DEX pool contract to the router contract.
Finally, transfers are made from the router contract back to the individual wallet.
According to our new methodology, we only calculate the value of the first transfer in the example above to determine the total value received by DeFi protocols. This way, we can eliminate intermediary transfers between service providers. This process results in a reduction in our estimation of received value, but the estimation is now more accurate.
Methodology Change 2: Excluding P2P exchange sub-index
In the past few years, we included P2P cryptocurrency trading volume in our calculations, weighted by purchasing power parity (PPP) and the number of internet users, to calculate the overall global cryptocurrency adoption ranking. This year, we have decided to exclude this sub-index due to a significant decrease in the activity of P2P exchanges. One of the oldest P2P exchanges, LocalBitcoins.com, closed last year, leading to this decline.
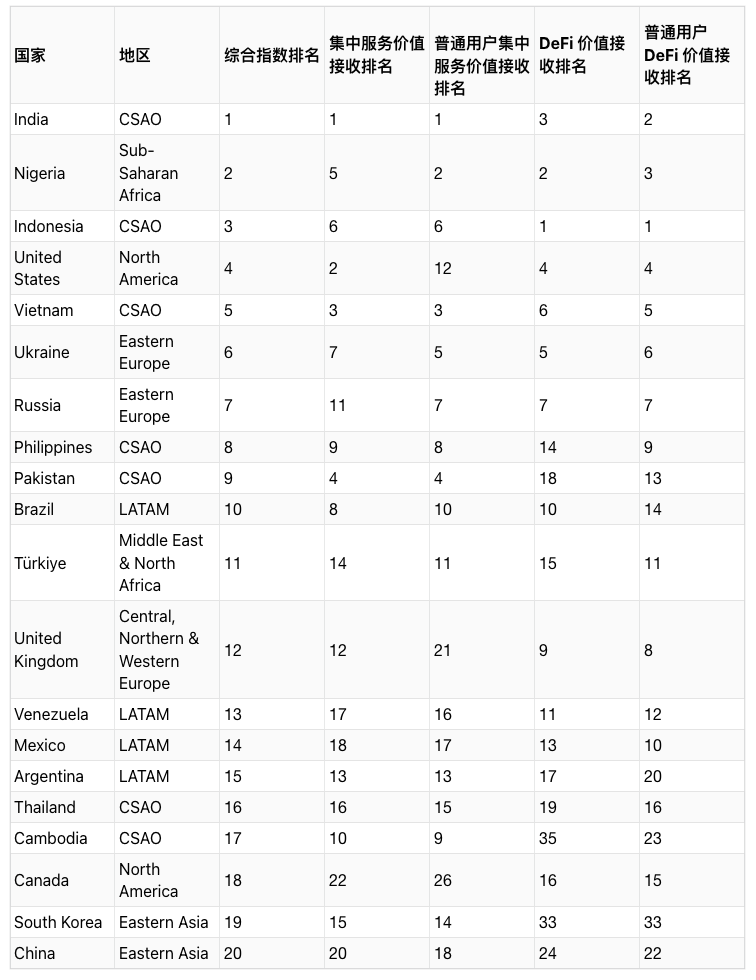
Top 20 Global Cryptocurrency Adoption Index in 2024
Central and Southern Asia and Oceania (CSAO) dominate our 2024 index, with seven countries from this region entering the top 20. As mentioned in the full report, CSAO has a range of unique cryptocurrency markets, with high levels of activity on local cryptocurrency exchanges and active participation in merchant services and decentralized finance (DeFi).
Continued Growth in Global Cryptocurrency Activity
The total value of global cryptocurrency activity saw a significant increase between the fourth quarter of 2023 and the first quarter of 2024, reaching levels higher than during the cryptocurrency bull market of 2021. We can observe this trend in the chart below, where we aggregated the index scores of 151 countries for each quarter from the third quarter of 2021 to the second quarter of 2024 and re-indexed them to show the growth of global adoption.
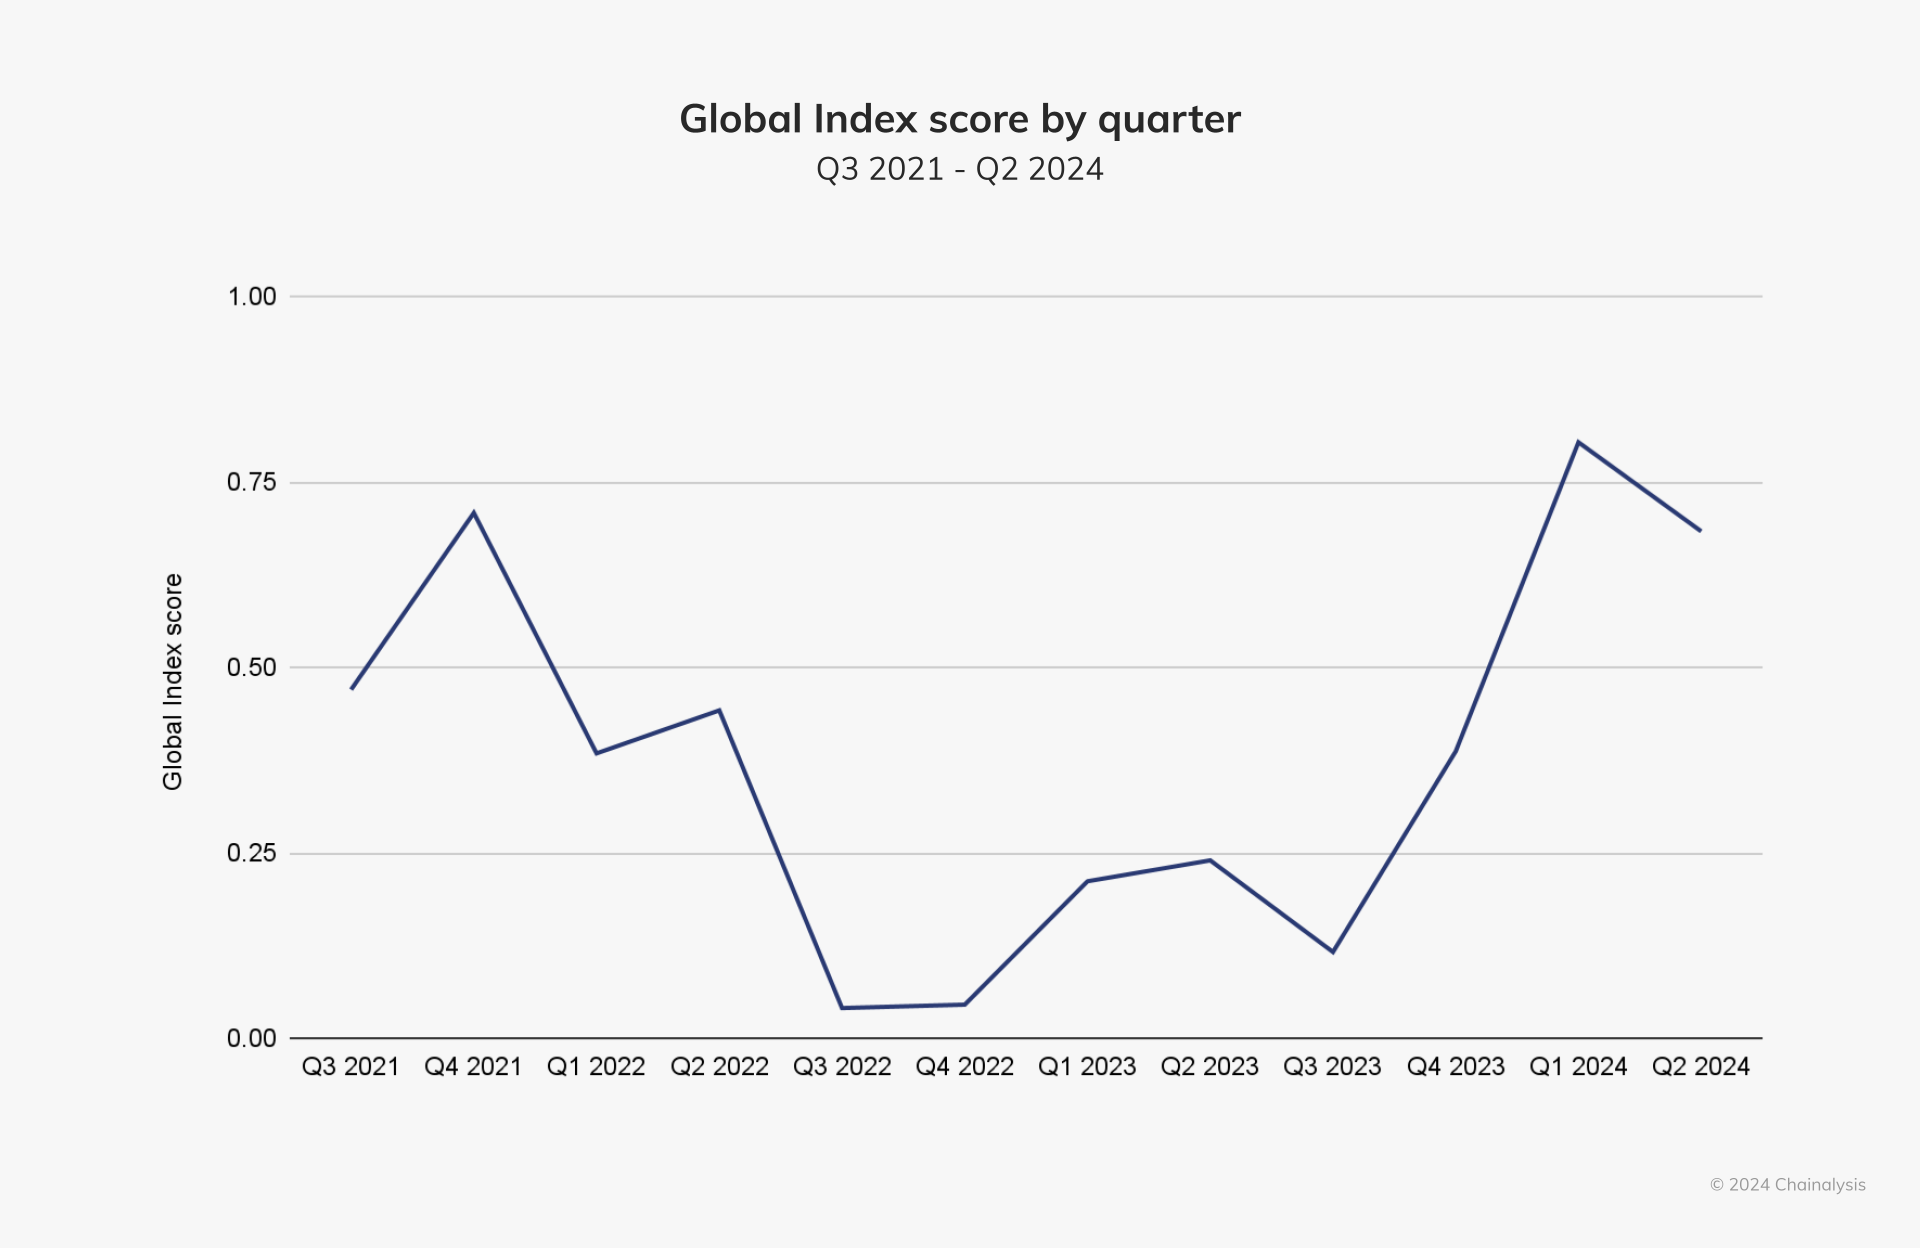
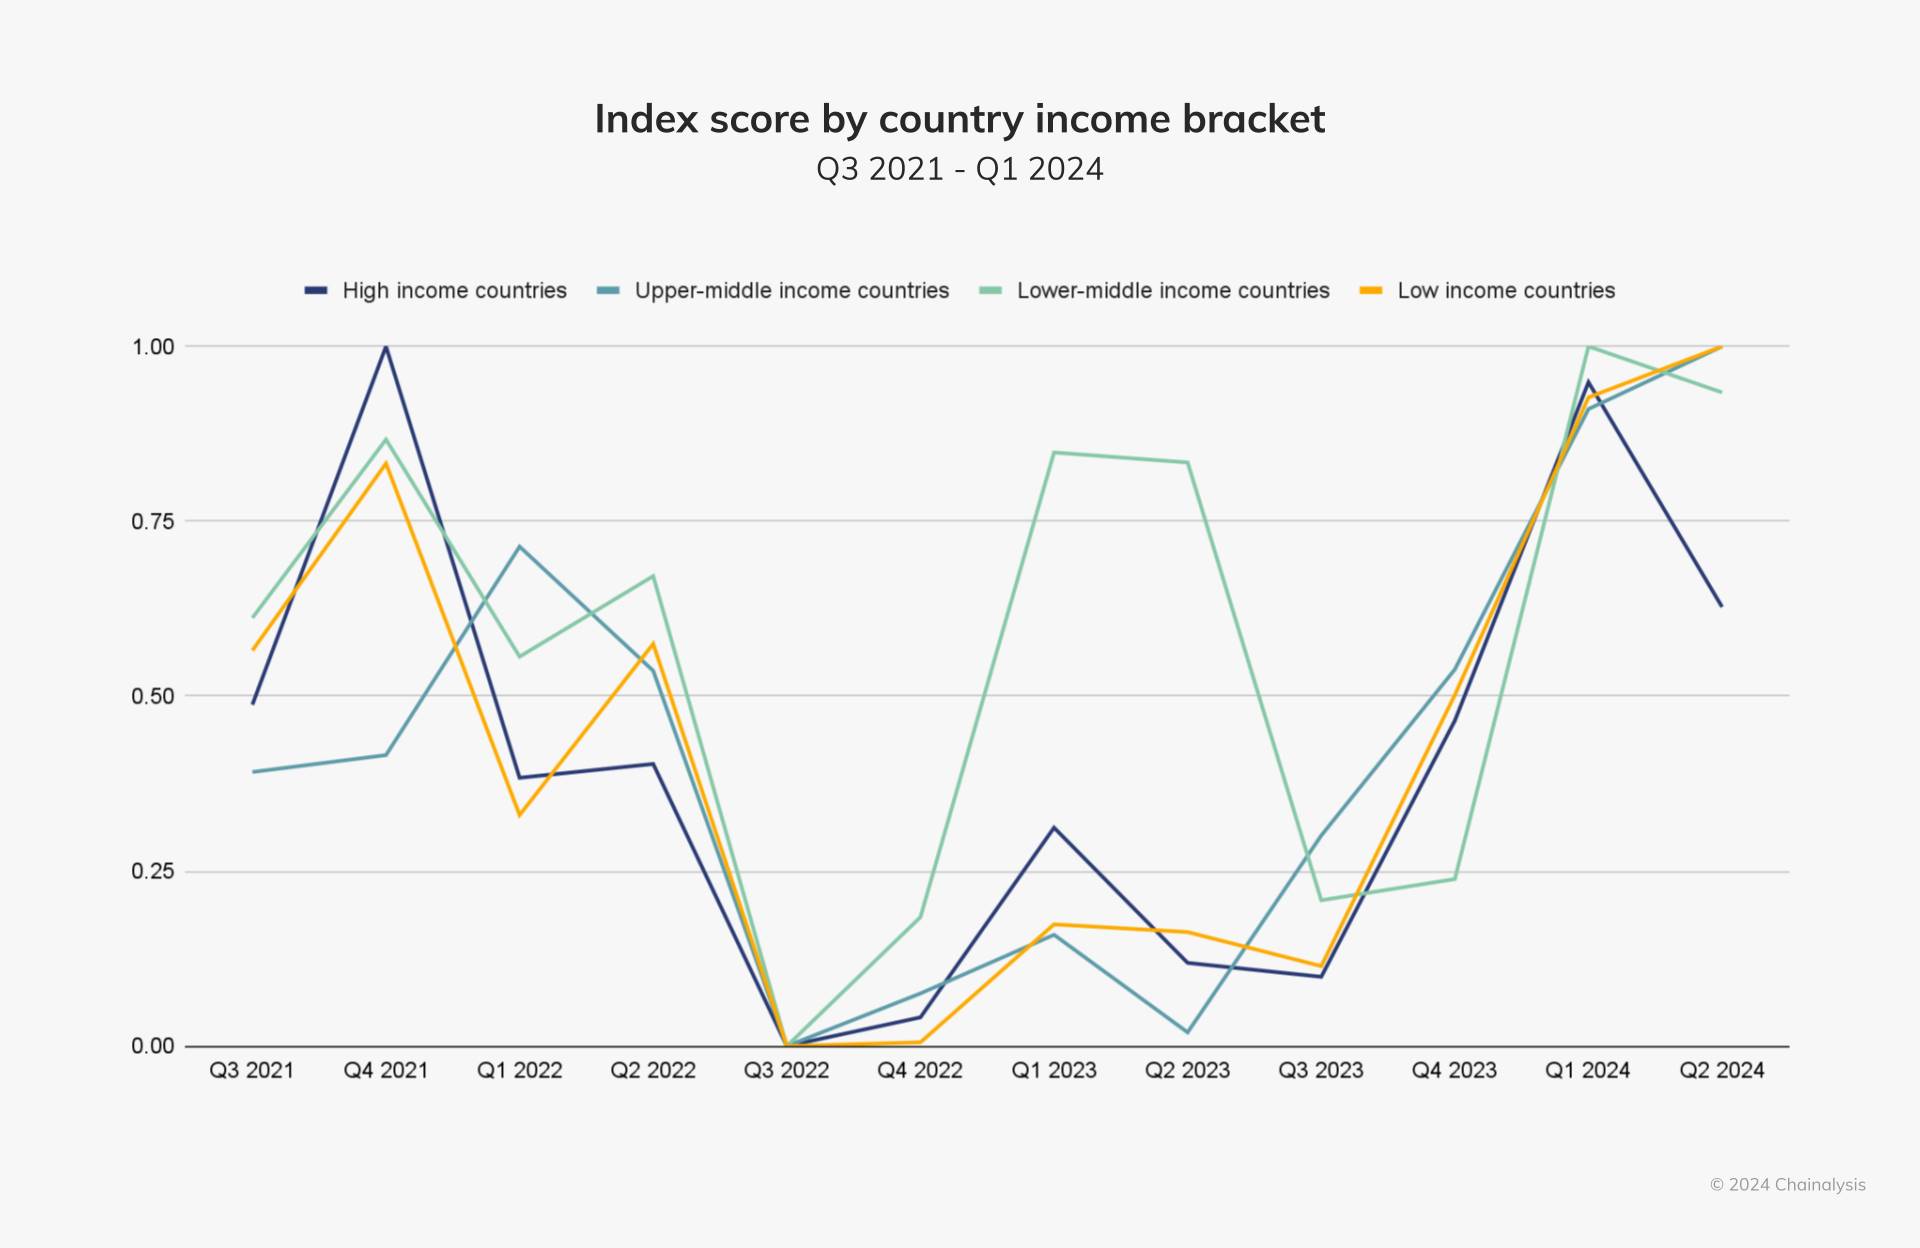
Last year, the growth in cryptocurrency adoption was mainly driven by low-income countries. However, this year, cryptocurrency activity has increased across all income levels, with a slight decline in high-income countries since the beginning of 2024.
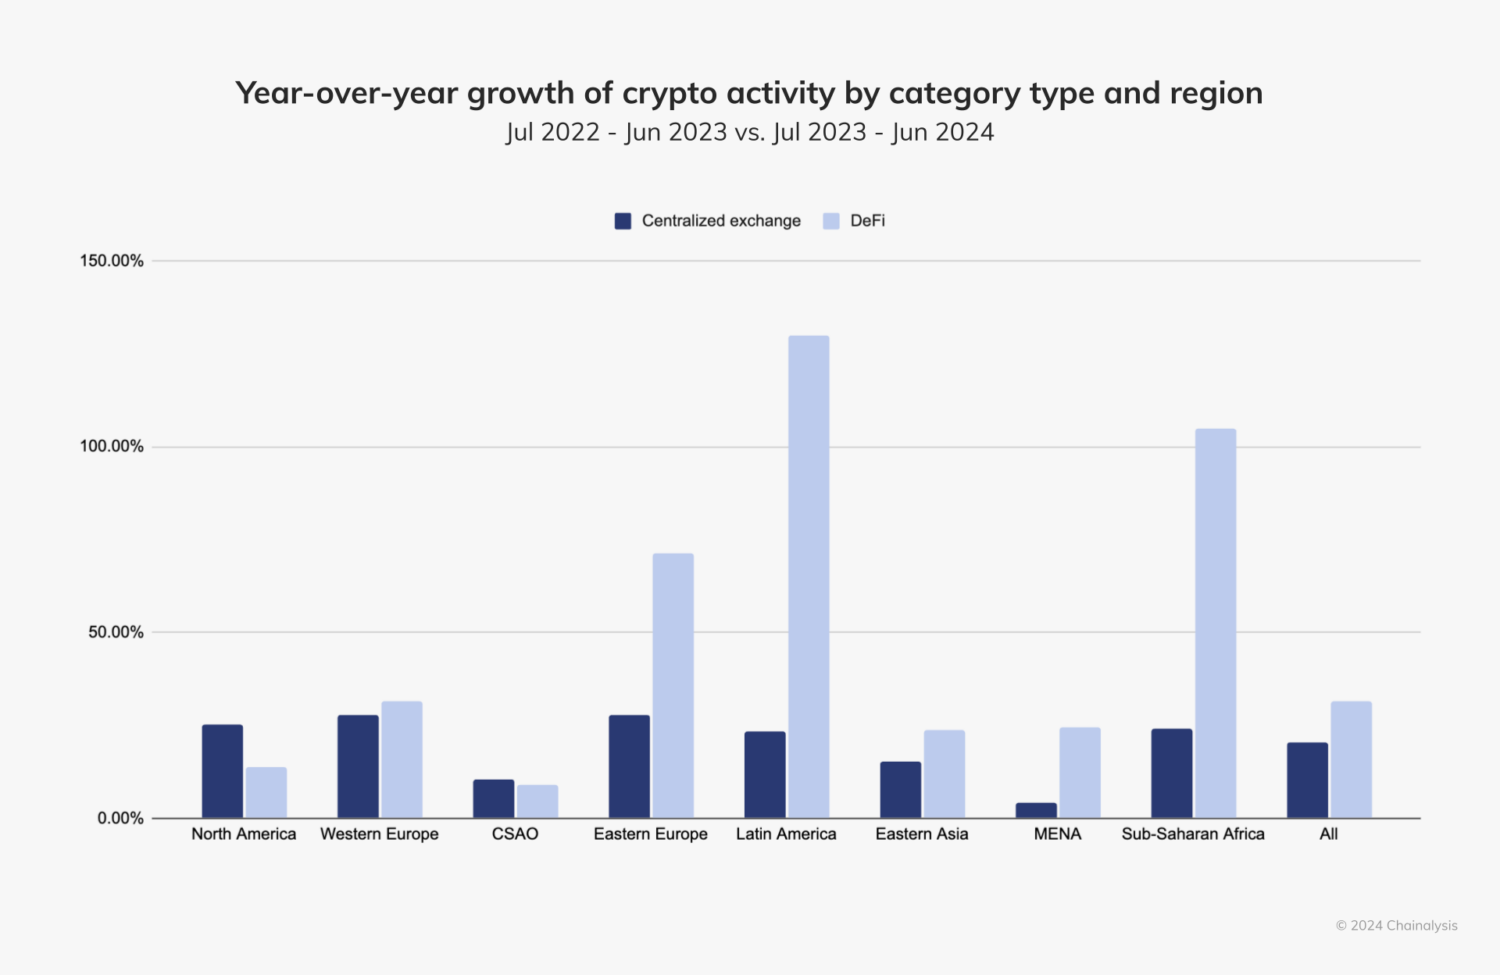
When observing the year-over-year growth in different service types, we find a significant increase in decentralized finance (DeFi) activity in Sub-Saharan Africa, Latin America, and Eastern Europe. As shown in the chart above, this growth may have led to an increase in altcoin activity in these regions.
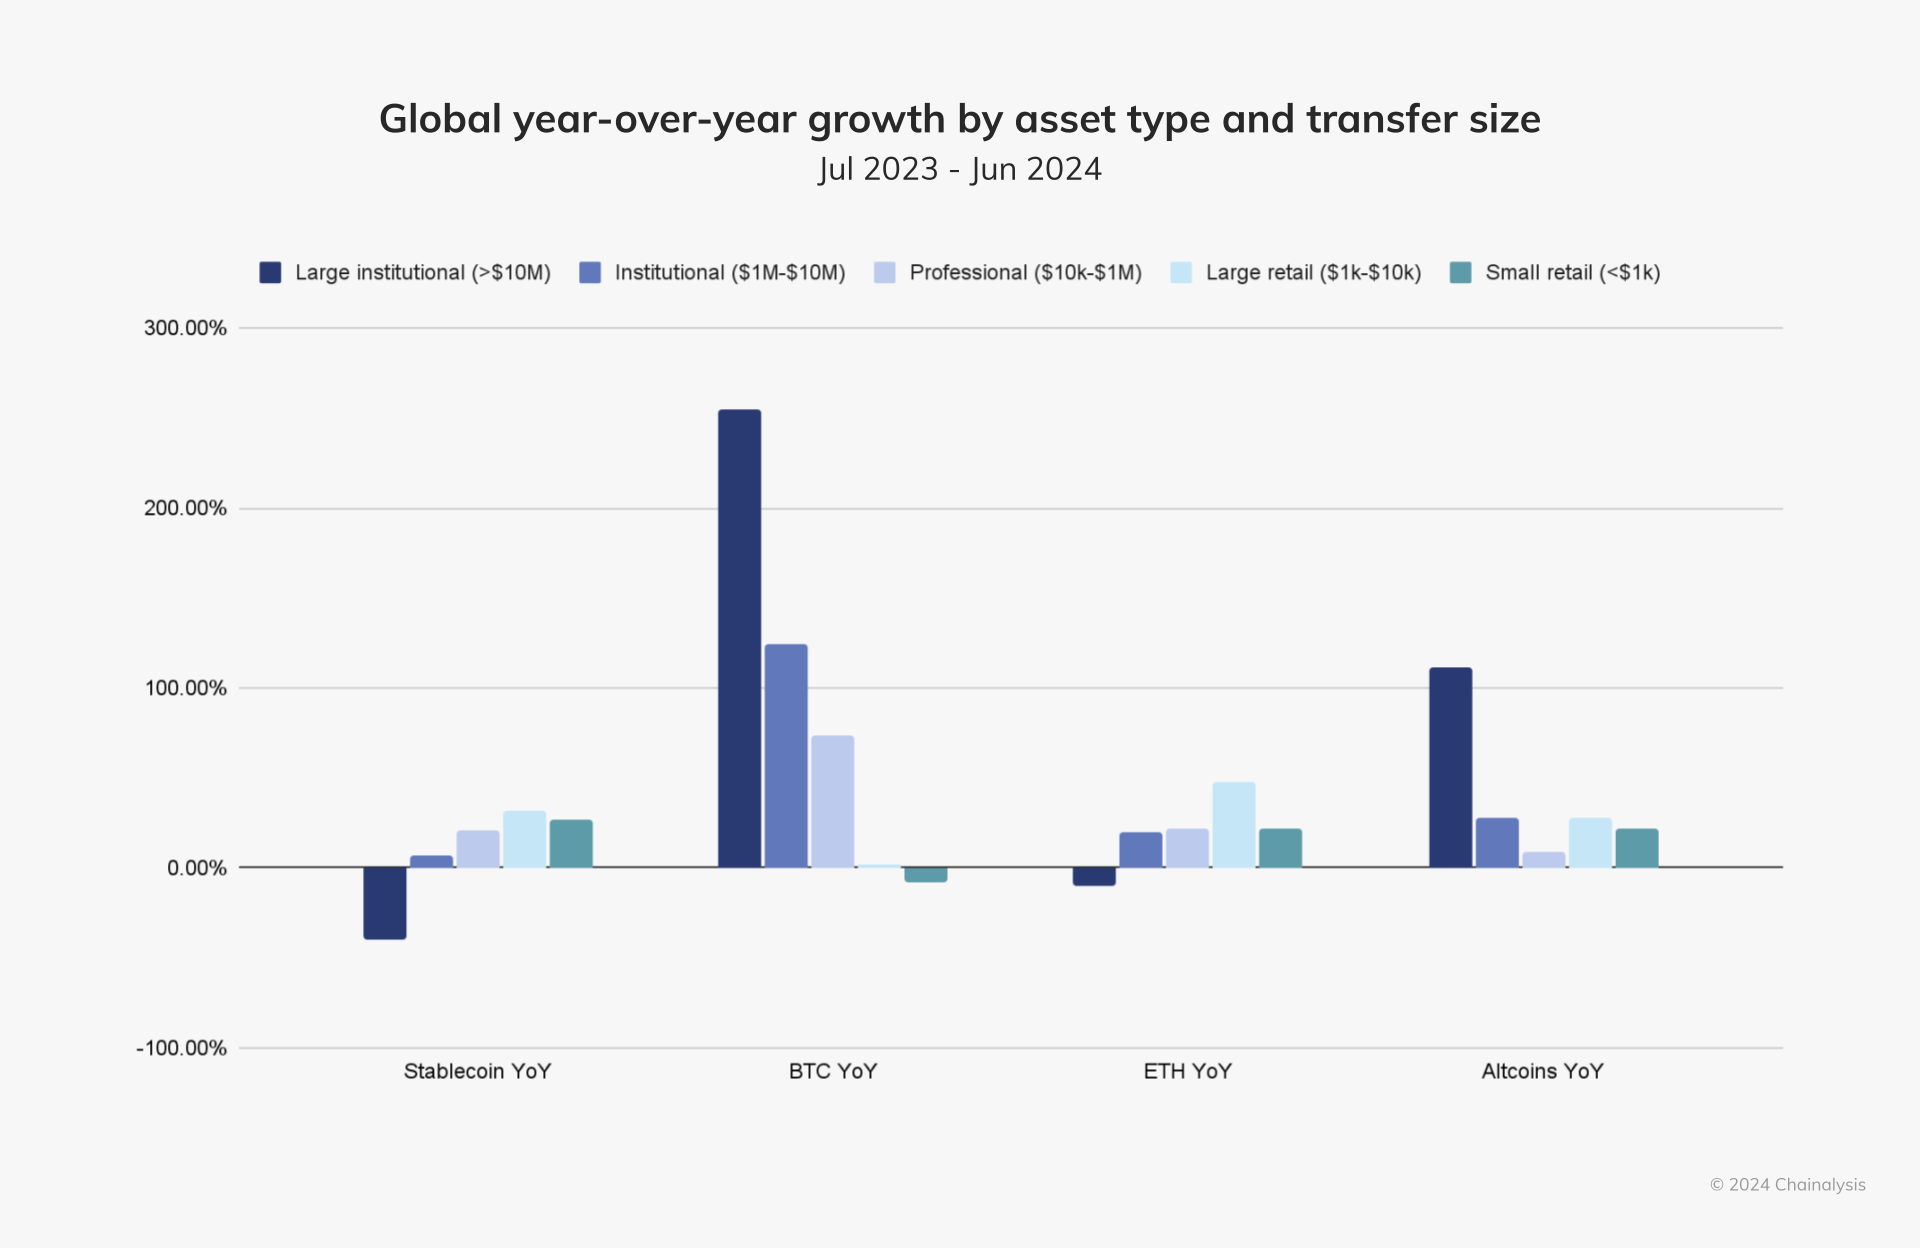
When observing the year-over-year growth in service types, we find a significant increase in decentralized finance (DeFi) activity in Sub-Saharan Africa, Latin America, and Eastern Europe. As shown in the chart above, this growth may have led to an increase in altcoin activity in these regions.
To learn more about these trends, recent regulatory developments, and how countries around the world are using cryptocurrencies, please read the full 2024 Geography of Cryptocurrency Report.
免责声明:本文章仅代表作者个人观点,不代表本平台的立场和观点。本文章仅供信息分享,不构成对任何人的任何投资建议。用户与作者之间的任何争议,与本平台无关。如网页中刊载的文章或图片涉及侵权,请提供相关的权利证明和身份证明发送邮件到support@aicoin.com,本平台相关工作人员将会进行核查。


