Daily Sharing
The rebound of BTC on the 4-hour chart has broken through 63,000. The short-term trend indicates a high probability of further upward movement, with the rebound running on the daily chart. It may not be suitable for shorting in the short term, as the upward momentum has appeared, and it is advisable to focus on long positions during the pullback.
Currently, it may still need to wait for a pullback on the 1-hour chart, and it should be able to move higher. The target on the upside is around 64,500, and there should be a subsequent rebound in the form of a "three buys".
BTC
Due to the rapid changes in the market, this article can only make predictions based on the market changes at the time of publication. Short-term players should pay attention to the latest market changes and use this information as a reference only.
1H:
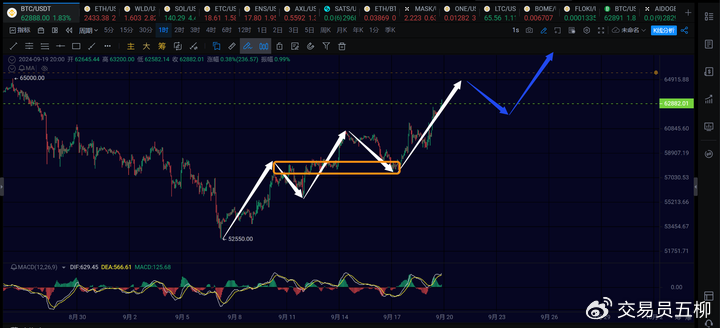
On the 1-hour chart, BTC has broken through 63,000, and the current 1-hour rebound is not showing any signs of divergence, indicating that the overall 4-hour rebound has not ended. The 1-hour rebound is also expected to continue, possibly reaching around 64,000 to 65,000, followed by a 1-hour pullback. As shown by the blue arrows in the image, as long as the pullback does not fall below 58,000, there will still be a subsequent "three buys" rebound.
The next 1-hour pullback is expected to be above 60,500, followed by a continued upward movement.
With the overall 4-hour rebound of BTC breaking through 63,000, it is highly likely that the subsequent 4-hour rebound will continue to extend to above 66,500. In the short term, it may be more favorable to focus on long positions during the pullback.
15M:
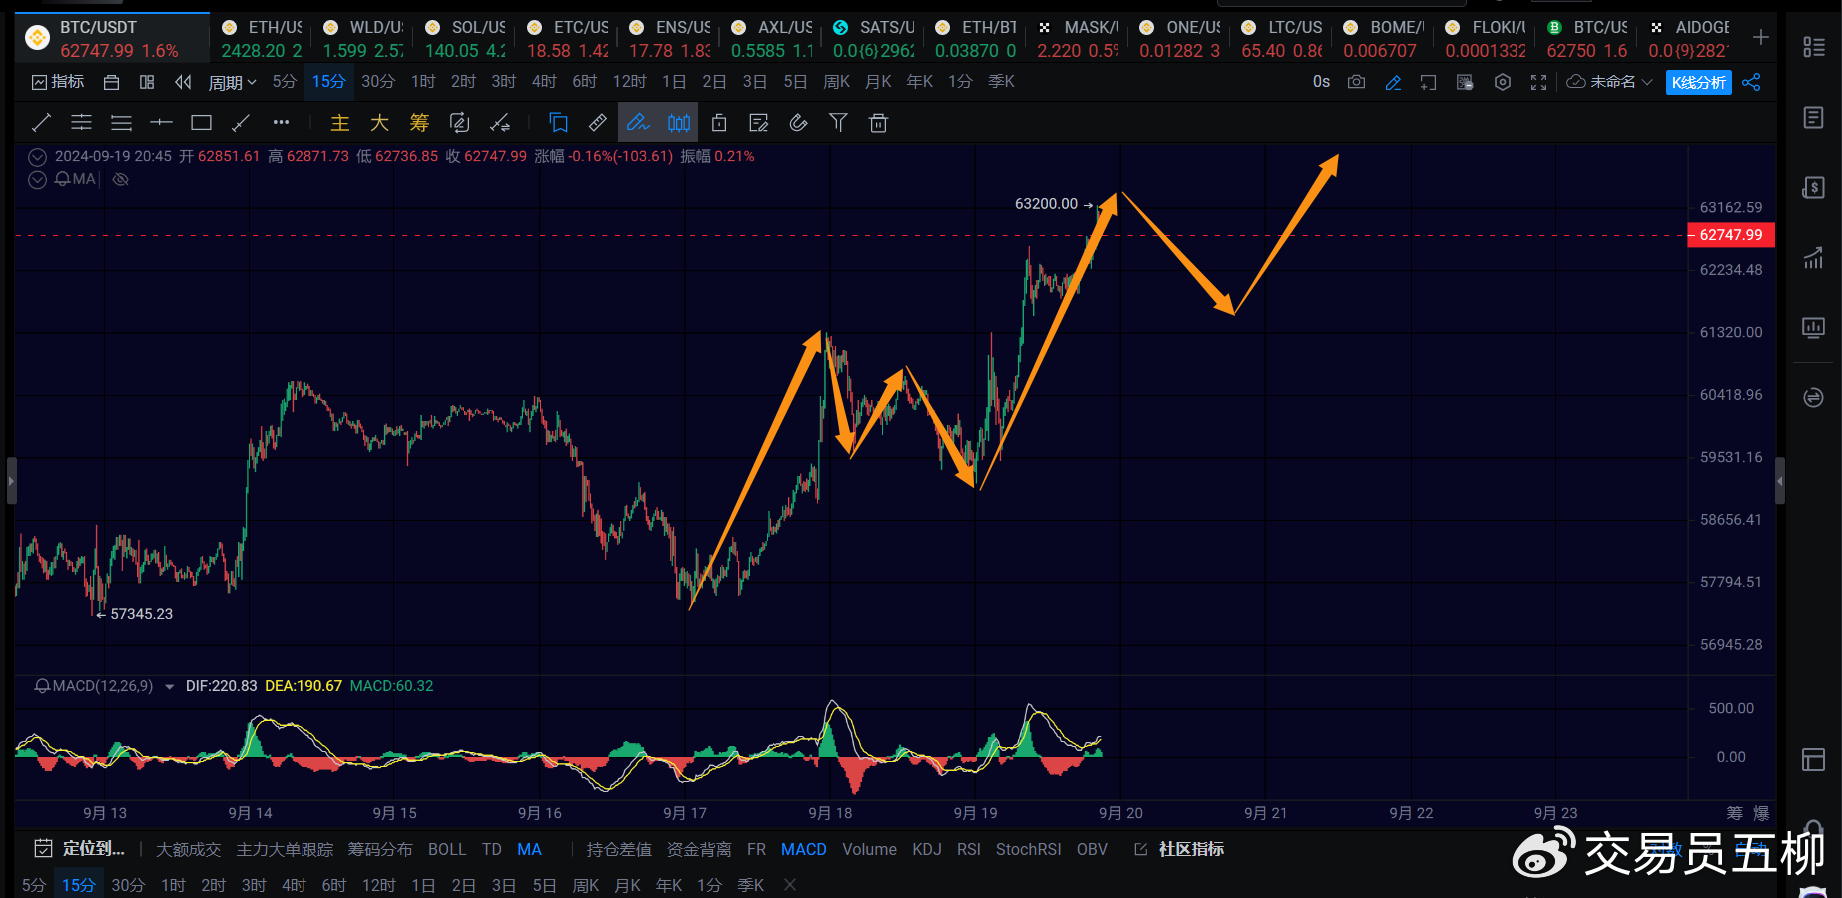
On the 15-minute chart, the upward movement of the 15-minute rebound is no longer showing any signs of divergence, indicating that a 15-minute pullback is likely in the short term. Pay attention to the area around 61,500 for the pullback, followed by a 15-minute rebound to potentially accelerate towards 64,000.
ETH
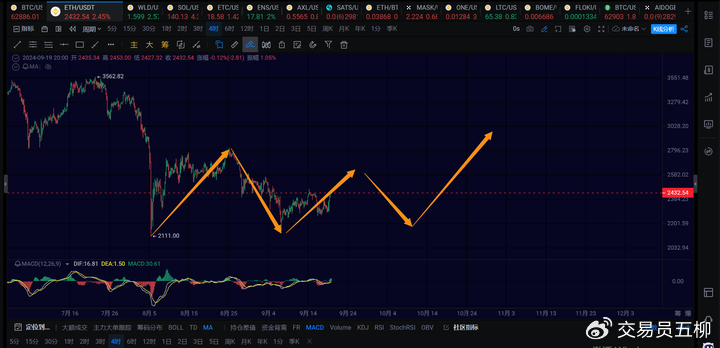
For ETH, the 4-hour rebound may reach a higher level. If it fails to break through 2,800, ETH is likely to oscillate at a lower level and eventually make another upward push. The daily structure of ETH will be discussed tomorrow, and the daily structure of ETH still indicates a bearish trend. Therefore, it may still be too early for the altcoin season to appear, but there should be a demand for a rebound in altcoins in the near future.
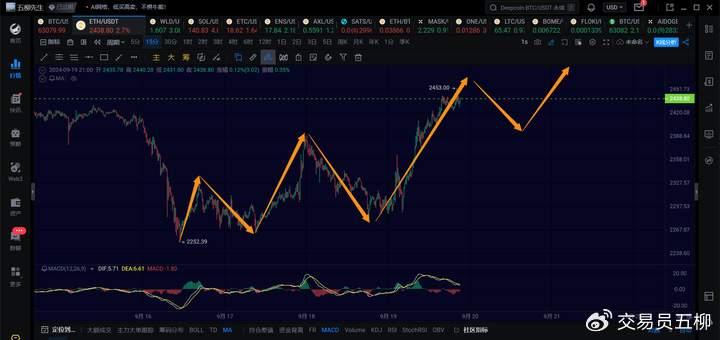
On the 15-minute chart, ETH may see a 15-minute pullback in the early morning. Since the 15-minute rebound is no longer showing any signs of divergence, there will likely be a 15-minute rebound after the 15-minute pullback to end the 1-hour rebound. The target for this 1-hour rebound is around 2,480 to 2,500.
Trend Direction
Weekly Chart: Downward direction, the extension of the weekly downtrend, theoretically around 49,000, with a limit of 45,000 to 48,000. Whether it has ended needs further observation.
Daily Chart: Upward direction, in the short term, the range to watch is 67,000 to 70,000.
4-hour Chart: Upward direction, the 4-hour rebound has extended and broken through 63,000, and is expected to continue to extend to around 66,500 or higher.
1-hour Chart: Upward direction, a 1-hour pullback is expected tomorrow, but there may still be another upward movement.
15-minute Chart: Upward direction, a 15-minute rebound is expected after the 15-minute pullback.
Feel free to follow my public account for further discussion and exchange:

This article is time-sensitive, please be aware of the risks. The views expressed in this article are personal opinions and are for reference only.
免责声明:本文章仅代表作者个人观点,不代表本平台的立场和观点。本文章仅供信息分享,不构成对任何人的任何投资建议。用户与作者之间的任何争议,与本平台无关。如网页中刊载的文章或图片涉及侵权,请提供相关的权利证明和身份证明发送邮件到support@aicoin.com,本平台相关工作人员将会进行核查。


