Morning market trends may go how? Little A explains for you!
Welcome to ask Little A in the group chat for more analysis: jv.mp/JaQ0CE
BTC
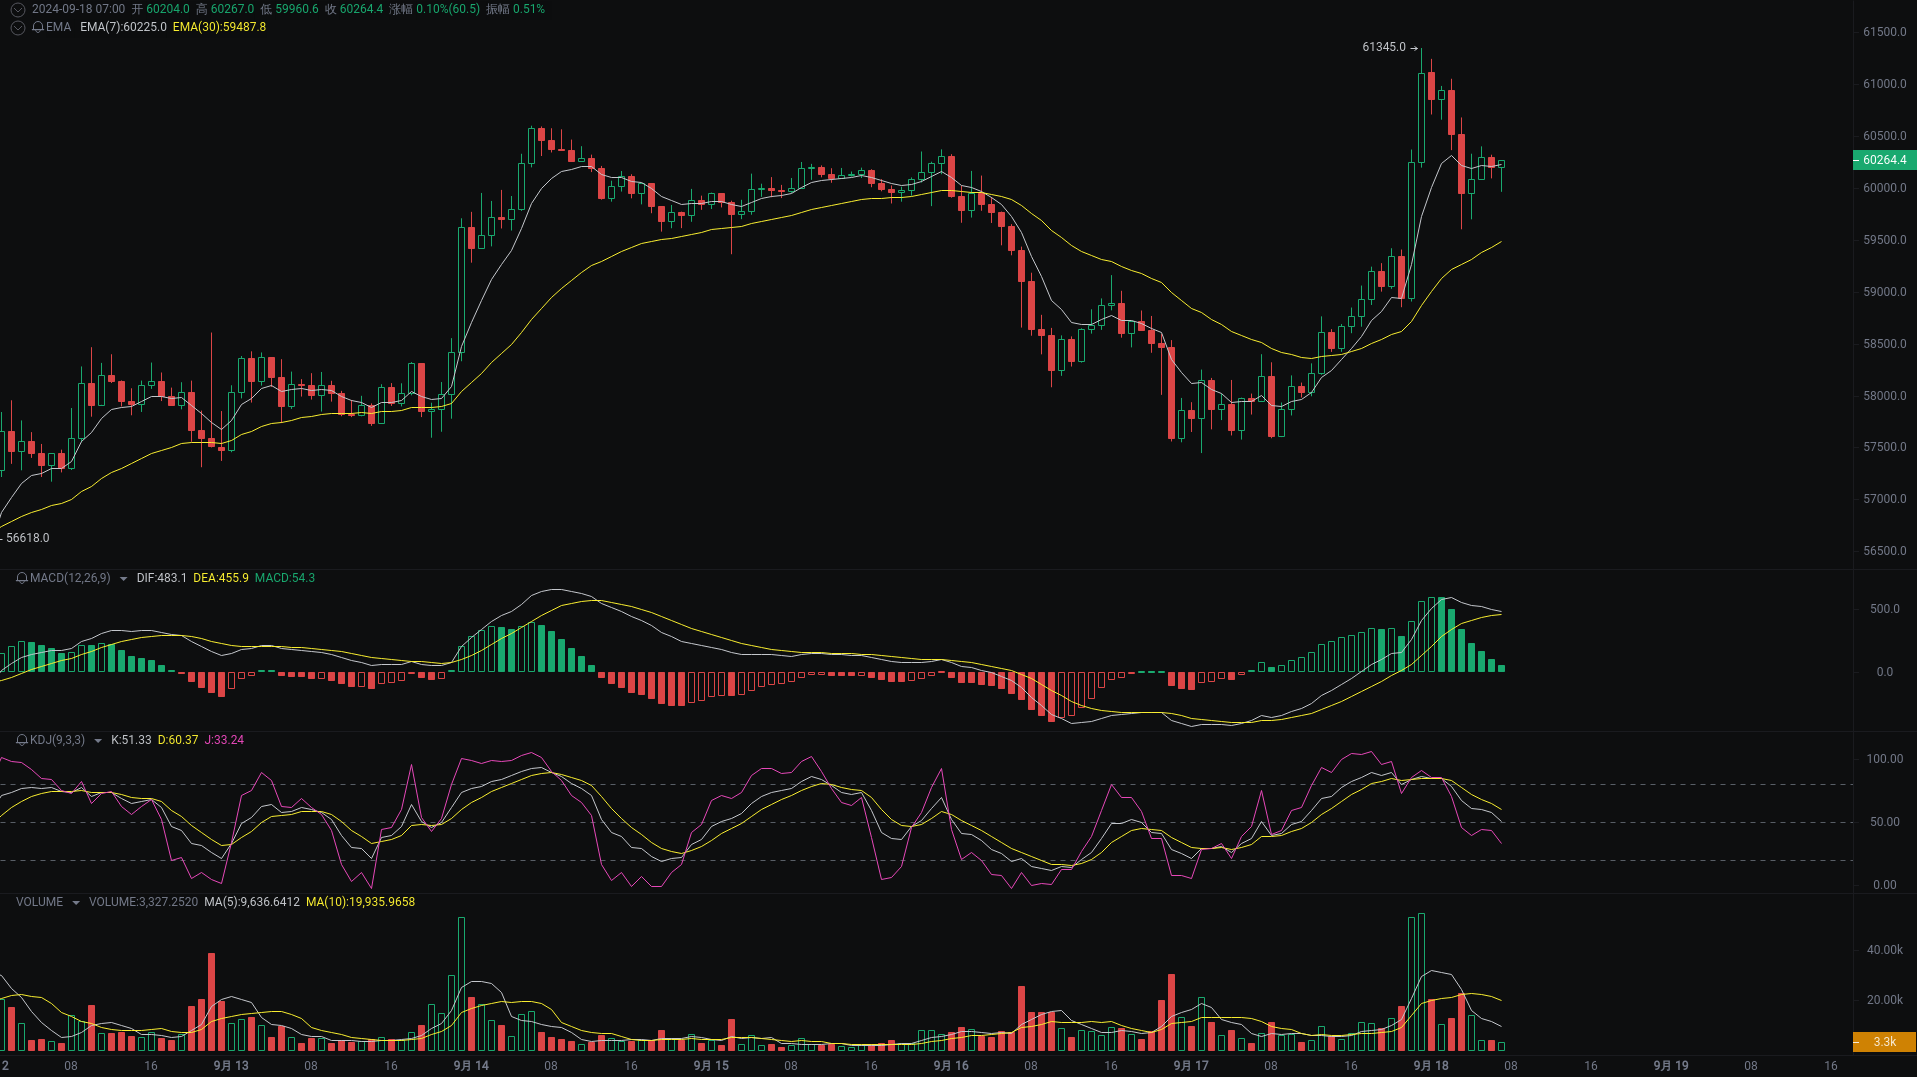
BTC's 1-hour price trend: Sideways.

This is a 1-hour Binance BTC/USDT K-line chart, with the latest price at: 60264.4 USDT, including EMA, MACD, KDJ, and volume indicators.
【Buy/Sell Points】
Buy point one: 59000 USDT (near EMA(30), as a support level, there is a possibility of rebound at this price)
Buy point two: 58000 USDT (recent low point area, if the price retraces to this level, it can be seen as a strong psychological and technical support level)
Long stop loss point: 57500 USDT (below buy point two and with enough space to avoid triggering stop loss due to small fluctuations)
Sell point one: 61000 USDT (near the high of 61345, facing resistance, suitable for short-term profit-taking)
Sell point two: 62000 USDT (potential resistance level after breaking the previous high, expected to encounter selling pressure)
Short stop loss point: 62500 USDT (above sell point two, giving the market enough room for volatility, reducing the risk of triggering stop loss due to minor fluctuations)
【Price Trend Analysis】
K-line pattern:
- Recent K-line shows significant price fluctuations, such as the long positive line at 23:00 on September 17 breaking through the 61000 mark and then falling back, with several attempts to rise in the following hours but unable to sustain.
- From 02:00 to 07:00 on September 18, the length of the K-line entity shortened, indicating market oscillation at high levels and the balance of buying and selling forces.
Technical indicators:
- MACD indicator: The latest MACD value is 54.3, with DIF staying above DEA and the gap between them not significant, indicating that the current upward momentum still exists but is slowing down.
- KDJ indicator: J value at 33.24 is lower than K value at 51.33 and D value at 60.37, possibly indicating potential downside risk in the short term.
- EMA indicator: EMA(7) is at 60225.0, slightly higher than EMA(30) at 59487.8, with the short-term moving average crossing above the long-term moving average, showing an upward trend.
Volume:
- Volume reached a peak of 54577.8860 at 23:00 on September 17 and gradually decreased, reflecting a waning buying interest at high levels.
- The volume has been relatively stable in the past few hours, with no significant increase or decrease, maintaining a certain level of market participation.
ETH
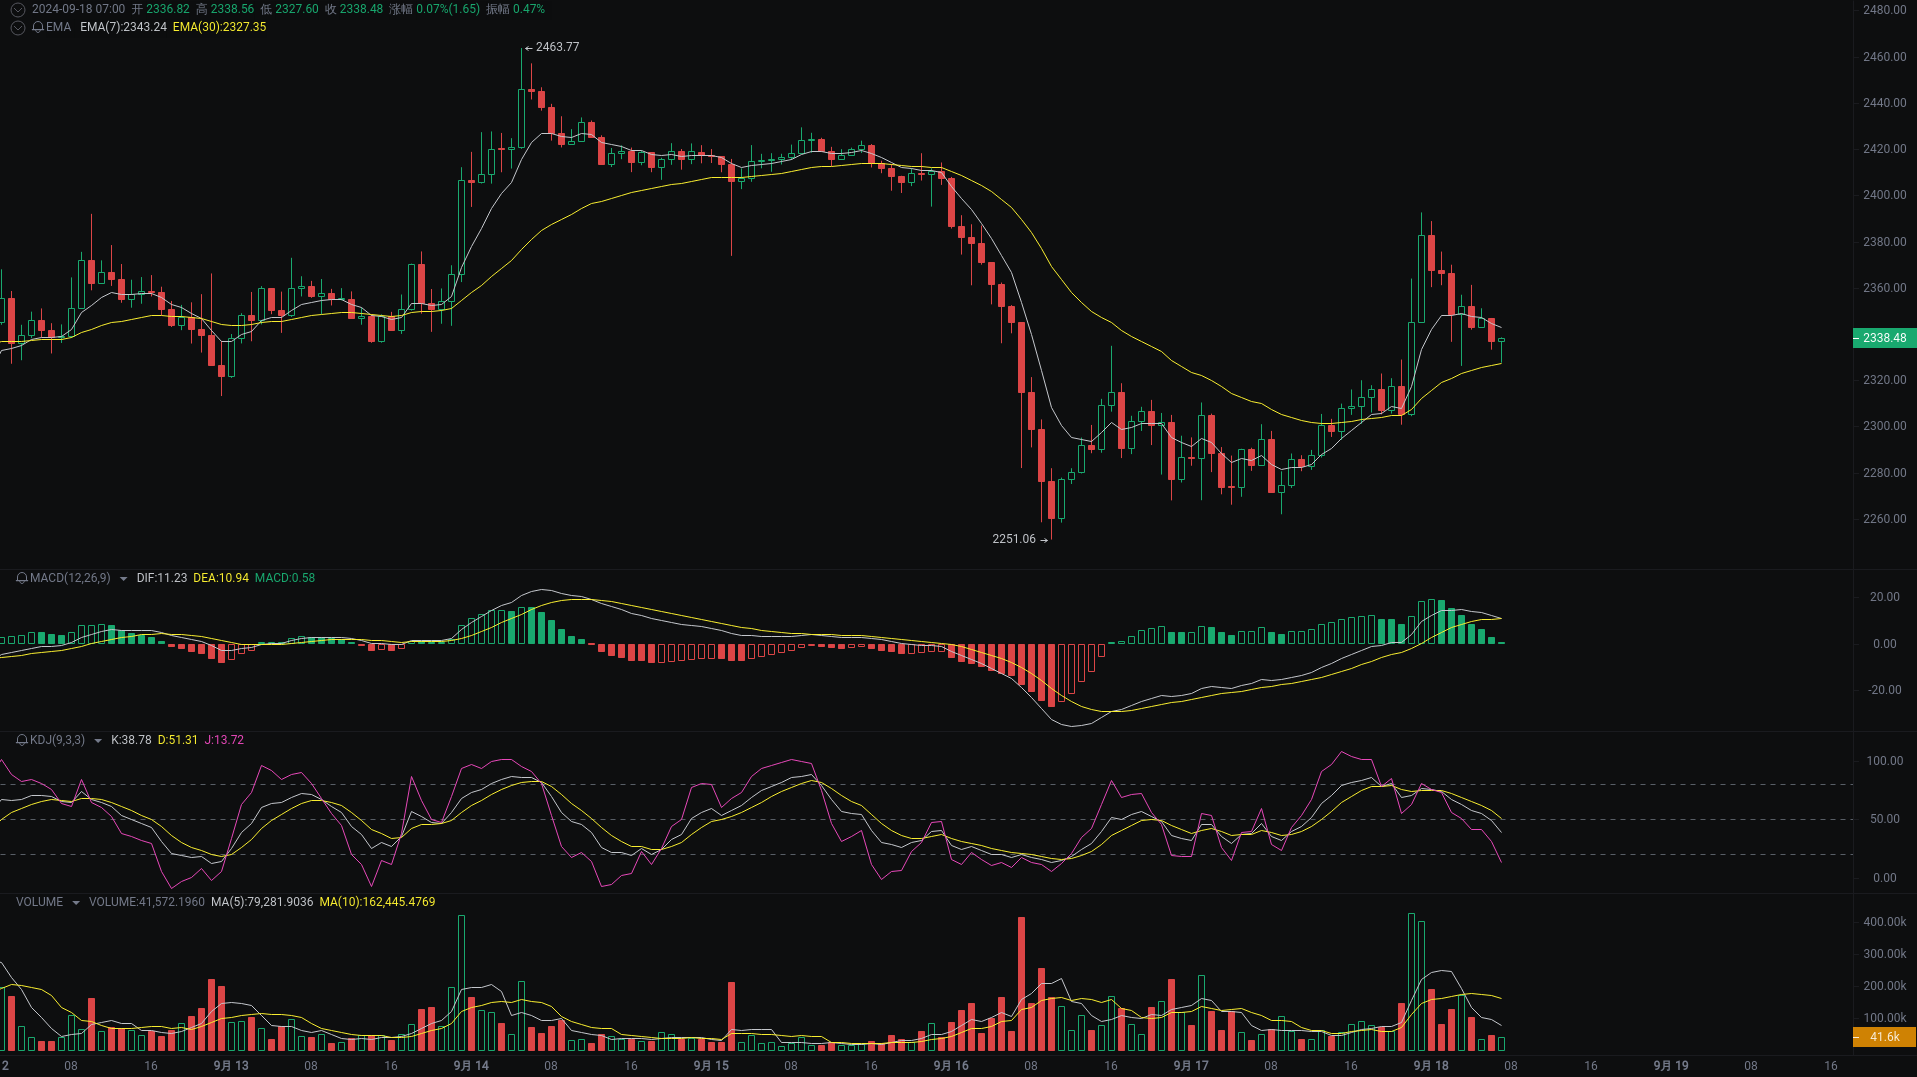
ETH's 1-hour price trend: Sideways.

This is a 1-hour Binance ETH/USDT K-line chart, with the latest price at: 2338.48 USDT, including EMA, MACD, KDJ, and volume indicators.
【Buy/Sell Points】
Buy point one: 2305 USDT (near recent support level, near EMA(30), potential buying interest if the price retraces to this level)
Buy point two: 2270 USDT (low point of the 07:00 hour K-line on September 17, a strong psychological and technical support level)
Long stop loss point: 2250 USDT (below buy point two and with space to avoid triggering stop loss due to small fluctuations)
Sell point one: 2380 USDT (near the high of 2392.62, facing resistance from the previous high, considerable profit)
Sell point two: 2400 USDT (psychological level after breaking the previous high, if there is enough momentum to break through, can expect a larger increase)
Short stop loss point: 2420 USDT (above sell point two, setting stop loss conservatively to prevent further upward movement)
【Price Trend Analysis】
K-line pattern:
- Recent K-line shows significant price fluctuations, such as the long positive line at 23:00 on September 17 breaking through the previous high of 2392.62 and then retracing. The latest one-hour K-line is a small negative line, indicating relatively balanced buying and selling forces.
- From the overall trend, there are multiple rapid rises followed by retracements, suggesting the existence of selling pressure.
Technical indicators:
- In the MACD indicator, both DIF and DEA are above the 0 axis, but the MACD histogram value has decreased to 0.58, indicating a weakening bullish momentum and the need to be cautious about potential turning risks in the short term.
- The KDJ indicator shows a J value of 13.72 far lower than the K value of 38.78 and D value of 51.31, indicating potential oversold conditions in the near term and the possibility of a rebound.
- The 7-period EMA (2343.24) is above the 30-period EMA (2327.35), with the short-term moving average still in an upward state, but the gap is narrowing, so attention should be paid to whether a crossover will occur.
Volume:
- Volume fluctuated significantly at different time periods, such as reaching a peak of 402464.6190 at 23:00 on September 17, accompanied by a significant price increase, showing active buying interest.
- The volume has gradually decreased in the past few hours, consistent with stable or slight price declines, indicating a decrease in market activity.
BNB
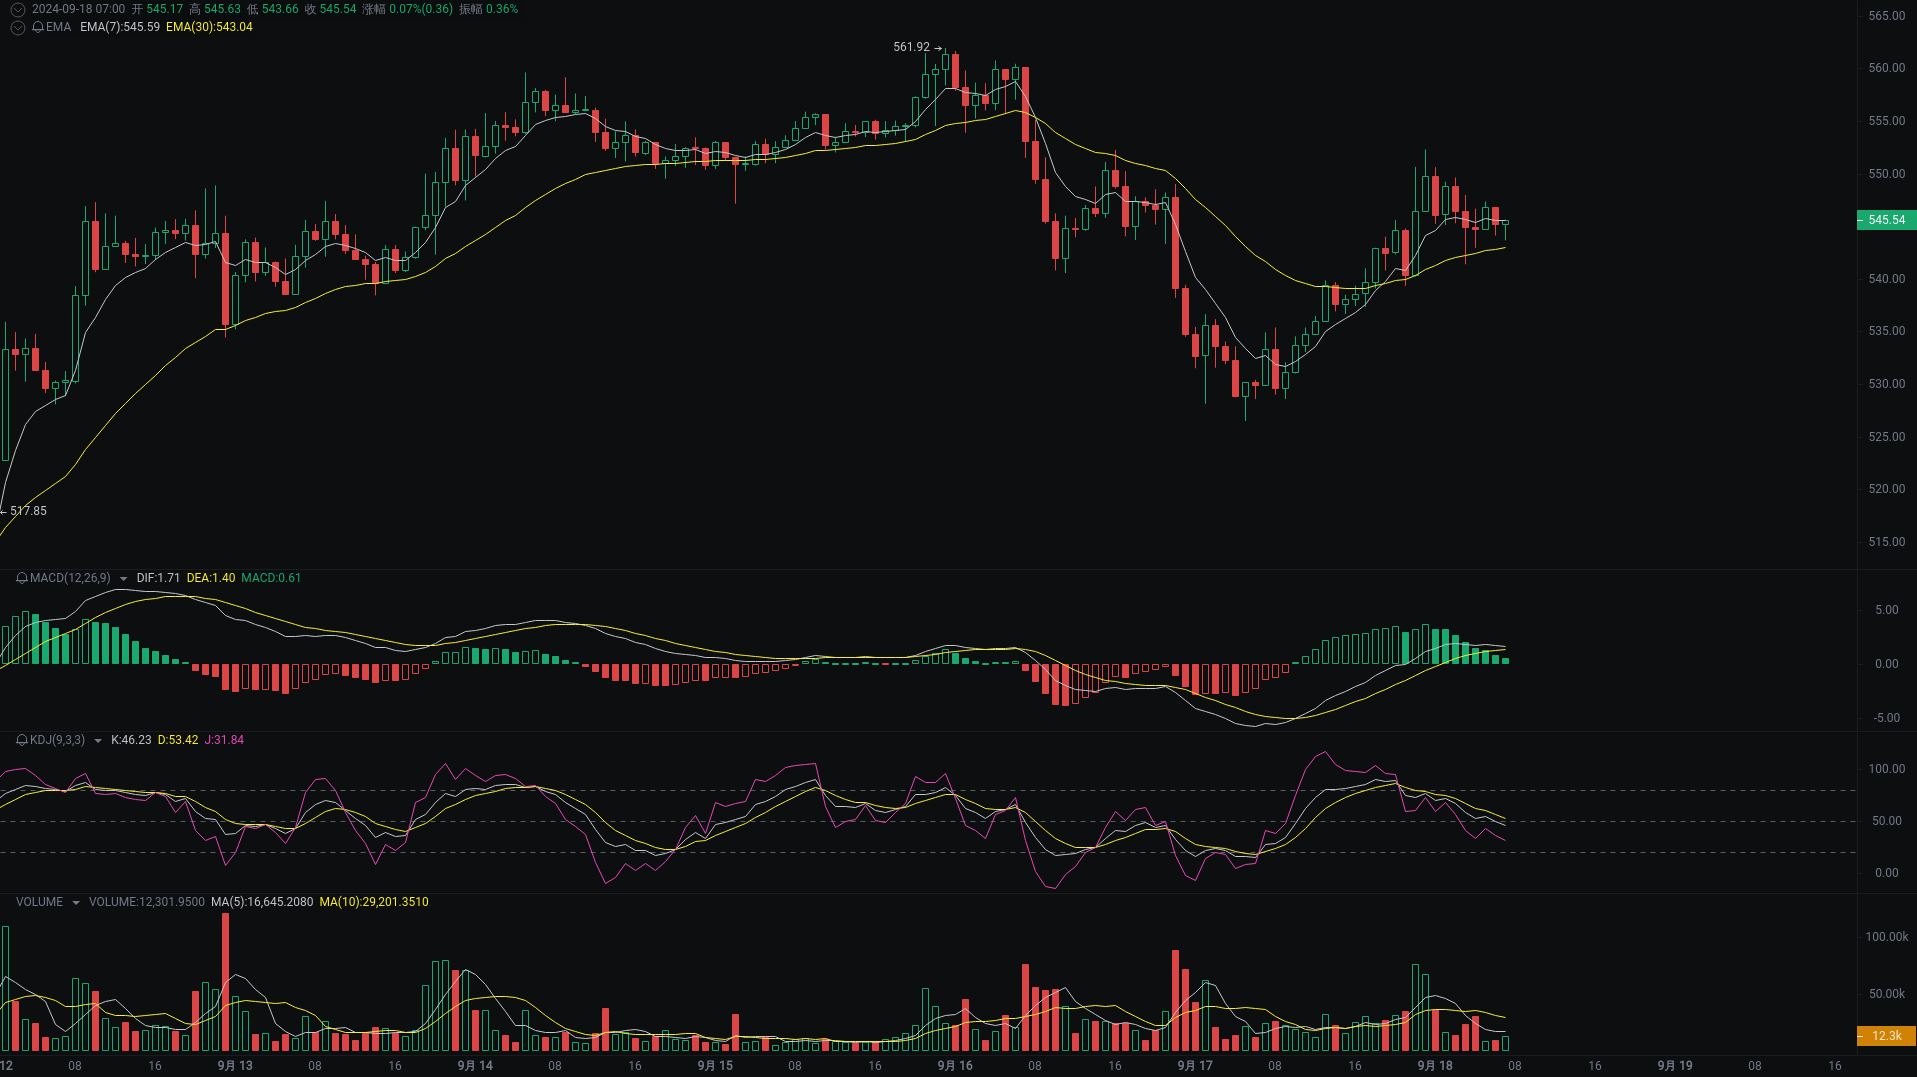
BNB's 1-hour price trend: Up.

This is a 1-hour Binance BNB/USDT K-line chart, with the latest price at: 545.54 USDT, including EMA, MACD, KDJ, and volume indicators.
【Buy/Sell Points】
Buy point one: 540 USDT (near the recent support level, potential buying interest if the price retraces to this level)
Buy point two: 530 USDT (stronger psychological and technical support level, if the 540 USDT support is broken, the next major support is here)
Long stop loss point: 525 USDT (below buy point two and with enough space to avoid triggering stop loss due to small fluctuations)
Sell point one: 555 USDT (resistance level that has been repeatedly tested but failed to break through, suitable as an initial profit-taking point)
Sell point two: 565 USDT (above the previous high of 560.42 USDT, considering the possibility of market overextension, setting a higher selling target)
Short stop loss point: 570 USDT (above sell point two, giving the market room for volatility, and also a psychological key level)
【Price Trend Analysis】
K-line pattern:
- Recent K-line shows significant price fluctuations, with multiple long upper and lower shadow lines, indicating intense competition between buyers and sellers at certain price levels. In particular, from 23:00 on September 16 to 07:00 on September 17, there were several K-lines with long upper shadow lines, suggesting significant selling pressure at high levels.
- Looking at the most recent hour, the closing price of the K-line is close to the opening price, reflected as a short-bodied K-line, which may indicate a wait-and-see attitude in the current market.
Technical indicators:
- In the MACD indicator, both DIF and DEA are trending upwards, and the MACD value has turned from negative to positive, indicating a possible strengthening of bullish sentiment in the short term.
- In the KDJ indicator, the J value has fallen from the overbought zone (>80) in the past few periods, and currently the K and D lines are relatively stable, but there is still a need to be cautious about possible overbought or oversold conditions.
- The EMA indicator shows the 7-period EMA (545.59) slightly above the 30-period EMA (543.04), with the short-term moving average crossing above the long-term moving average, which can be seen as a bullish signal.
Volume:
- Volume reached its peak at 22:00 on September 17 and gradually decreased, reflecting a decrease in market activity, possibly indicating that prices will enter a consolidation phase in the short term.
- The latest volume has decreased compared to the previous few hours, consistent with the current K-line pattern indicating a wait-and-see market.
※All content is provided by the intelligent analysis assistant Little A, and is for reference only, and does not constitute any investment advice!
Little A Intelligent Analysis is the industry's first intelligent analysis tool recommended by AICoin, which easily helps you interpret the trend of currencies, analyze indicator signals, and identify entry and exit points. You can experience it on the APP or PC.
PC & APP Download: https://www.aicoin.com/download
免责声明:本文章仅代表作者个人观点,不代表本平台的立场和观点。本文章仅供信息分享,不构成对任何人的任何投资建议。用户与作者之间的任何争议,与本平台无关。如网页中刊载的文章或图片涉及侵权,请提供相关的权利证明和身份证明发送邮件到support@aicoin.com,本平台相关工作人员将会进行核查。


