The U.S. Bureau of Labor Statistics released the latest data last night, showing that the year-on-year Producer Price Index (PPI) for August in the United States was 1.7%, lower than the market's expected 1.8%, hitting a new low since February this year. The previous value was also revised down from 2.2% to 2.1%. Following the CPI data, this further indicates a slowdown in inflation in the United States. Meanwhile, as of the week ending September 7th, the number of initial jobless claims in the United States reached 230,000, slightly higher than market expectations. The previous value was revised from 227,000 to 228,000, but the overall change was not significant.
The PPI once again provided a boost for the Federal Reserve to start cutting interest rates next week. Last month, the PPI increased by 0.2% month-on-month, while the growth rate for July was revised downward. Combined with last Wednesday's CPI data, the likelihood of a substantial interest rate cut by the Federal Reserve is not high. The probability of a 25 basis point rate cut has risen to 85%, reaching the highest level in nearly a month. The rebound of Bitcoin indicates that the market's bullish sentiment is relatively dominant, as evidenced by major players continuing to bet on bullish options for October and December.
However, apart from the impact of the expected interest rate cut by the Federal Reserve and the U.S. presidential election, there may not be fundamental factors affecting Bitcoin in the near future. Therefore, before the dust settles, the volatility of Bitcoin will decrease. Influenced by the CPI data and the presidential debate, Bitcoin's volatility decreased by 12% this week. With no major overall economic events expected in the short term, the volatility is expected to decrease before the FOMC meeting next week.
In the cryptocurrency market, after the release of the PPI data and initial jobless claims last night, Bitcoin's volatility increased for a period of time, fluctuating between 58,600 and 57,400. The short position near 58,600 mentioned by Dashen in yesterday's article also successfully gained a profit of over 1,200 points. At the time of writing, the Bitcoin price was $58,150, with a 24-hour increase of 0.58%. Whether it can stabilize at $58,000 and continue to rise has become a short-term focus.
Bitcoin 4-hour chart
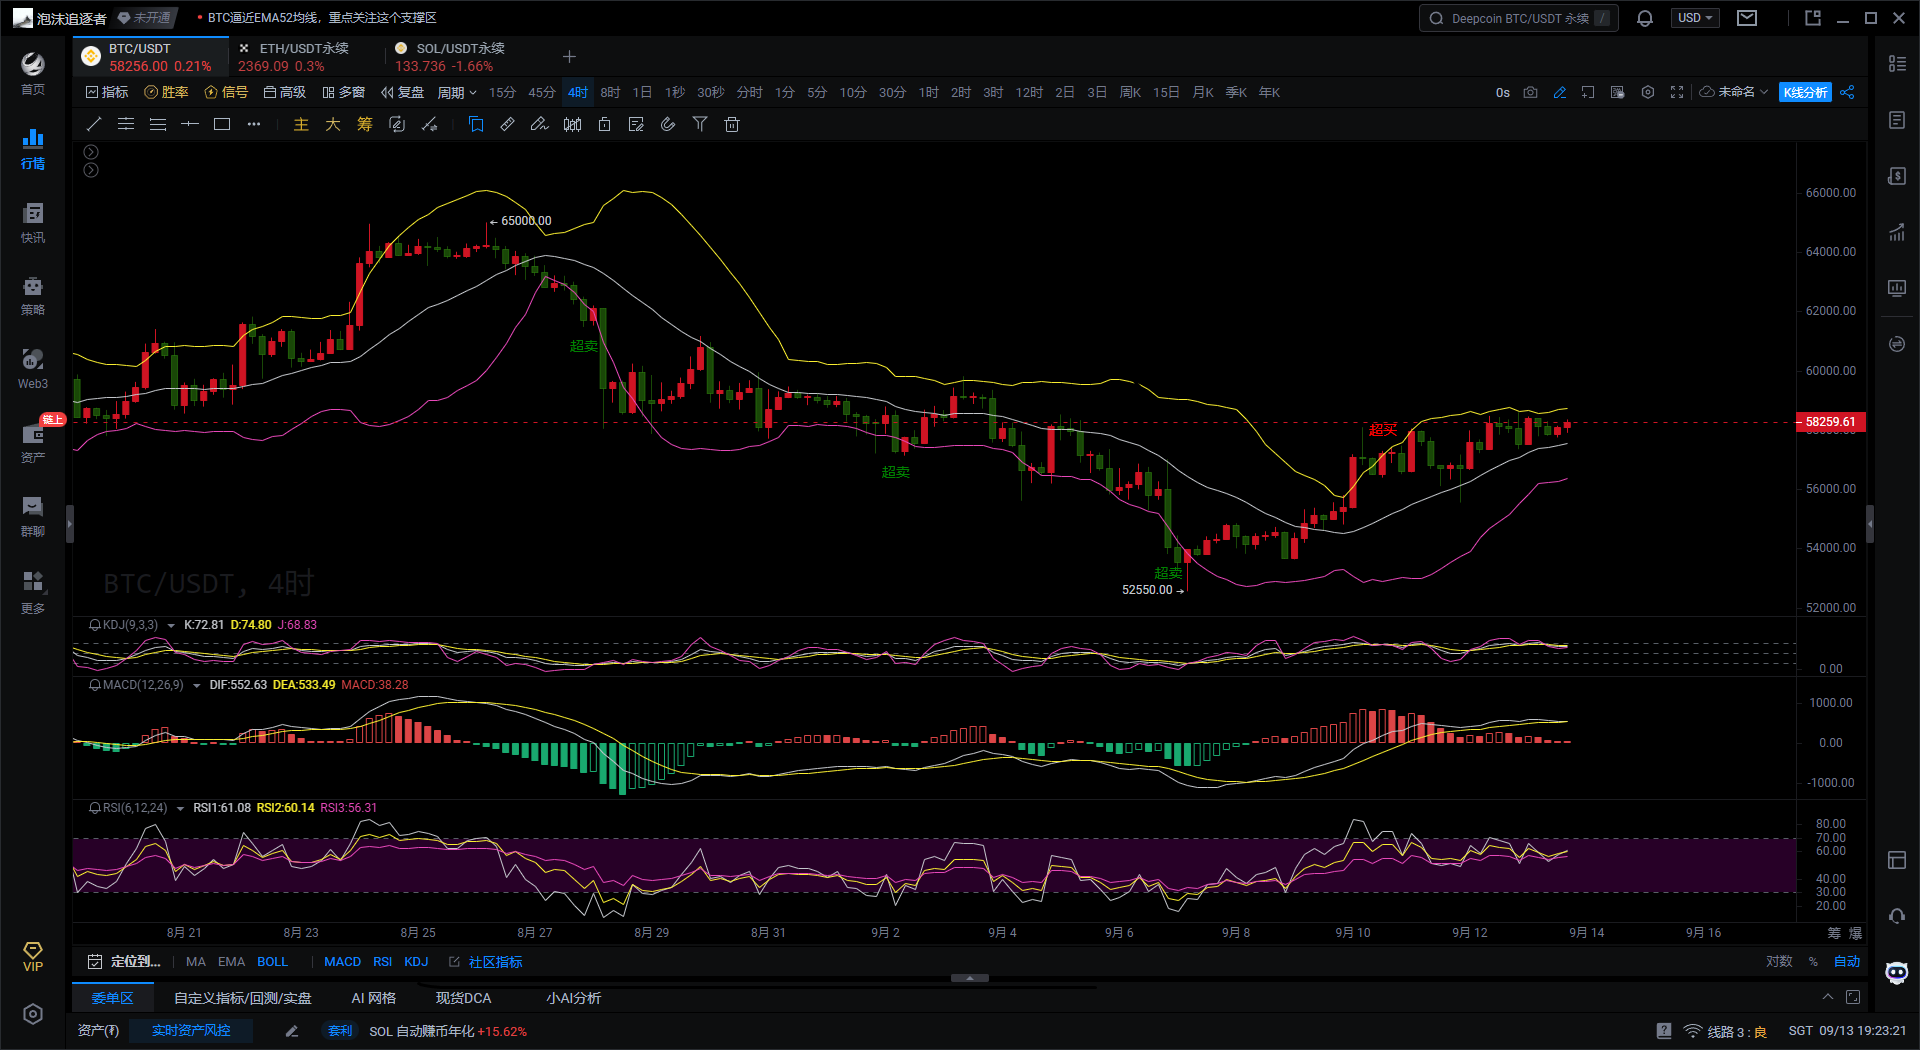
Looking at the MACD indicator in the 4-hour chart of Bitcoin, the DIF line and the DEA line form a golden cross near the 0 axis, but they have not been able to effectively widen the gap, indicating that it is currently in a oscillating state. A short-term pullback is not ruled out. The red histogram of the MACD is gradually shrinking, showing a weakening bullish momentum. All three lines of the KDJ indicator are running above 50, with the J line slightly turning downwards, indicating a possibility of a short-term pullback. If the J line further turns downwards, it may lead to a downward movement of the K line and the D line, increasing the possibility of a short-term pullback. The price is close to the upper Bollinger Band, indicating that the recent Bitcoin price has risen to a relatively high point, but the price has not been able to effectively break through the upper band, indicating strong resistance at the upper band, along with the risk of a pullback. The RSI value of 60.14 is near the overbought zone, but has not entered a seriously overbought zone. The RSI is slightly flat, showing that the buying pressure is starting to weaken, and the market may enter a consolidation phase.
Bitcoin 1-hour chart
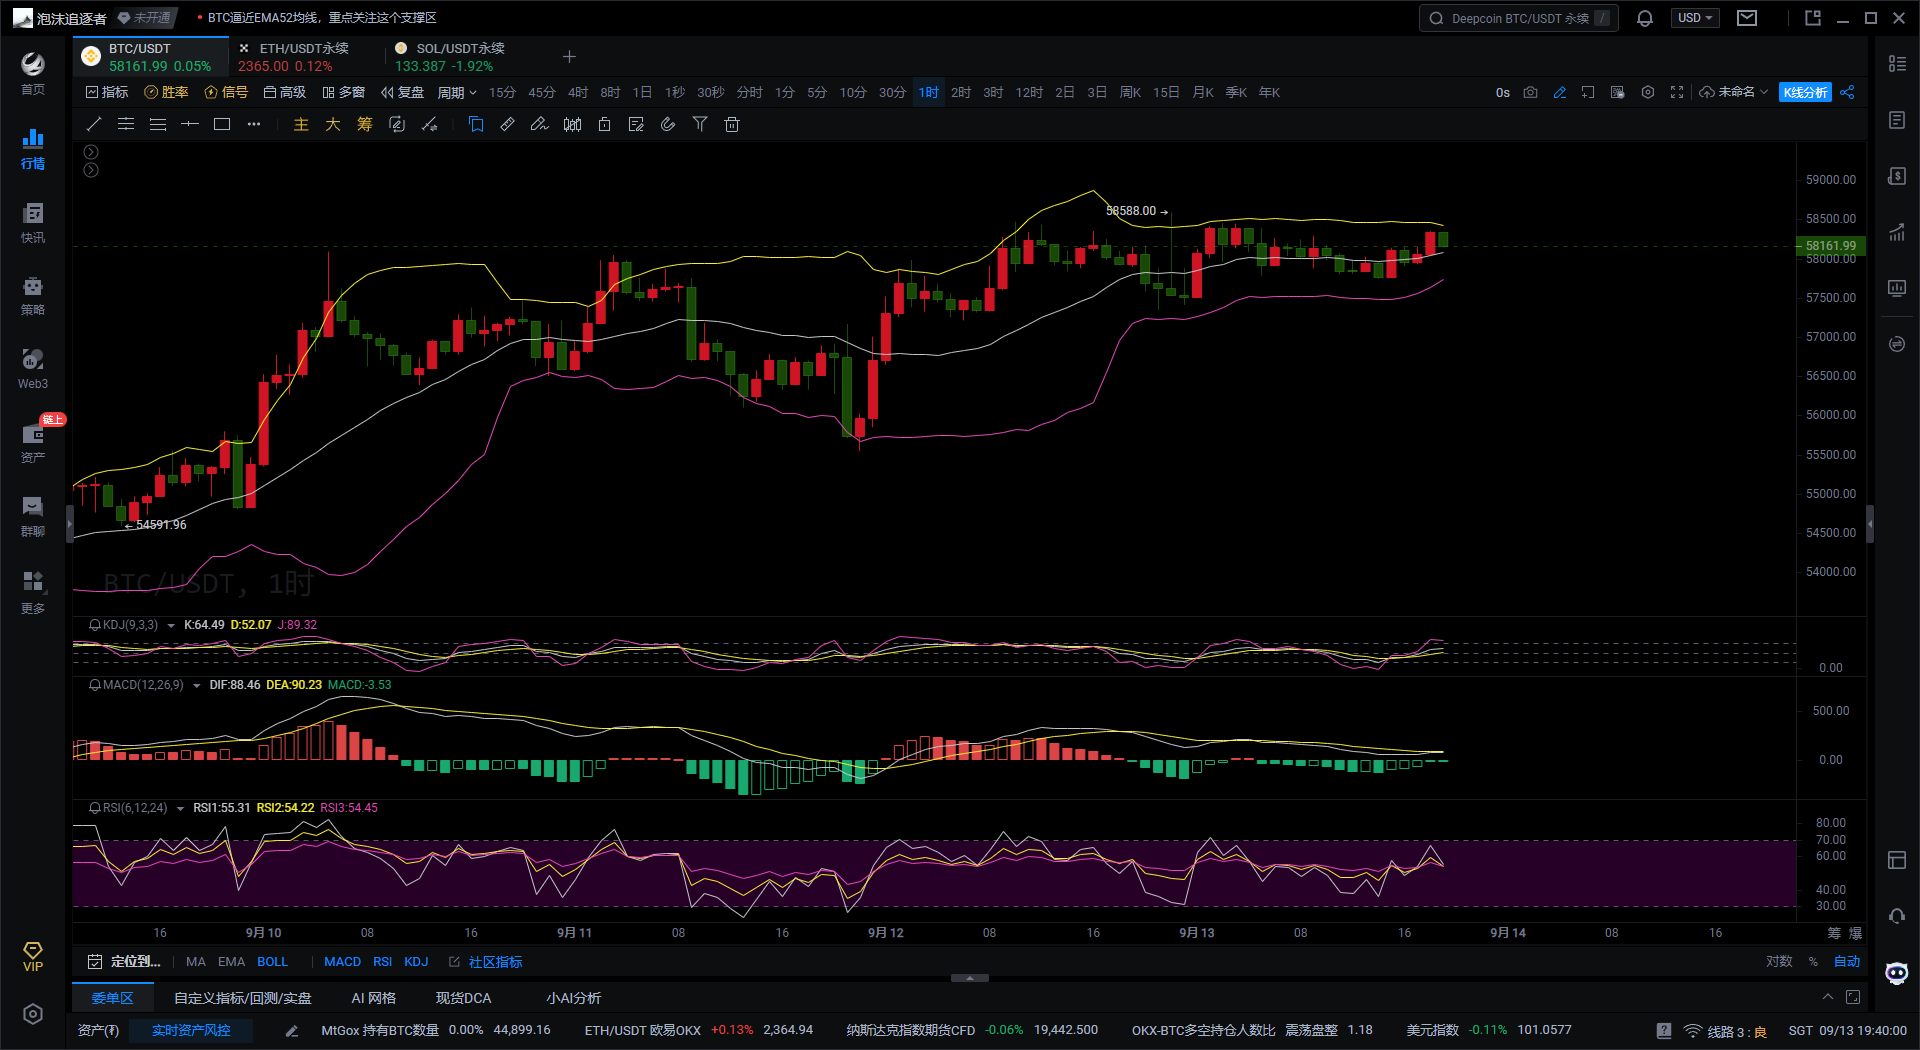
Looking at the MACD indicator in the 1-hour chart of Bitcoin, the DIF line is higher than the DEA line and running above the 0 axis, indicating that the current market is in a bullish state, with the possibility of further upward momentum in the short term. However, the red histogram of the MACD is gradually shrinking, showing a weakening bullish momentum. The recent few histograms are shorter than the previous ones, indicating that the upward momentum is gradually diminishing. All three lines of the KDJ indicator are at high levels, in the overbought zone, with the J line higher, indicating the risk of a potential pullback at any time. If the J line continues to turn downwards, the K line and the D line may also follow suit. When the price approaches the upper band, it encounters resistance formed by the upper band. If it cannot effectively break through the upper band in the short term, the price may potentially pull back to near the middle band. The widening of the Bollinger Bands indicates a significant expansion, suggesting relatively low market volatility, and a possible continuation of range-bound volatility in the future. The RSI value of 55.31 is in the neutral to strong zone, indicating that the buying pressure still holds an advantage, but has not entered the overbought zone, suggesting that there is still room for further upward movement. However, a consolidation trend may be maintained in the short term.
In summary, Bitcoin is currently at a relatively high level, and multiple indicators show that the short-term upward momentum is weakening, with the risk of consolidation or a slight pullback. (Due to Aicoin's slow article review in the past few days, you can go to the following official account for the latest information as soon as possible)
Based on the above analysis, Dashen provides the following suggestions for reference:
Short Bitcoin rebound to around 58,300, target 56,500, defend 58,700
Instead of giving you a 100% accurate suggestion, it's better to give you the correct mindset and trend, after all, teaching someone to fish is better than giving them a fish. The suggestion is to earn for a lifetime by learning the mindset, grasping the trend, and planning the layout and position of the market. What I can do is to provide help based on my practical experience, guiding your investment decisions and management in the right direction.
Time of writing: (2024-09-13, 19:25)

By Dashen (The Coin Master) Disclaimer: The publication on the internet has a delay, and the above suggestions are for reference only. The author is dedicated to research and analysis in the investment fields of Bitcoin, Ethereum, altcoins, foreign exchange, stocks, and has been involved in the financial market for many years, with rich experience in actual trading. Investment involves risks, so caution is advised when entering the market. For more real-time market analysis, please follow the official account of The Coin Master for discussion and exchange.
免责声明:本文章仅代表作者个人观点,不代表本平台的立场和观点。本文章仅供信息分享,不构成对任何人的任何投资建议。用户与作者之间的任何争议,与本平台无关。如网页中刊载的文章或图片涉及侵权,请提供相关的权利证明和身份证明发送邮件到support@aicoin.com,本平台相关工作人员将会进行核查。


