Spreading the Way of Trading, Enjoying a Wise Life
The price of Bitcoin showed a medium-long positive line yesterday, bringing a glimmer of hope to the previously unfriendly market. Is Bitcoin ready to break through at this position, or is it just a brief rebound? Let's analyze in detail.
First of all, there was a certain selling pressure above the medium-long positive line of Bitcoin yesterday, accompanied by upper shadow. At the same time, we can see that the volume at the bottom has increased, so the fluctuation of Bitcoin reached 6% yesterday, not without reason. So, is it possible for Bitcoin to continue its upward momentum after a slight pullback?
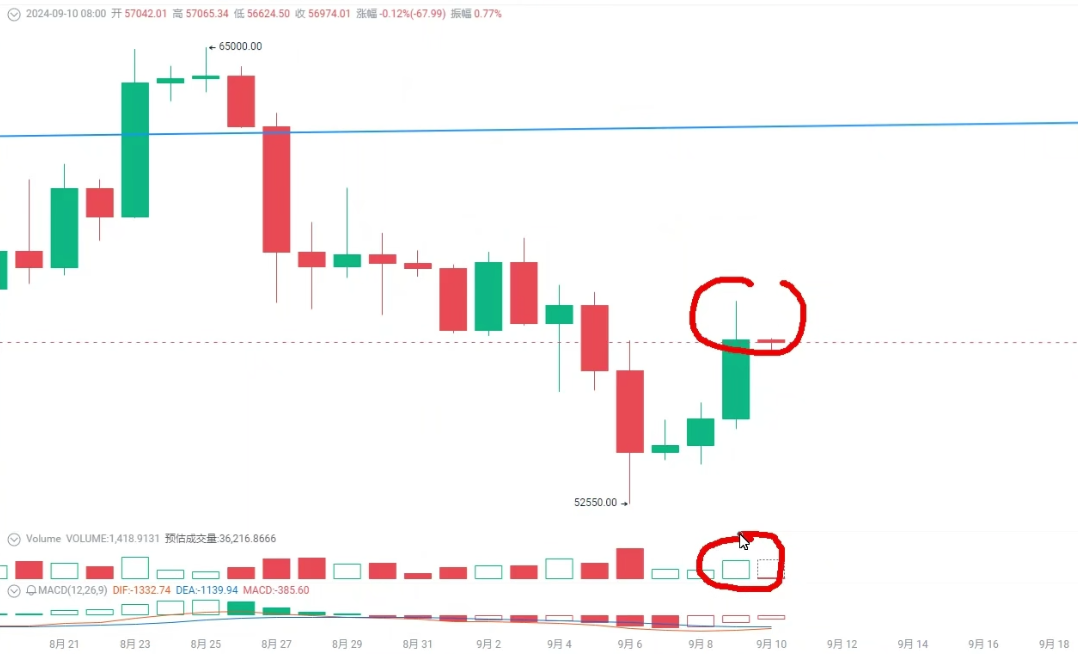
From the daily chart perspective, Bitcoin has reached the horizontal resistance level, which is approximately $57,300. This is an important support level on August 15th and September 2nd. If it can break through this level, Bitcoin is expected to reach a new short-term high again. However, this position also faces certain pressure. Therefore, we need to observe where Bitcoin may stop falling next.
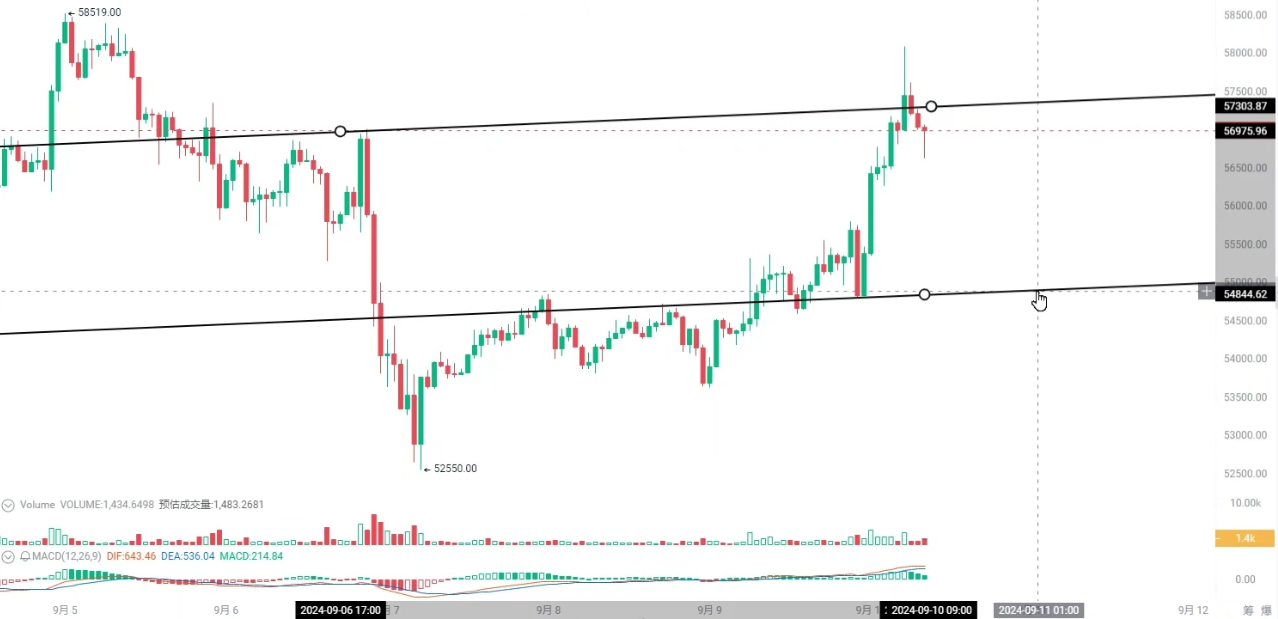
If we analyze the trend of Bitcoin through a smaller timeframe, we can draw a channel using the previous low and high points and press them on their solid parts. The Bitcoin price has just touched the upper rail of the expanded channel, at around $58,880. At this position, Bitcoin has shown a longer upward line, indicating significant pressure on the upper rail of this channel, thus starting to decline.
During the decline, the first support is approximately at $55,600, which is located below the channel. The second support is approximately at $54,800. Therefore, if Bitcoin can stop falling in the range of $54,800 to $55,600, then it may continue to challenge new highs, which may be above $59,000, close to $60,000. If Bitcoin can find support at this level and rise to $60,000, it may mean that the bearish trend of Bitcoin is about to end.
Let's take a look at the trend of Bitcoin from the weekly chart perspective. Currently, Bitcoin has fallen below the 30-week moving average and formed a candlestick with upper and lower shadows in the previous week. The 5-week moving average has also fallen below the 30-week moving average, forming a bearish signal. Currently, the price of the 30-week moving average is approximately $58,800. If Bitcoin can stop falling in the range of $54,800 to $55,600 and rise to $60,000, it will re-enter the 30-week moving average, and at this point, we need to adjust our viewpoint.
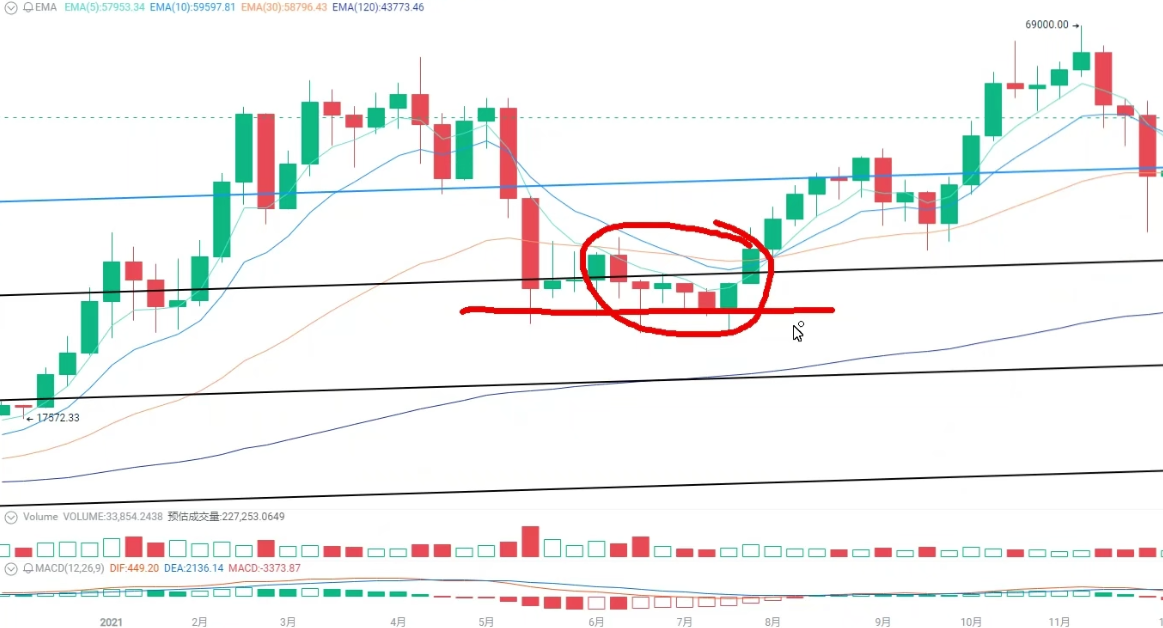
Looking back at history, the last time Bitcoin fell below the 30-week moving average was around $25,000. At that time, after falling below the 30-week moving average, Bitcoin consolidated for about 6 weeks, until the sixth week when a "bullish engulfing" candlestick pattern appeared, followed by a brief price pullback and oscillation, and finally a breakout in the fourth week. Therefore, if Bitcoin can form a similar candlestick combination at some point in the future, it means that the adjustment of Bitcoin is about to end.
However, we still need time to observe whether Bitcoin can form such a situation. The last time Bitcoin consolidated for 6 to 8 weeks, and now it is September, meaning that two months of consolidation means we have to wait until around November. Therefore, we should not expect too early, but verify our analysis and judgment through time.
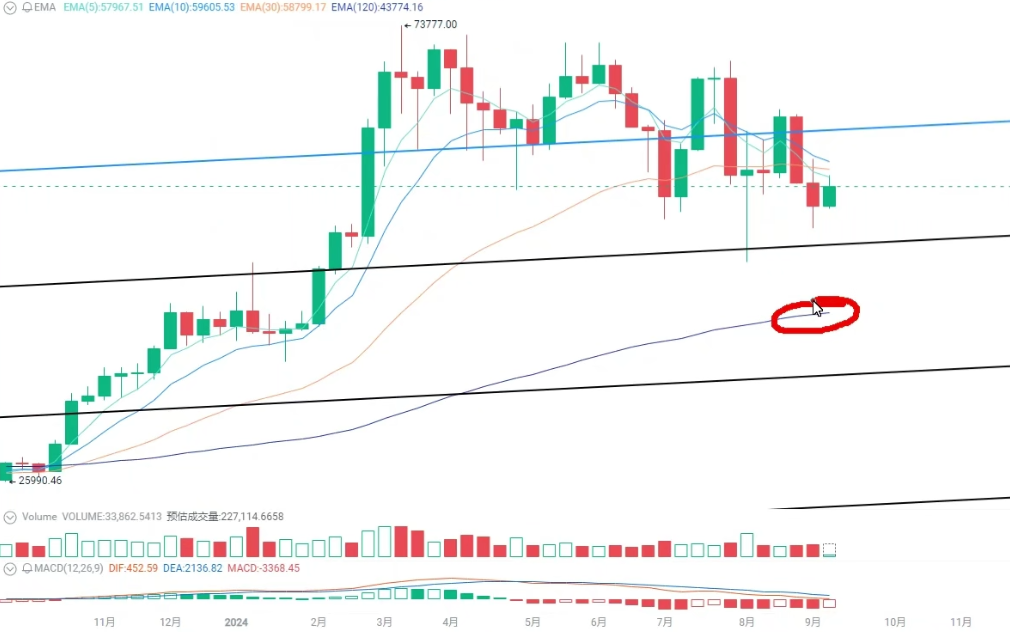
If Bitcoin fails to meet our expectations, there are other possible trends. Looking back at the bear market of Bitcoin in November 2021, it continued to fall below the 30-week moving average, and then continued to probe down to the 120-week moving average before finding support, and then consolidated above the 120-week moving average for about two months before rebounding. However, this rebound was only a second wave rebound and did not change the overall trend.
In addition to this exception, we can also refer to the trend in 2019. At that time, Bitcoin also fell below the 30-week moving average, and eventually formed a triple bottom near $28,000, with a consolidation period of two to three months. Therefore, we conclude that the adjustment period after Bitcoin falls below the 30-week moving average is relatively long.
In addition, for Bitcoin to achieve an upward breakthrough, it must be accompanied by the iconic "bullish engulfing" candlestick pattern. This was also reflected in the 519 event. Therefore, we need to pay attention to the trend of Bitcoin next.
According to Jiuge's analysis, Bitcoin may have three possible trends next:
Bitcoin may consolidate below the 30-week moving average for several weeks and then break through, possibly accompanied by a "bullish engulfing" candlestick pattern during the breakthrough process.
Bitcoin continues to probe down to near the 120-week moving average, forming support in the range of $44,000 to $45,000, and then chooses its direction after consolidating for several weeks.
- Bitcoin forms a multiple bottom near $50,000 and then rises.
Whichever trend occurs, we must remember one thing: for Bitcoin to break out of the slump, a "bullish engulfing" candlestick pattern must appear.
免责声明:本文章仅代表作者个人观点,不代表本平台的立场和观点。本文章仅供信息分享,不构成对任何人的任何投资建议。用户与作者之间的任何争议,与本平台无关。如网页中刊载的文章或图片涉及侵权,请提供相关的权利证明和身份证明发送邮件到support@aicoin.com,本平台相关工作人员将会进行核查。


