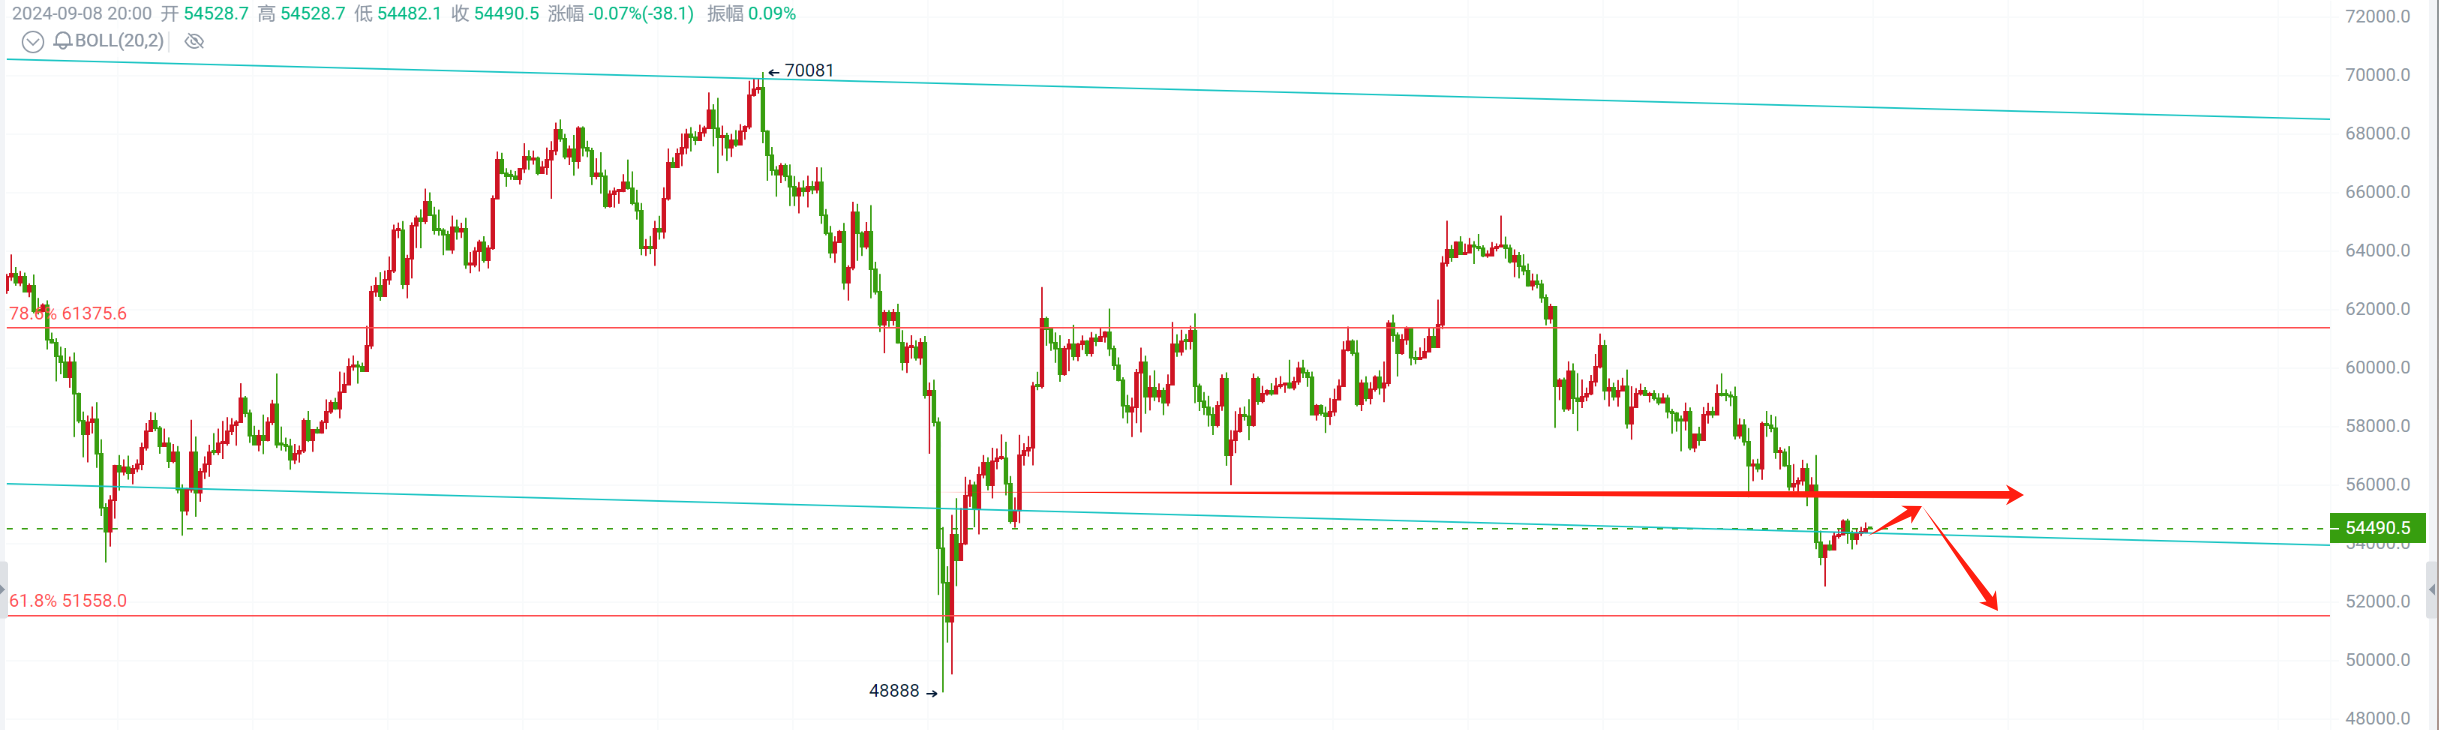
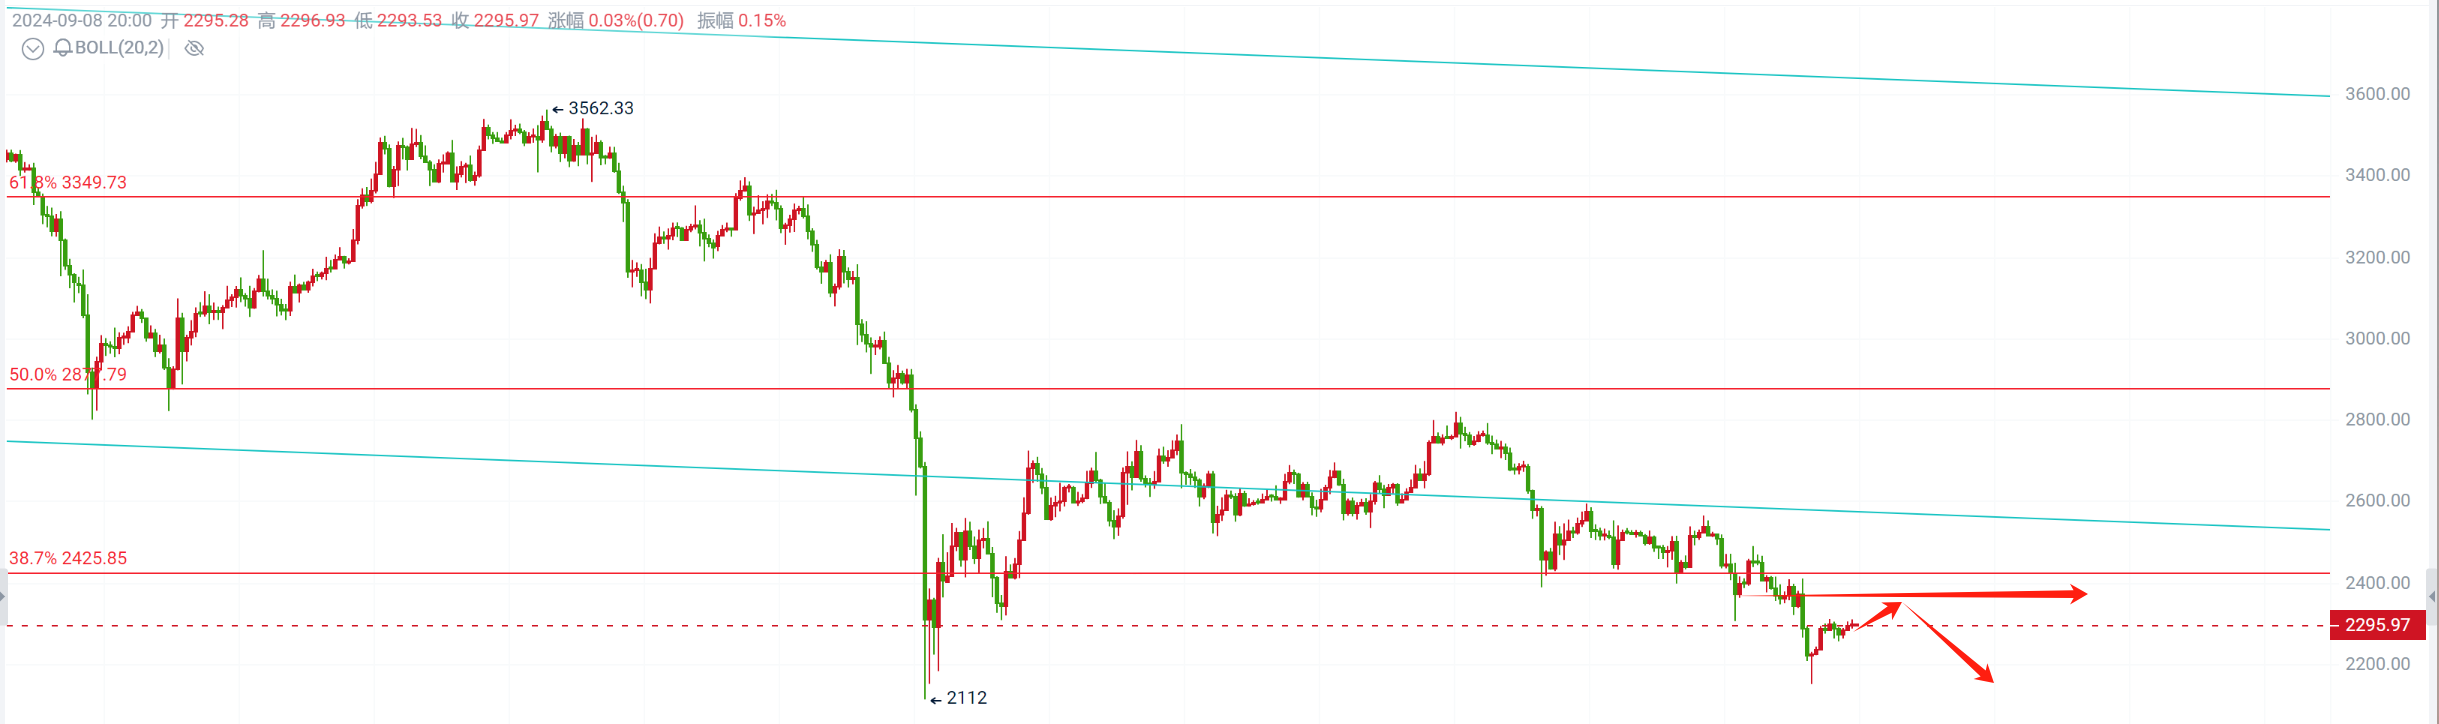
Currently, from the perspective of the weekly chart, the downward trend of Bitcoin and Ethereum has gradually become clear. Looking at the daily chart, Bitcoin has broken through the support level of 55,000, which can now be temporarily viewed as the new resistance level based on the reversal of the top and bottom. The next support level is around 54,000. Similarly, Ethereum has also broken through the support level of 2,400-2,350, which was mentioned earlier as a crucial support level. Whether the bearish trend can continue depends on the situation at this support level. If it is broken, it will approach the 2,000 mark. In fact, after breaking through the 2,400 level, the market once again came to the previous low of around 2,100, with temporary support at 2,200. Looking at the 4-hour chart, after two days of oscillation and consolidation, the market has rebounded to near the resistance level, and it may continue to go short in the future!
Operation strategy: Go short on the rebound!
Short Bitcoin at 54,800-55,300, with a target of 53,500-52,500 and a stop loss above 55,800;
Short Ethereum at 2,320-2,350, with a target of 2,250-2,150 and a stop loss above 2,380;
The strategy is time-sensitive, and specific real-time guidance is the main focus!
Ruo Yu, a professional analyst from the gold medal analysis team, focuses on contract trading guidance. Follow the WeChat public account "币圈若渝" to understand real-time market analysis and operation strategies!

免责声明:本文章仅代表作者个人观点,不代表本平台的立场和观点。本文章仅供信息分享,不构成对任何人的任何投资建议。用户与作者之间的任何争议,与本平台无关。如网页中刊载的文章或图片涉及侵权,请提供相关的权利证明和身份证明发送邮件到support@aicoin.com,本平台相关工作人员将会进行核查。


