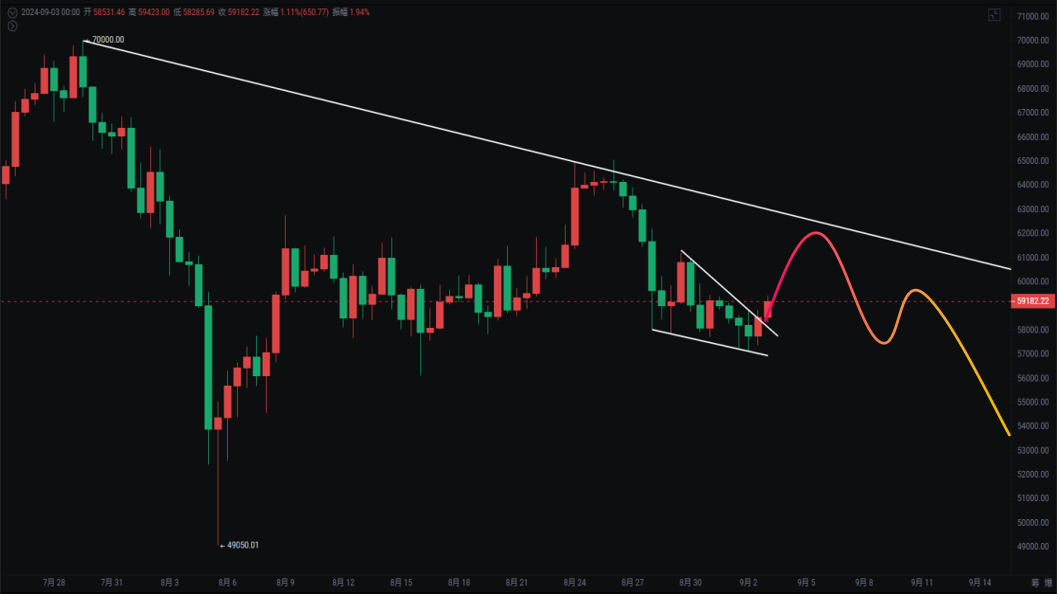
The weekly chart still shows a strong selling signal, but the daily chart has returned to the support zone of 56,000 to 57,600. Previously, it took two weeks of oscillation here before breaking through to 65,000 and then experiencing a false breakthrough and subsequent drop. The second probe at 65,000 serves as a reminder for short-term operations that there is no need to waste time.
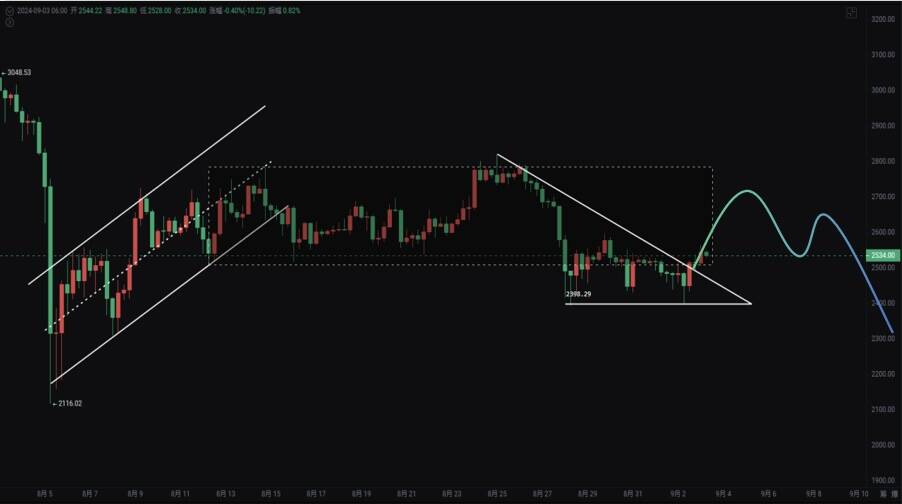
ETH has fallen back to the support level near 2,400, and on the short-term 4-hour chart, it has rebounded three times without breaking through. Currently, it is also under pressure below the 2,600 resistance.
Strong altcoins include ORDI, DUSK, SATS, VELO, AAVE, NFT, MAGA…
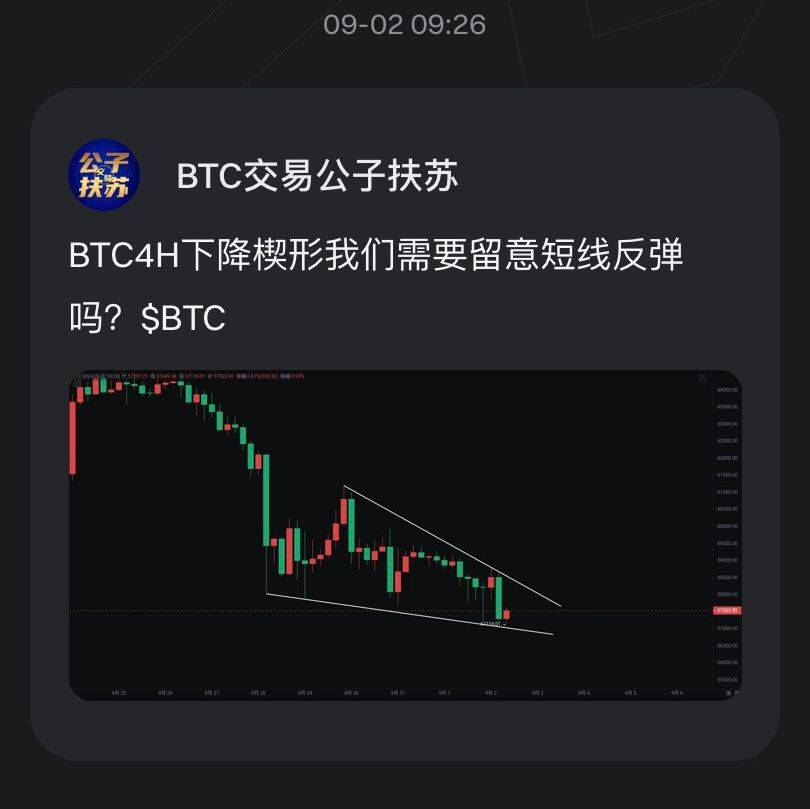
Bitcoin The key focus on the 4-hour chart is the breakout of the descending wedge. It was also mentioned yesterday to pay attention to the 4-hour chart of Bitcoin, which showed a descending wedge. The rebound breakout started at 4 p.m. yesterday, reaching a high rebound of 59,425 in the evening. It is still in a rebound trend.
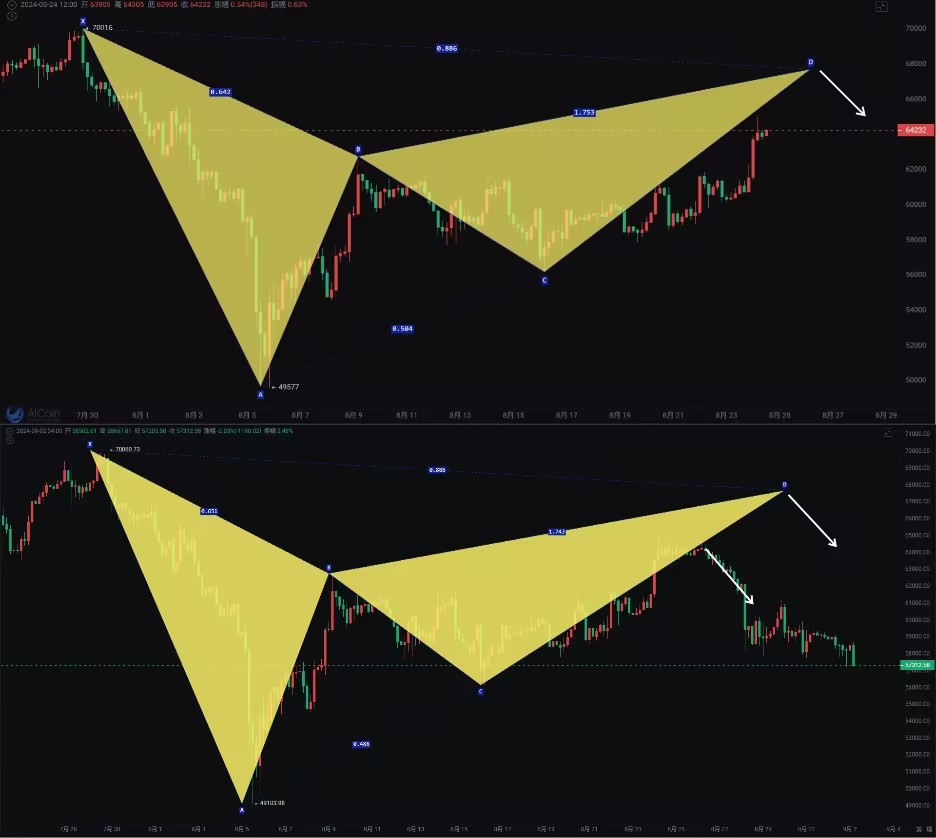
The rebound pressure of the descending wedge is seen at the top of the previous box and the 4-hour descending trend line of 61,500 to 62,000. There is a small probability event of a daily bottom deviation going to 66,000 to 68,000 and then falling again. This target of 49,000 has been anticipated since the rebound, and it is also a key point for completing the rising flag pattern. Because we have always viewed the entire six-month oscillating market as a rising flag pattern, the actions of the "whale" or logical rules will be achieved. This is the self-realization of prophecy, viewed from the perspective of trading dialectics. The logic of this oscillation is very difficult to capture.
Another point is that many altcoins have support at the bottom. At this time, it requires a relatively large amount of chips to break through directly, making it easier to pull up. This is also one of my judgment logics. Support: Resistance:
Ethereum Ethereum has been oscillating in the range of 2,400 to 2,600 on the daily chart for almost a week. It is considered weak if it cannot rise above 2,800 on the weekly chart. It has rebounded after touching 2,392 three times on the 4-hour chart. The next resistance is at 2,600, 2,700, and 2,820. Let's wait patiently for the right opportunity in this very grinding market! Support: Resistance:
If you like my views, please like, comment, and share. Let's go through the bull and bear markets together!!!
The article is time-sensitive and is for reference only, with real-time updates.
Focus on candlestick technical research, and win-win global investment opportunities. Official account: Trading Master Fusu

免责声明:本文章仅代表作者个人观点,不代表本平台的立场和观点。本文章仅供信息分享,不构成对任何人的任何投资建议。用户与作者之间的任何争议,与本平台无关。如网页中刊载的文章或图片涉及侵权,请提供相关的权利证明和身份证明发送邮件到support@aicoin.com,本平台相关工作人员将会进行核查。