The dovish turn is about to cut interest rates and boost Bitcoin
On Friday, August 23, at 10 a.m. Eastern Time, Federal Reserve Chairman Powell made a major statement at the Jackson Hole Global Central Bank Annual Meeting.
It is worth noting that Powell clearly stated, "The time for policy adjustments has come. The policy direction has been clear, and the timing and pace of rate cuts will depend on subsequent data, changes in outlook, and risk balance."
Some analysts have said that although Powell confirmed the widespread expectation in the market for a rate cut in September, this speech was also "dovish," providing some clarity for the financial markets in the short term, but did not provide many clues as to how the Fed will act after the September meeting.
For example, if there is another negative employment report, will there be a significant 50 basis point rate cut, and whether there will be continued rate cuts in the coming months. However, Powell's remarks at least confirmed that the Fed's struggle with inflation over the past two years is about to reach a key turning point.
After the annual meeting, Bitcoin rose from $61,000 to a high of $65,000, a 6.5% increase.
There are about 26 days until the next Federal Reserve interest rate meeting (2024.09.19)
https://hk.investing.com/economic-calendar/interest-rate-decision-168
Market Technical and Sentiment Analysis
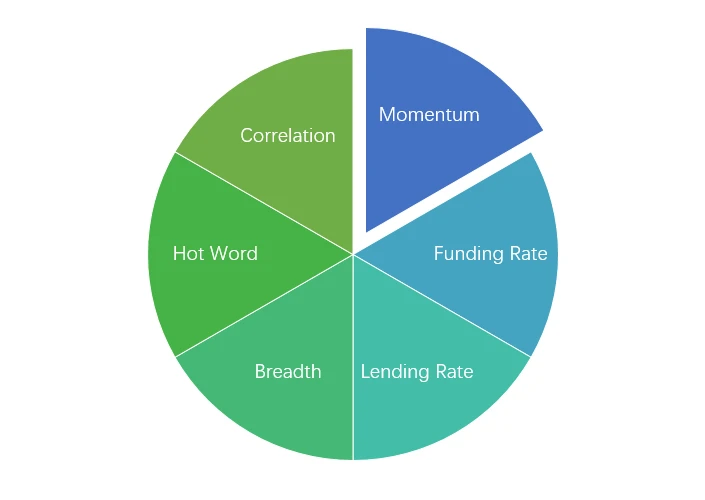
Sentiment Analysis Composition
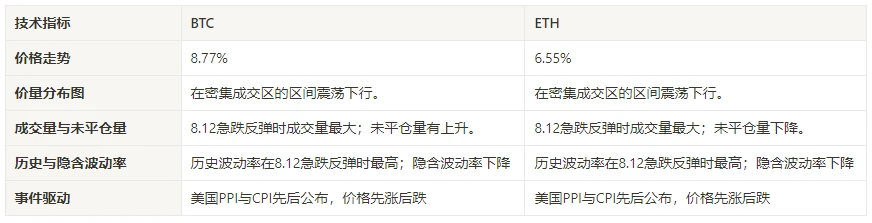
Technical Indicators
Price Trend
BTC prices rose by 8.77% and ETH prices rose by 6.55% in the past week.
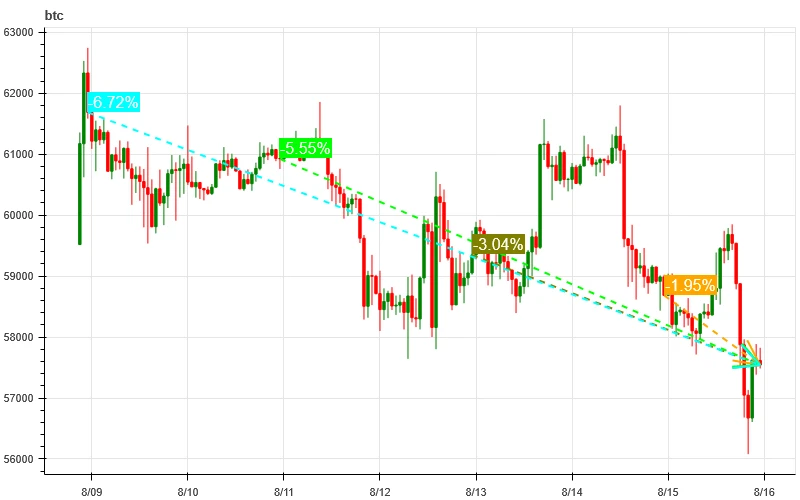
The above chart shows the price trend of BTC over the past week.
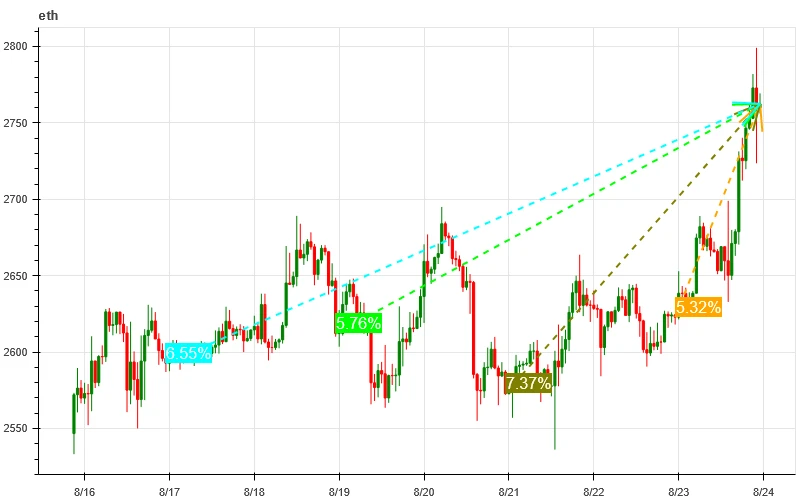
The above chart shows the price trend of ETH over the past week.
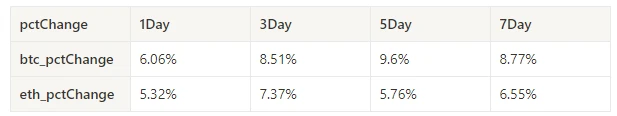
The table shows the price change rate over the past week.
Price-Volume Distribution Chart (Support and Resistance)
In the past week, both BTC and ETH broke through the dense trading area to form an upward trend.
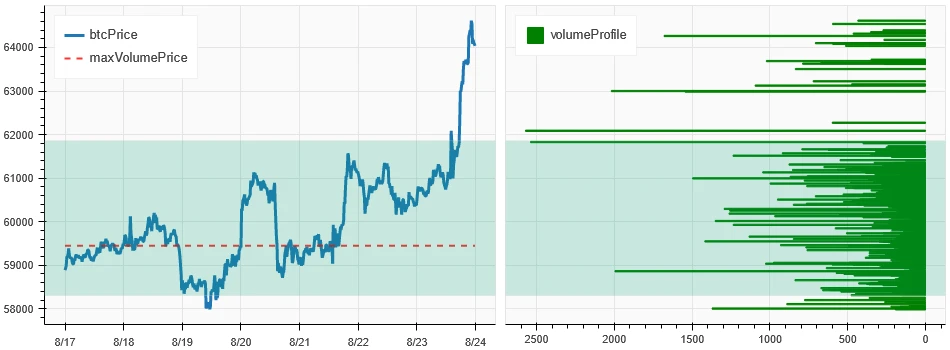
The above chart shows the distribution of the dense trading area for BTC over the past week.
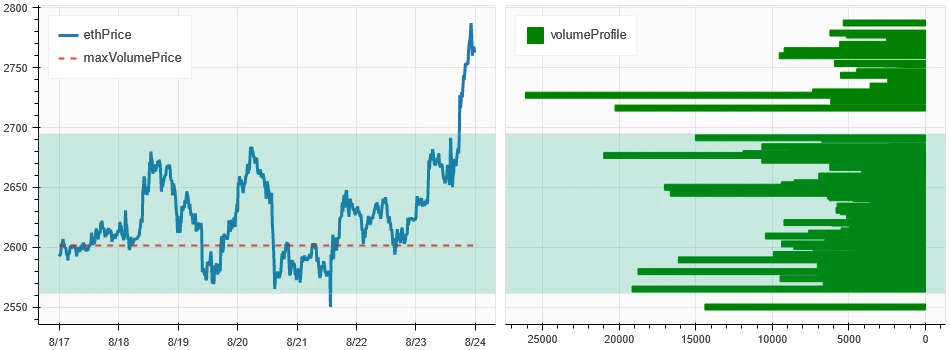
The above chart shows the distribution of the dense trading area for ETH over the past week.
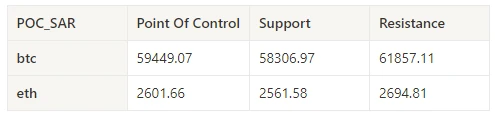
The table shows the dense trading area for BTC and ETH each week over the past week.
Volume and Open Interest
In the past week, both BTC and ETH had the largest trading volume when they rose on August 23; the open interest of both BTC and ETH increased slightly.
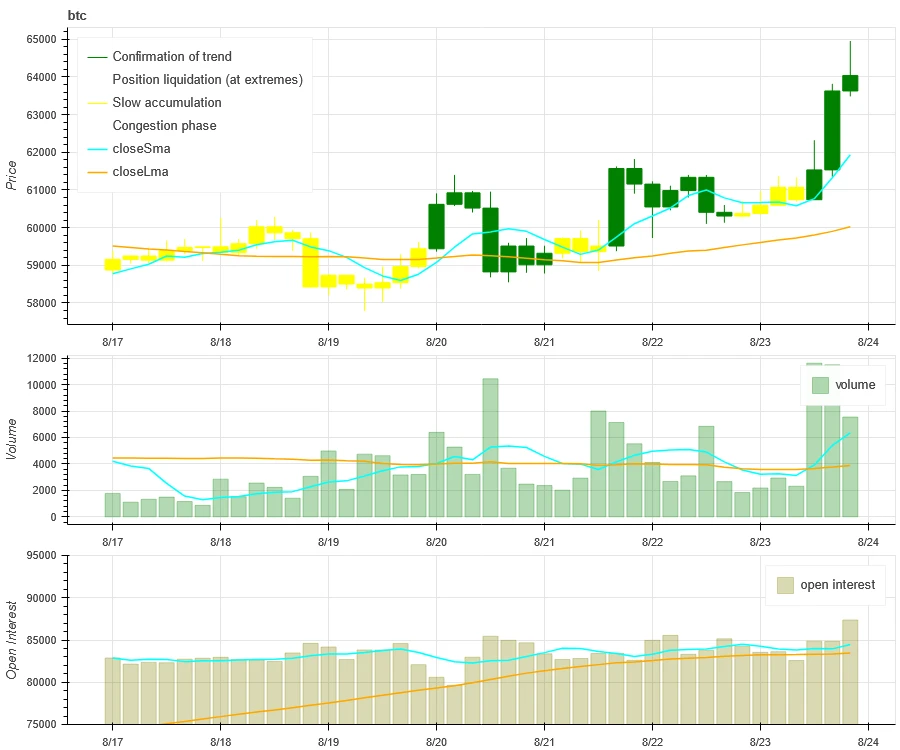
The top of the above chart shows the price trend of BTC, the middle shows the trading volume, and the bottom shows the open interest. The light blue line is the 1-day average, and the orange line is the 7-day average. The color of the candlestick represents the current state: green indicates price increase with volume support, red indicates closing positions, yellow indicates slow accumulation of positions, and black indicates crowded conditions.
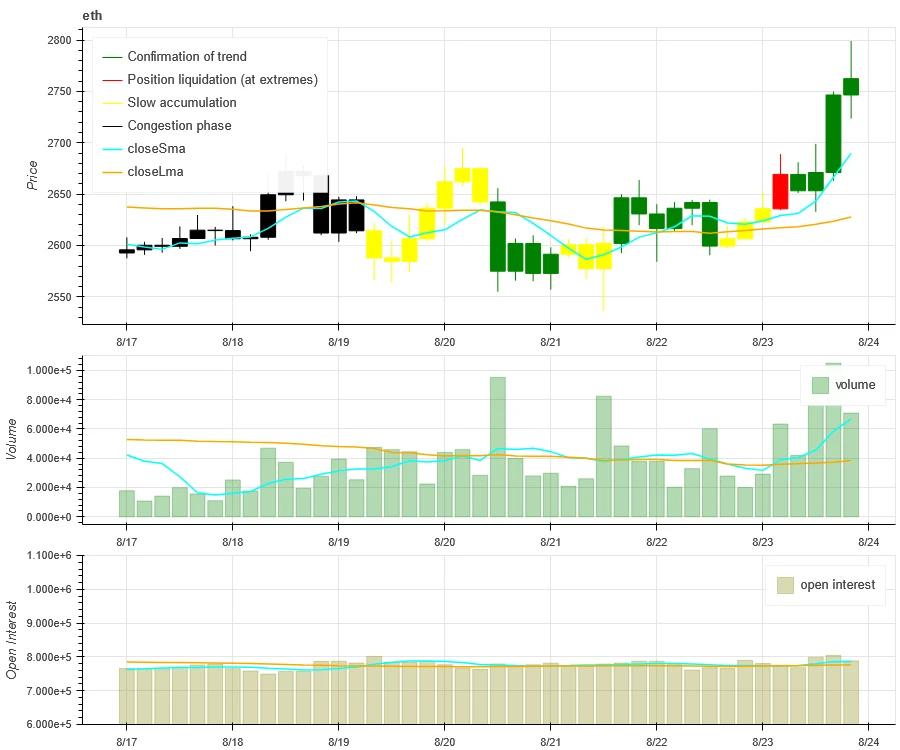
The top of the above chart shows the price trend of ETH, the middle shows the trading volume, and the bottom shows the open interest. The light blue line is the 1-day average, and the orange line is the 7-day average. The color of the candlestick represents the current state: green indicates price increase with volume support, red indicates closing positions, yellow indicates slow accumulation of positions, and black indicates crowded conditions.
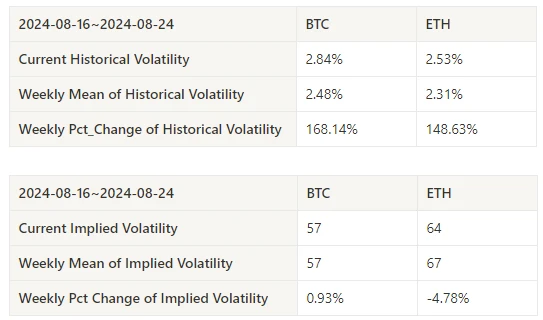
Historical Volatility and Implied Volatility
In the past week, the historical volatility of BTC and ETH was highest during the wide fluctuations on August 20; BTC's implied volatility increased while ETH's decreased.
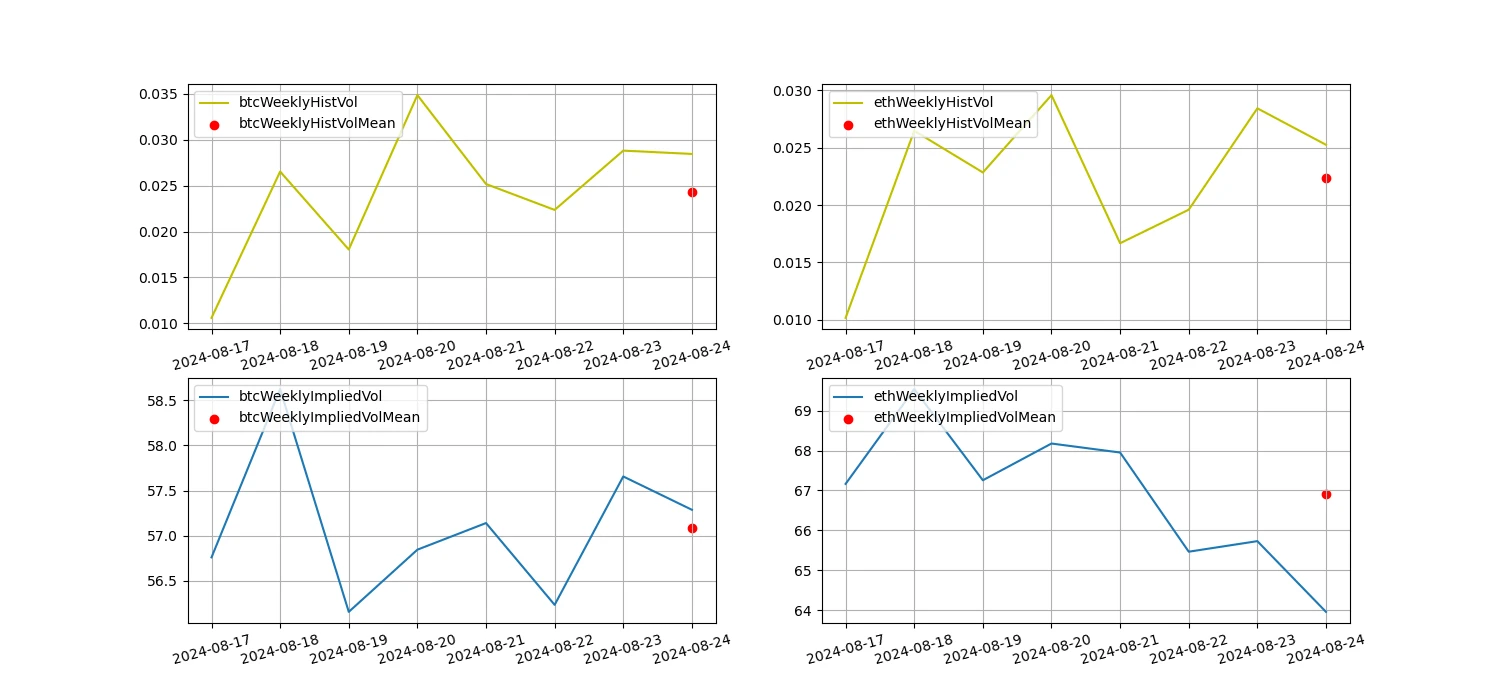
The yellow line represents historical volatility, the blue line represents implied volatility, and the red dots are the 7-day averages.
Event-Driven
In the past week, the Federal Reserve's annual meeting hinted at an upcoming interest rate cut, and Bitcoin rose by 6.5%.
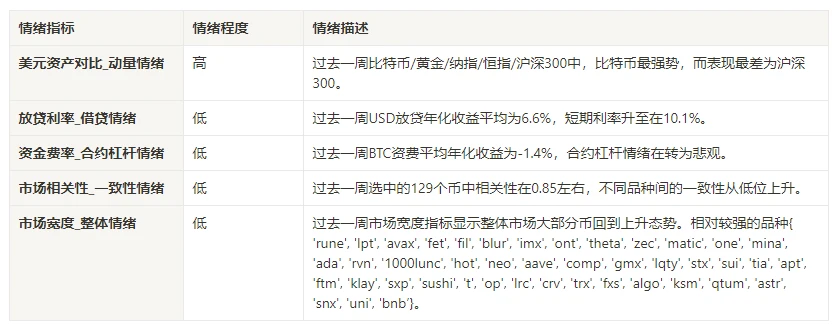
Sentiment Indicators
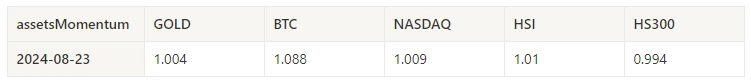
Momentum Sentiment
In the past week, among Bitcoin, Gold, Nasdaq, Hang Seng, and CSI 300, Bitcoin was the strongest performer, while the worst performer was the CSI 300.
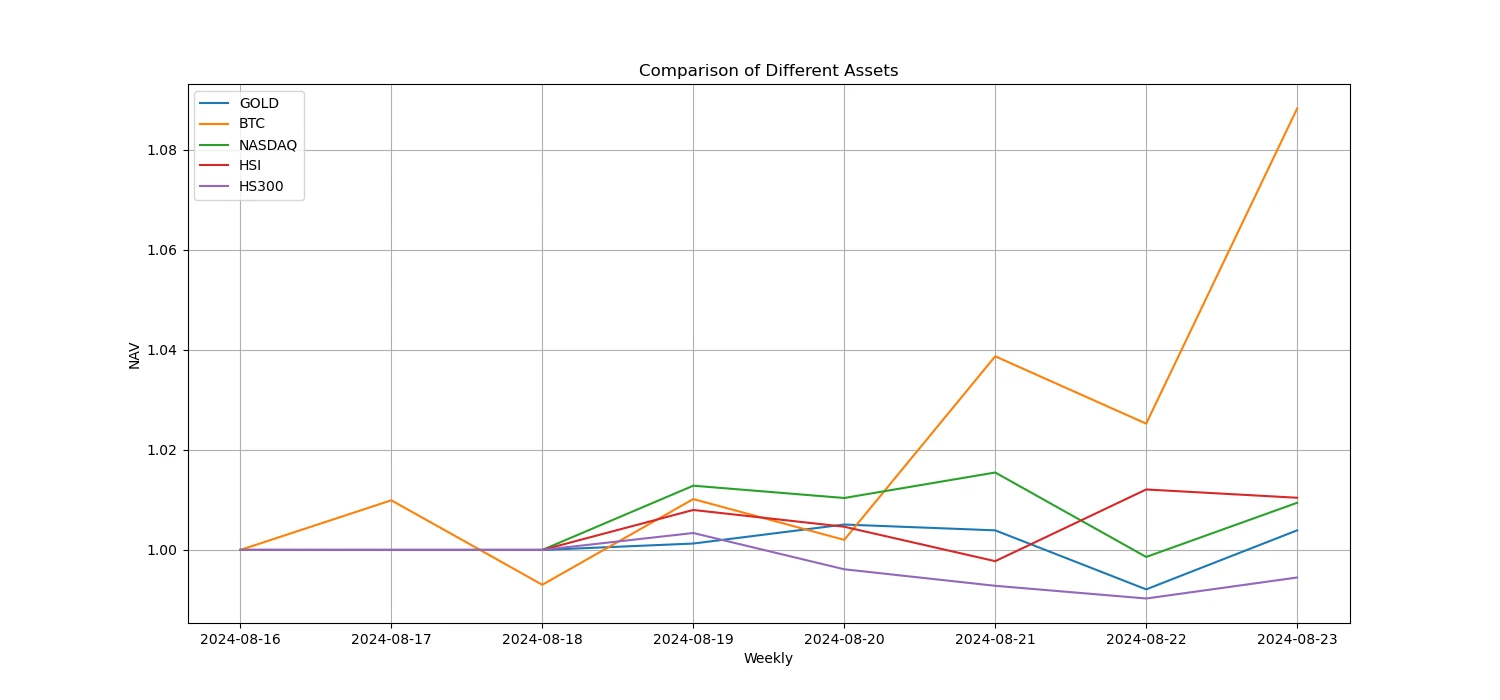
The above chart shows the performance of different assets over the past week.
Lending Rate_Lending Sentiment
In the past week, the average annualized USD lending yield was 6.6%, and the short-term interest rate rose to 10.1%.
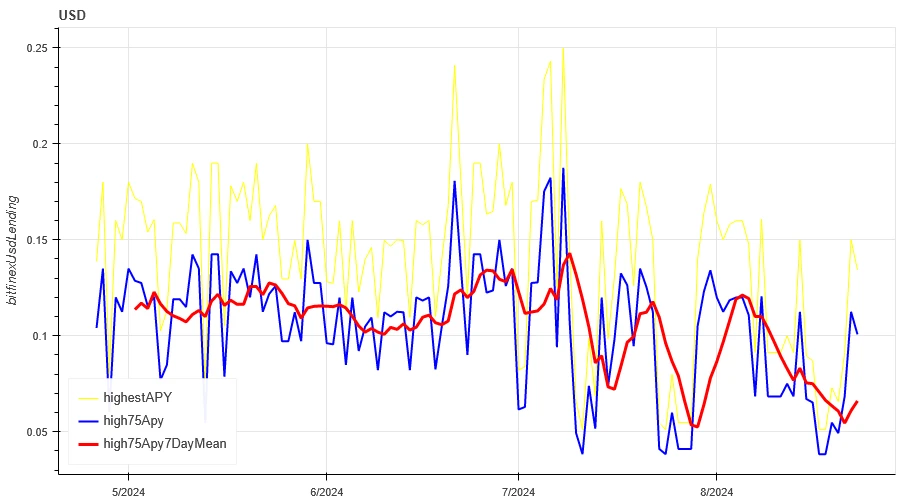
The yellow line represents the highest price of USD interest rates, the blue line represents 75% of the highest price, and the red line represents the 7-day average of 75% of the highest price.
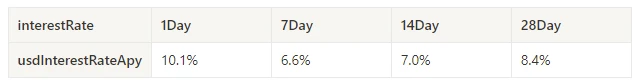
The table shows the average yield of USD interest rates for different holding periods in the past.
Funding Rate_Contract Leverage Sentiment
In the past week, the average annualized yield of BTC funding was -1.4%, and the contract leverage sentiment turned bearish.
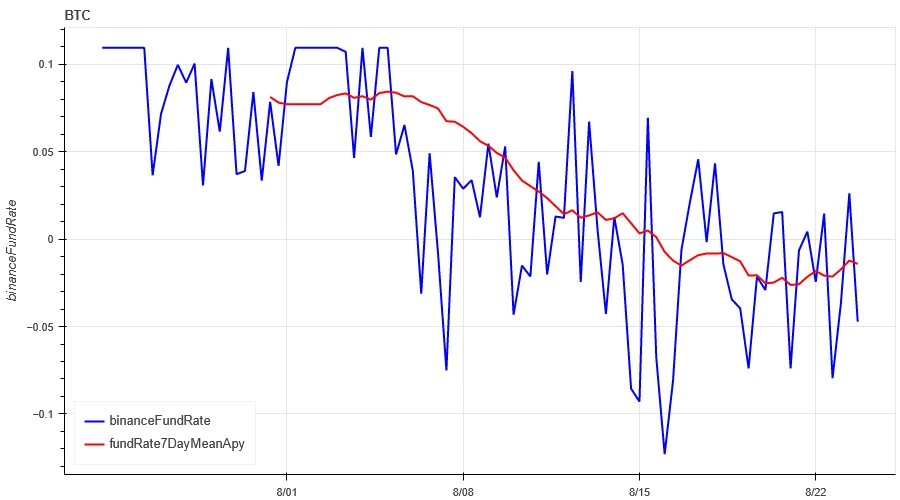
The blue line represents the funding rate of BTC on Binance, and the red line represents its 7-day average.
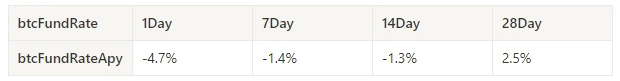
The table shows the average yield of BTC funding for different holding periods in the past.
Market Correlation_Consistency Sentiment
In the past week, the correlation among the selected 129 coins was around 0.85, and the consistency between different varieties increased from a low level.
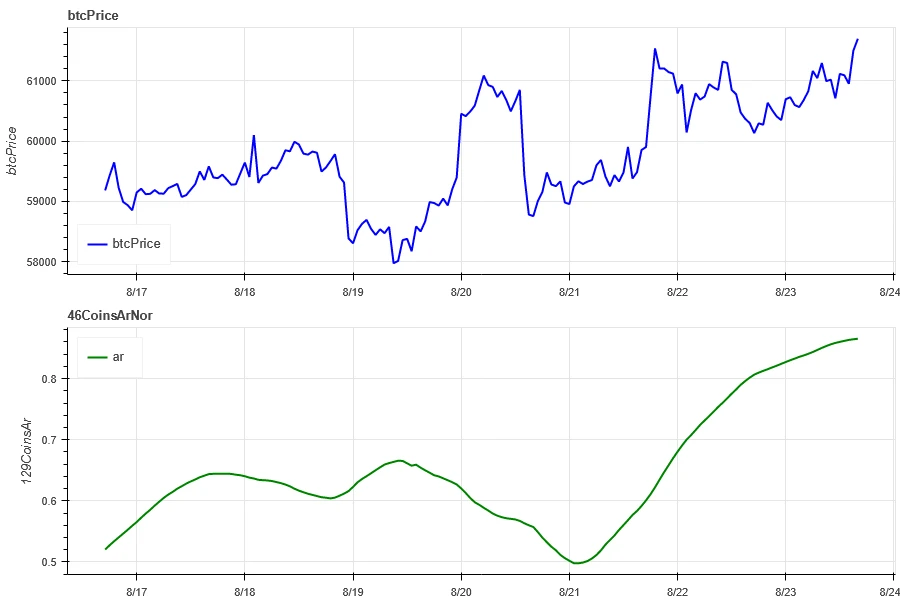
The blue line represents the Bitcoin price, and the green line represents the overall correlation among ['1000floki', '1000lunc', '1000pepe', '1000shib', '1000xec', '1inch', 'aave', 'ada', 'agix', 'algo', 'ankr', 'ant', 'ape', 'apt', 'arb', 'ar', 'astr', 'atom', 'audio', 'avax', 'axs', 'bal', 'band', 'bat', 'bch', 'bigtime', 'blur', 'bnb', 'btc', 'celo', 'cfx', 'chz', 'ckb', 'comp', 'crv', 'cvx', 'cyber', 'dash', 'doge', 'dot', 'dydx', 'egld', 'enj', 'ens', 'eos','etc', 'eth', 'fet', 'fil', 'flow', 'ftm', 'fxs', 'gala', 'gmt', 'gmx', 'grt', 'hbar', 'hot', 'icp', 'icx', 'imx', 'inj', 'iost', 'iotx', 'jasmy', 'kava', 'klay', 'ksm', 'ldo', 'link', 'loom', 'lpt', 'lqty', 'lrc', 'ltc', 'luna2', 'magic', 'mana', 'matic', 'meme', 'mina', 'mkr', 'near', 'neo', 'ocean', 'one', 'ont', 'op', 'pendle', 'qnt', 'qtum', 'rndr', 'rose', 'rune', 'rvn', 'sand', 'sei', 'sfp', 'skl', 'snx', 'sol', 'ssv', 'stg', 'storj', 'stx', 'sui', 'sushi', 'sxp', 'theta', 'tia', 'trx', 't', 'uma', 'uni', 'vet', 'waves', 'wld', 'woo', 'xem', 'xlm', 'xmr', 'xrp', 'xtz', 'yfi', 'zec', 'zen', 'zil', 'zrx’].
Market Breadth_Overall Sentiment
In the past week, out of the selected 129 coins, 89% were above the 30-day moving average, compared to 75% for BTC. 66% were more than 20% above the lowest price in the past 30 days, and 48% were less than 10% below the highest price in the past 30 days. The market breadth indicator over the past week shows that most coins have returned to an upward trend.
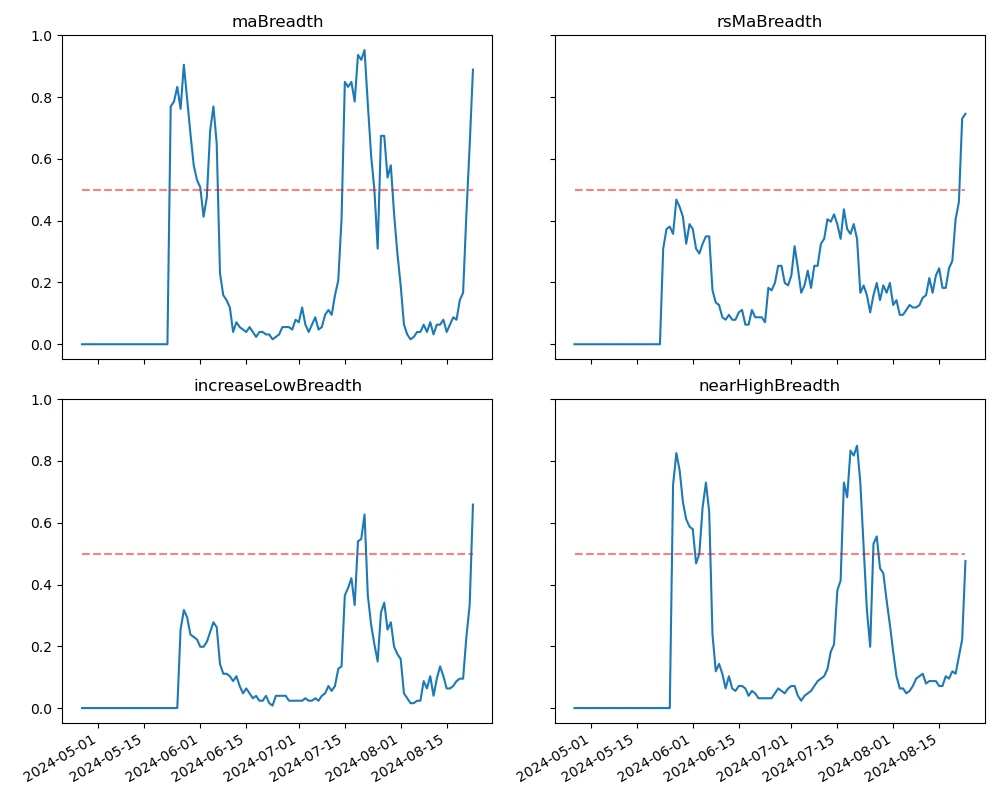
The chart above shows the 30-day width index distribution of the following assets: ['bnb', 'btc', 'sol', 'eth', '1000floki', '1000lunc', '1000pepe', '1000sats', '1000shib', '1000xec', '1inch', 'aave', 'ada', 'agix', 'ai', 'algo', 'alt', 'ankr', 'ape', 'apt', 'arb', 'ar', 'astr', 'atom', 'avax', 'axs', 'bal', 'band', 'bat', 'bch', 'bigtime', 'blur', 'cake', 'celo', 'cfx', 'chz', 'ckb', 'comp', 'crv', 'cvx', 'cyber', 'dash', 'doge', 'dot', 'dydx', 'egld', 'enj', 'ens', 'eos','etc', 'fet', 'fil', 'flow', 'ftm', 'fxs', 'gala', 'gmt', 'gmx', 'grt', 'hbar', 'hot', 'icp', 'icx', 'idu', 'imx', 'inj', 'iost', 'iotx', 'jasmy', 'jto', 'jup', 'kava', 'klay', 'ksm', 'ldo', 'link', 'loom', 'lpt', 'lqty', 'lrc', 'ltc', 'luna2', 'magic', 'mana', 'manta', 'mask', 'matic', 'meme', 'mina', 'mkr', 'near', 'neo', 'nfp', 'ocean', 'one', 'ont', 'op', 'ordi', 'pendle', 'pyth', 'qnt', 'qtum', 'rndr', 'robin', 'rose', 'rune', 'rvn', 'sand', 'sei', 'sfp', 'skl', 'snx', 'ssv', 'stg', 'storj', 'stx', 'sui', 'sushi', 'sxp', 'theta', 'tia', 'trx', 't', 'uma', 'uni', 'vet', 'waves', 'wif', 'wld', 'woo','xai', 'xem', 'xlm', 'xmr', 'xrp', 'xtz', 'yfi', 'zec', 'zen', 'zil', 'zrx' ].
Summary
In the past week, after a period of volatility, Bitcoin (BTC) and Ethereum (ETH) showed an upward trend. The historical volatility reached its peak during the wide fluctuations on August 20, and the trading volume reached its peak on August 23 during the upward movement. The open interest for BTC and ETH futures contracts both increased. The implied volatility for BTC increased while ETH decreased. Bitcoin showed the strongest performance compared to gold, Nasdaq, Hang Seng, and CSI 300, while the CSI 300 showed the weakest performance. The funding rate for Bitcoin dropped into negative territory, reflecting a bearish sentiment among market participants. The correlation among the selected 129 coins remained around 0.85, indicating an increase in consistency among different varieties. The market breadth indicator shows that most cryptocurrencies have returned to an upward trend. The Federal Reserve's annual meeting hinted at an upcoming interest rate cut, and Bitcoin rose by 6.5%.
Twitter: @https://x.com/CTA_ChannelCmt
Website: channelcmt.com
免责声明:本文章仅代表作者个人观点,不代表本平台的立场和观点。本文章仅供信息分享,不构成对任何人的任何投资建议。用户与作者之间的任何争议,与本平台无关。如网页中刊载的文章或图片涉及侵权,请提供相关的权利证明和身份证明发送邮件到support@aicoin.com,本平台相关工作人员将会进行核查。


