Original Author: Chandler, Foresight News
In 2024, the cryptocurrency market experienced extremely violent fluctuations, especially with the price of Bitcoin fluctuating between $50,000 and $70,000 for several months. This volatility was not only frequent and difficult to predict, but also did not show the trend seen in traditional markets or follow the typical cycles of bull or bear markets, forcing us to re-examine the market's internal logic and operation mechanism.
A significant feature of the current market is the clear differentiation in investor strategies, with long-term holders and short-term traders adopting drastically different approaches during this period of large fluctuations. Long-term holders typically choose to maintain stable positions during the volatility to cope with market uncertainty, while short-term traders make more frequent market operations using the volatility to seek short-term gains. Of particular note is the strategy of institutional investors, led by Bitcoin spot ETF investments, which has shown particularly complex performance in the current market. These institutions need to re-evaluate their positions in the broad market volatility, especially reallocating from the high management fee Grayscale Bitcoin Trust (GBTC) to other Bitcoin spot ETFs. Additionally, they also need to carefully assess potential risks in the market to ensure that their investment strategies remain consistent with market dynamics.
In this context, on-chain indicators have become a key tool for understanding the current market situation. Through in-depth analysis of on-chain data, we can capture subtle changes in market sentiment, understand the evolution of investor behavior, and then infer potential market trends. By combining on-chain indicator data from previous bull markets, we attempt to outline the overall picture of the current Bitcoin market and provide a scientific basis for possible future market trends.
Bitcoin MVRV Z-Score: Less than half of the previous bull market
MVRV (Market Value to Realized Value) is an important indicator in the Bitcoin and other cryptocurrency markets used to measure market sentiment and price trends. This indicator provides information on whether the current price of an asset is overvalued or undervalued by comparing market value and realized value. Market value is the current market value of Bitcoin, calculated by multiplying the current price by the total circulating supply of Bitcoin; realized value is the realized market value of Bitcoin, determined by calculating the price at the last transfer of each Bitcoin. Realized value reflects the total price each holder actually paid in the Bitcoin market, effectively removing short-term market sentiment from the market value indicator.
The MVRV Z-Score is a standard deviation test used to reveal extreme data between market value and realized value. This indicator, represented by the orange line, can effectively identify periods when market value is abnormally high relative to realized value. When the Z-Score enters the pink area, it usually indicates the top of the market cycle; when the Z-Score enters the green area, it indicates that the price of Bitcoin is severely undervalued.
By analyzing historical data, it can be observed that when the MVRV Z-Score is at an extreme high or low, it often corresponds to a turning point in the market. For example, the top of the Bitcoin bull market at the end of 2017, and the bear market bottoms in 2018 and 2022, can all be found in this indicator. Although the peak of the 2021 bull market did not reach the peak of previous years, it briefly touched the pink area representing the market top. In 2024, despite the price of Bitcoin surpassing the previous bull market high, its MVRV Z-Score is still less than half of the previous high.
Puell Multiple: This round's high point is only 2.4
The Puell Multiple is another indicator consistent with cycle peaks, calculated as the "current miner revenue divided by the 365-day moving average." Miner revenue mainly consists of the market value of newly issued Bitcoins (new Bitcoin supply obtained by miners) and related transaction fees, and can be used to estimate the state of miner income. The formula is: Puell Multiple = Miner Revenue (market value of newly issued Bitcoins) / 365-day moving average miner revenue.
The Puell Multiple has important reference value in judging whether the price of Bitcoin deviates from a reasonable range. Selling mined Bitcoins is the main source of income for miners, used to cover the capital investment and electricity costs of mining equipment. Therefore, the average miner revenue over a period of time can indirectly be seen as the minimum threshold for maintaining the operating cost of miners. When the Puell Multiple enters the green area, it means that the daily issuance value of Bitcoin is abnormally low, usually presenting a good buying opportunity. Historically, investors who bought during these periods often achieved excess returns. Conversely, when the Puell Multiple enters the red area, it indicates that miner income is significantly higher than historical standards, and at this time, the price of Bitcoin often reaches a high point, presenting a favorable opportunity to take profits.
During the upward trend in March 2024, the Puell Multiple only reached 2.4, which is still not enough to indicate that the market has reached its peak. With the Bitcoin halving event, the reduction in mining rewards further squeezed the profit margins of miners. According to the financial performance disclosed by the Bitcoin mining company BitFuFu for Q2 2024, the average cost of self-mining BTC (including all direct costs such as electricity fees, hosting fees, and hash rate purchase costs, but excluding depreciation) was $51,887 per BTC, compared to $19,344 per BTC in the same period in 2023. In this situation, the mining cost has approached or even exceeded the market price of Bitcoin, putting miners under significant operational pressure.
The sharp drop in the Puell Multiple reflects the market's reaction to this cost increase. Despite the rise in the price of Bitcoin before and after the halving, the Puell Multiple has not yet reached historical highs, indicating that the market has not fully absorbed these changes, and the expected price surge has not occurred. This phenomenon may indicate that the Bitcoin market has entered a new stage, where miners have to face higher costs and lower profit margins. At the same time, this may also lead to a reduction in the supply of Bitcoin in the market, providing some support for the price in the medium to long term.
PlanB's 200-Week Moving Average Heatmap: The pullback is about to end
PlanB's 200-week moving average (200WMA) is a key indicator for analyzing the long-term trend of Bitcoin, often considered an important support and resistance level in the market, and an effective tool for measuring changes in market sentiment. During the bear market of 2018-2019 and the market volatility caused by COVID-19 in 2020, the 200WMA demonstrated its significant role as an important support line. Even during the 2021 bull market, although the price of Bitcoin experienced multiple pullbacks, it was effectively supported whenever the price approached the 200WMA, and re-entered the upward channel.
Historical data shows that when orange and red dots appear on the price chart, it usually indicates that the market is overheated, presenting a good opportunity to sell Bitcoin. Recently, PlanB also stated that according to the 200WMA heatmap, Bitcoin has increased 4 times from the bottom in 2022 to the current price, while historically, 7-10x starts from this state.
RHODL Ratio: Overall market speculation enthusiasm has weakened
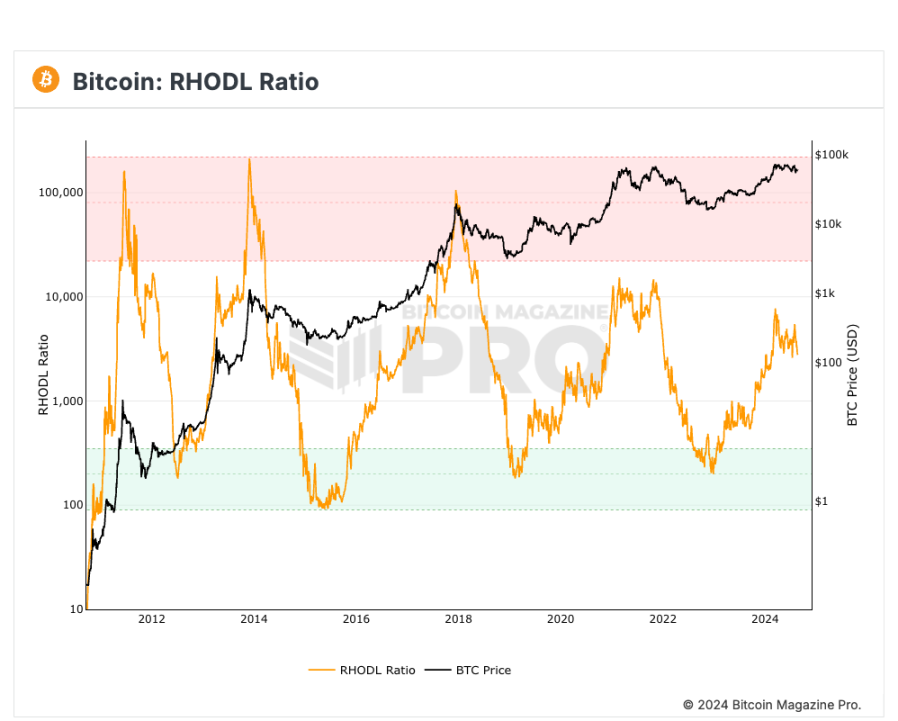
RHODL (Realized HODL) Ratio was created by blogger Philip Swift (@positivecrypto) in June 2020 and is an important indicator for evaluating speculative activity and holder behavior in the Bitcoin market. It measures market activity and speculation by comparing the amount of Bitcoin held for different periods, especially short-term (1 week to 1 month) and long-term (1 year to 2 years) UTXO (Unspent Transaction Output) quantities. Specifically, the RHODL Ratio is calculated by dividing the long-term UTXO quantity by the short-term UTXO quantity, with a higher ratio typically indicating a larger number of short-term holders, implying a stronger speculative activity in the market; conversely, a lower ratio indicates a higher proportion of long-term holders, suggesting relative market stability.
In practical application, the RHODL Ratio has performed well in identifying the tops of Bitcoin market cycles. When the 1-week RHODL band value is significantly higher than the 1-2 year band value, it usually signals an overheated market and a potential signal that the price may have reached its peak. In this case, the RHODL Ratio enters the red zone, which is often a good time for investors to take profits. Currently, the RHODL Ratio does not show a signal that Bitcoin has reached the top of the bull market. Although there was a relatively high point in the price of Bitcoin after breaking the previous high, the RHODL Ratio has shown a trend of oscillating decline over the past few months. This downward trend reflects a gradual waning of market heat, but due to fluctuating market sentiment, the number of short-term holders remains relatively high. This indicates that while overall market speculative enthusiasm has weakened, short-term investor activity remains active, showing that the market has not fully entered a cooling phase.
LTH/STH Realized Cap Ratio: The main uptrend may not have arrived
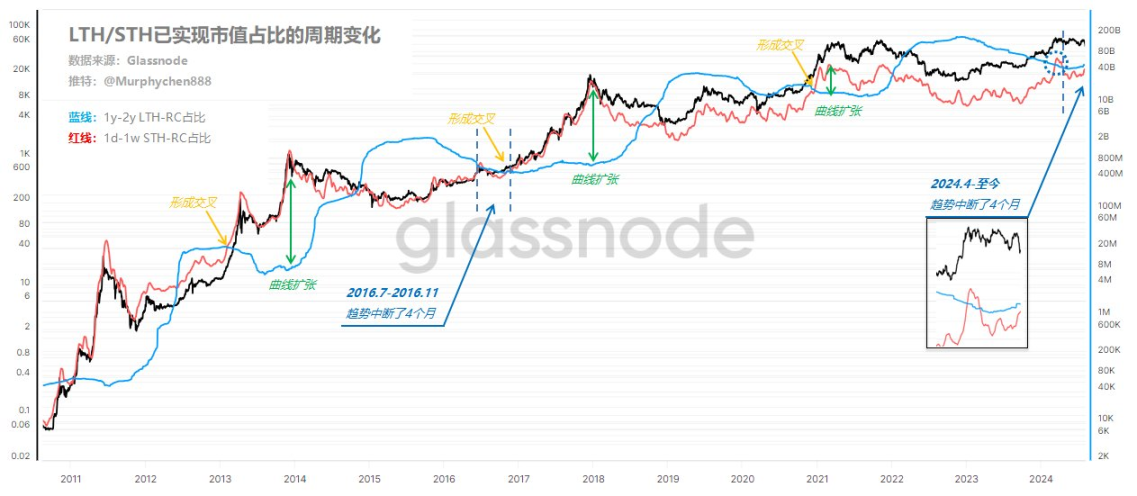
The cycle changes in the LTH/STH Realized Cap Ratio, compiled by on-chain analyst @Murphychen, provide us with a method to observe trends in the Bitcoin market. By analyzing the wealth distribution of long-term holders (LTH) and short-term holders (STH), we can better understand the cyclical changes in the market.
At the low point of the bear market, long-term holders typically hold the majority of the wealth in the market, with the blue line (LTH's realized cap ratio) reaching the peak of the cycle. At the peak of the bull market, short-term holders dominate the market supply, with the red line (STH's realized cap ratio) reaching a high point, and the price of Bitcoin often being at a cyclical high. Whenever the red line crosses above the blue line, it indicates that the market may enter the "main uptrend" phase, signaling the start of the bull market; conversely, when the red line crosses below the blue line, it often signals the end of the bull market.
On March 9, 2024, the red line briefly crossed above the blue line, and then crossed below the blue line on April 15. This brief crossover may have been caused by short-term FOMO sentiment triggered by the significant positive news of the ETF, leading short-term investors to take over the chips of long-term holders. However, due to a lack of sustained inflow of funds, this brief market frenzy quickly subsided and could not support a longer-term uptrend. A similar phenomenon occurred from July to November 2016, when the market trend was interrupted for about four months. Although the current market has experienced short-term fluctuations, based on this brief breakthrough, it cannot be confirmed that the "main uptrend" phase of this cycle has begun.
Overall, although the price of Bitcoin experienced violent fluctuations in 2024 and broke through previous highs, several key on-chain indicators indicate that the market has not reached the heights of the previous bull market. Both the MVRV Z-Score and the Puell Multiple show that the market has risen but has not yet reached historical highs, and the 200-week moving average continues to provide strong support for the price, indicating that the market pullback may be nearing its end. In addition, the downward trend of the RHODL Ratio and the complex crossover signals of the LTH/STH Realized Cap Ratio further suggest that market heat is gradually waning, but has not completely cooled, and may still experience fluctuations in the short term.
These indicators indicate that the current market is still in an adjustment phase and has not entered the typical bull market "main uptrend." However, on the other hand, in the current complex and uncertain market environment, it seems that we are ushering in a new bull market that cannot be completely "carved in stone," especially against the backdrop of the accelerated progress of the spot ETF in Bitcoin bull market, the introduction of spot ETFs has brought in more institutional investment funds, increased market participation and liquidity, and also brought new complexity to the market. With changes in market sentiment and fund reallocation, there may be a new uptrend cycle in the future.
免责声明:本文章仅代表作者个人观点,不代表本平台的立场和观点。本文章仅供信息分享,不构成对任何人的任何投资建议。用户与作者之间的任何争议,与本平台无关。如网页中刊载的文章或图片涉及侵权,请提供相关的权利证明和身份证明发送邮件到support@aicoin.com,本平台相关工作人员将会进行核查。


