August 17th Airborne: The Causes and Prospects of Global Financial Turbulence, Where Will Bitcoin Go in the Future?
Since July 2024, global financial markets have been turbulent, with plunges in the US and Japanese stock markets, a decline in the US dollar index, and a drop in Bitcoin prices. The reasons for the turbulence include the unwinding of the yen carry trade, concerns about a US economic recession, uncertainty about the US presidential election, and sustainability concerns about high-tech stocks. Market volatility is expected to increase in the future, but the probability of a financial crisis is low.

In August, the non-farm data was significantly positive, and the CPI was also slightly positive. Both of these data were positive, but the price of the currency has been rising and falling, indicating that at this point, the rise in the price of the currency is no longer paying much attention to the data.
In the short term, it can be defined as a process of oscillation and accumulation of power in the bull market trend, oscillation and washing out, and then accumulation and rise. The next round of rise will also be accompanied by a short squeeze trend, mainly to digest the interest rate cut in September. During the oscillation process, many people will lose their direction.

BTC/Daily Chart
On the daily chart of Bitcoin, yesterday's candle once again closed lower, and the price once broke through the key support at 59500. From a technical perspective, the daily chart had already entered the bearish risk zone, but the price of the currency did not show a decent correction. It seems that the bears want to enter the next round of decline, and the bulls will continue to extend the cycle, far beyond the cognition of everyone in the market. However, once this kind of decline appears, it will be very difficult to escape if you hold short positions, so in my opinion, it is still necessary to continue to choose to enter at a low position and remain bullish.
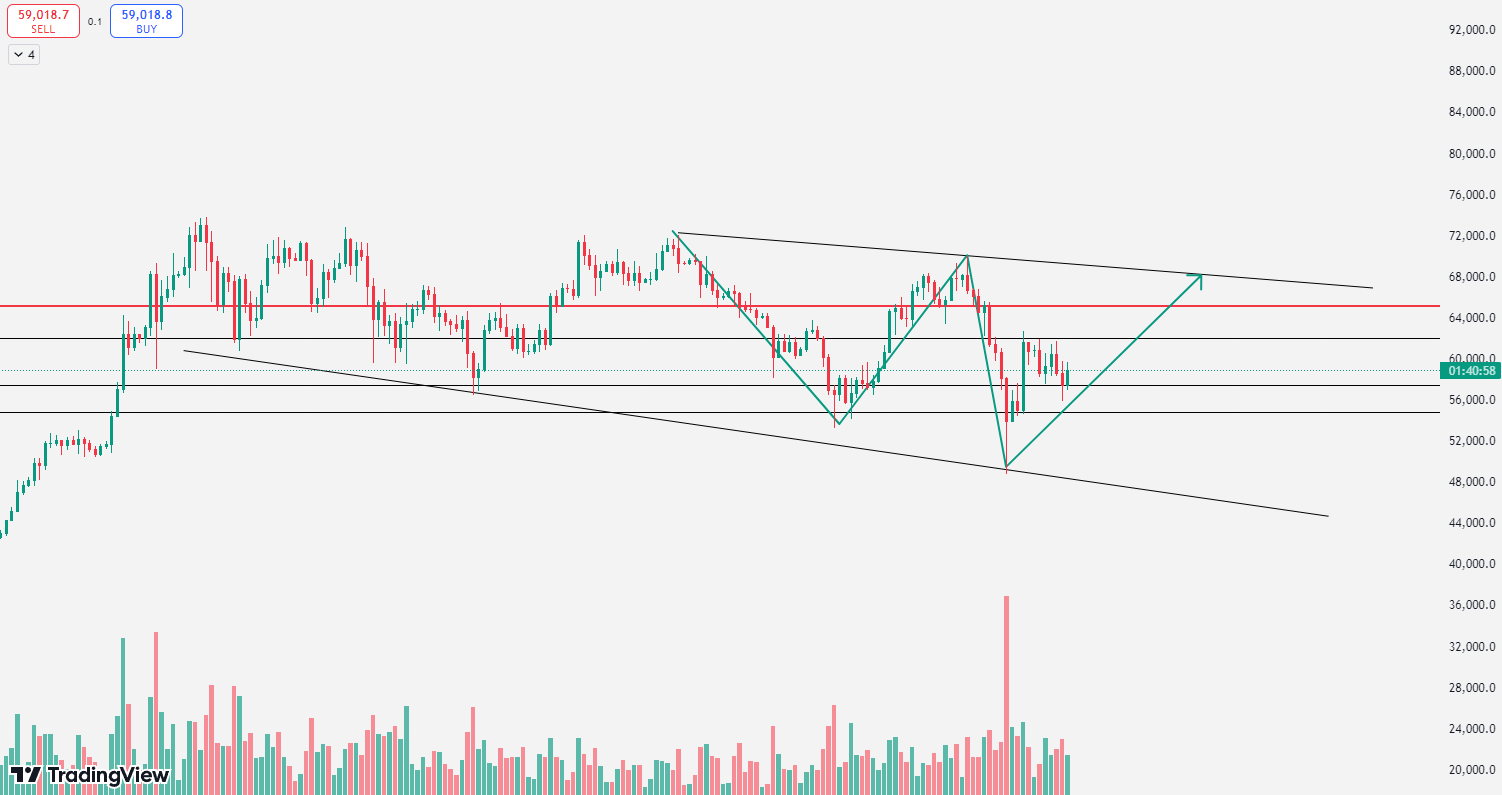
BTC/4h Chart
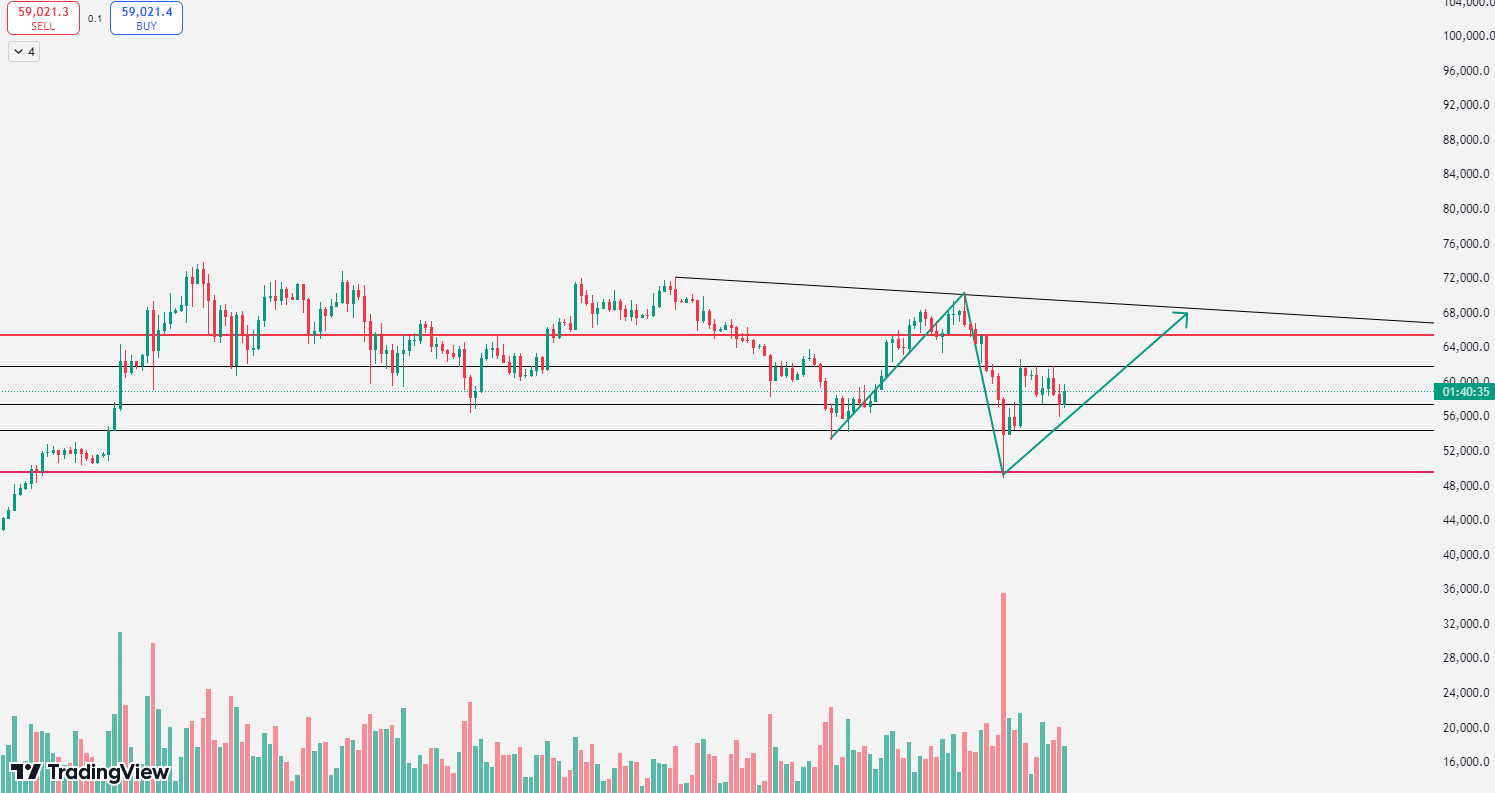
On the 4-hour chart of Bitcoin, the price was under pressure at 59800 in the early morning yesterday, and then sharply fell to around 56000, then stabilized near 56000 and rose again to the resistance near 59800. At this time, there is some intraday small double top resistance at 59800, which is also a Fibonacci retracement point. In the future, it will serve as a backup key resistance level to watch. As shown in the chart, on the 4-hour chart, there may be some similarities to the previous trend, so there is a probability of reaching 57500 today, followed by a small-scale rebound, and then reaching the resistance near 59800 before turning down again. Various signs indicate that the price of the currency may need a short-term upward adjustment, and the key support is around 57500, which can be chosen for buying, with resistance at 59800.

Strategy 1: It is recommended to go long in batches at 57800-57300, with a stop loss at 56600, and the target is to look at around 59500-59800-60400.
The above is a personal suggestion, for reference only. Investment involves risks, and trading should be cautious.
There is a delay in the release of the article, and the market is changing rapidly. The mentioned points in the article do not serve as a basis for following orders. For more information on the market and order execution, please refer to the real-time strategy of "Airborne"
Save and scan the QR code to follow the public account below: "Airborne"

Comprehensive guidance time: 7:00 am to 2:00 am the next day
This article is original by "Airborne," with over ten years of investment experience, having handled funds at the level of tens of millions, familiar with the operation of main funds, washing and absorbing funds, and lifting techniques. It can grasp the integration of knowledge and action in fund management, position control, investment portfolio, and investment mentality. It is good at judging and analyzing the trend of the overall market, proficient in various candlestick technical tactics, and has a deep understanding of wave theory, form theory, and index theory. Learn about technical market trends and exchange scans by following the public account above
免责声明:本文章仅代表作者个人观点,不代表本平台的立场和观点。本文章仅供信息分享,不构成对任何人的任何投资建议。用户与作者之间的任何争议,与本平台无关。如网页中刊载的文章或图片涉及侵权,请提供相关的权利证明和身份证明发送邮件到support@aicoin.com,本平台相关工作人员将会进行核查。


