Last weekend, the cryptocurrency market saw a change from the previous stagnant trend, with BTC continuing to decline. In the early hours of today, it reached a low of 57122 and is currently priced at 58500.
During the live broadcast on Saturday night, it was mentioned that the 4-hour consolidation support level at 58500 would be tested. At that time, the price of BTC was still around 62000, but within just one day, it was heavily impacted by the bears. Currently, the bearish momentum continues to strengthen, with no signs of exhaustion. The extent of this round of decline has far exceeded expectations, as the bulls did not put up much resistance before breaking through the 58500 level, completely suppressed by the bears. The chips that were bought on the left side of the 4-hour double bottom pattern have also been trapped. However, downturns often breed opportunities. The simplest way to judge whether it's a good time to buy is to observe whether the daily chart of BTC forms a bottom structure. Without a bottom structure, the downtrend will not end, as it is a basic condition for a reversal in trend.
At around 3 o'clock yesterday afternoon, a senior brother sent me a 4-hour chart and asked if the 4-hour bottom structure had been established. I replied that a breakthrough of 60800 on the 4-hour candlestick body was necessary for it to be established. However, the following two candlesticks failed to hold above 60800, and the price plummeted to a low of 57122. My previous prediction of a strong double bottom on the 4-hour chart was proven wrong, and the chips bought on the left side were deeply trapped. Upon reviewing the trend, it became clear that the purchase was based only on a 30-minute buying point, and the daily chart of BTC did not form a bottom structure. The outlook was overly optimistic, and the operation was too aggressive.
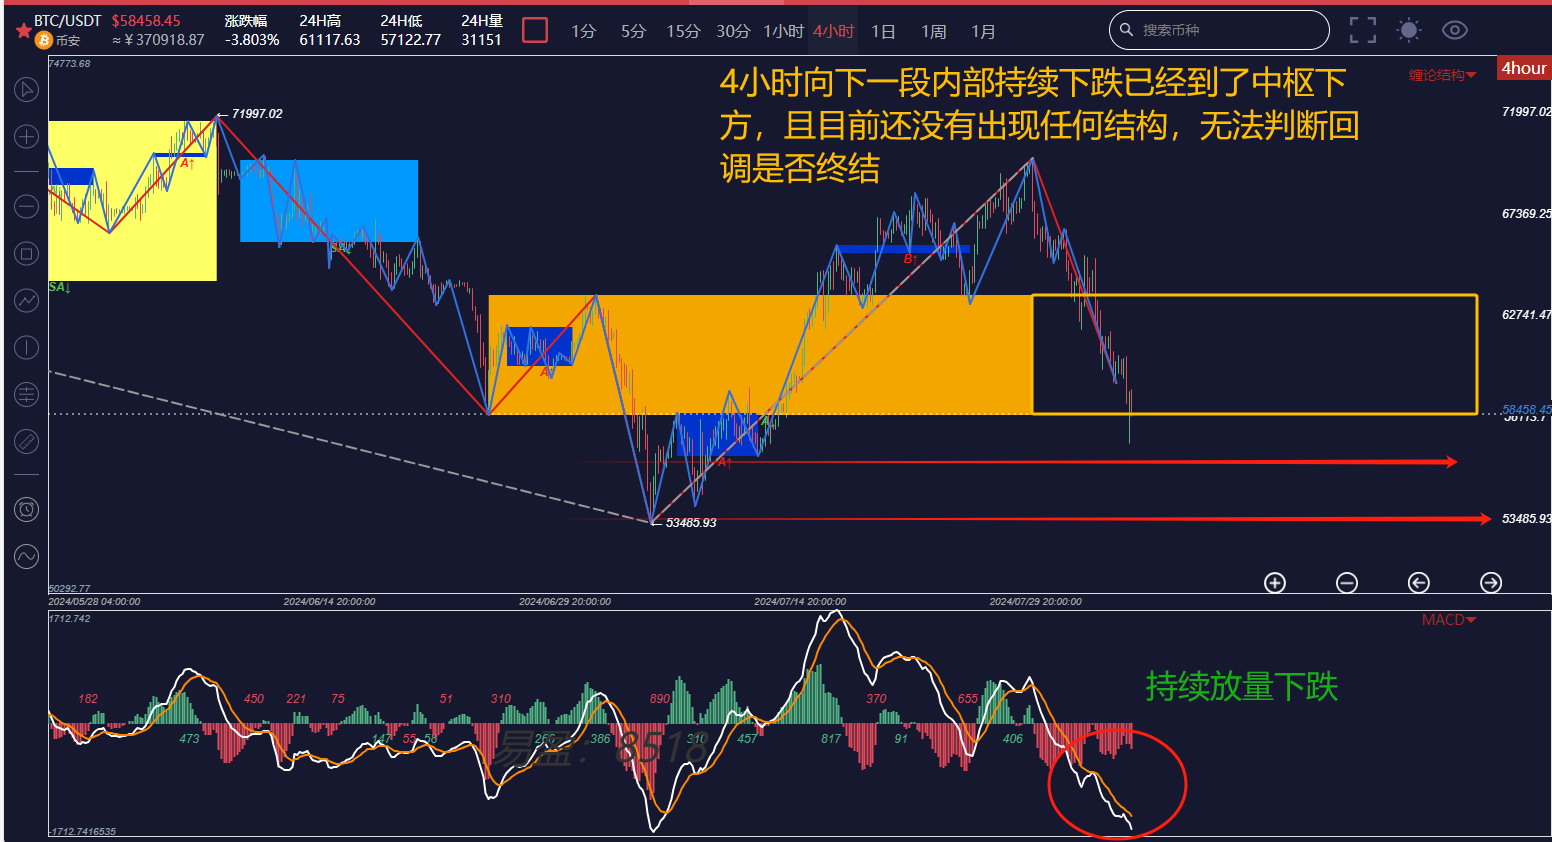
Looking directly at the 4-hour chart, the current downward trend from the high of 70000 is characterized by a continuous increase in volume, directly breaking through the 4-hour consolidation support level with no internal structure. Currently, it is testing the support at the lower edge of the consolidation at 58500. If the support does not hold, it will drop to the two red lines in the chart.
The above analysis is for reference only and does not constitute any investment advice!
If you are interested in the "缠论" (Chan's Theory) and want to obtain learning materials for free, watch public live broadcasts, participate in offline training camps, improve your trading skills with "缠论," and build your own trading system to achieve stable profitability, use "缠论" technology to timely exit at the top and buy at the bottom, you can scan the code to follow the public account below to privately message and add the WeChat account!

免责声明:本文章仅代表作者个人观点,不代表本平台的立场和观点。本文章仅供信息分享,不构成对任何人的任何投资建议。用户与作者之间的任何争议,与本平台无关。如网页中刊载的文章或图片涉及侵权,请提供相关的权利证明和身份证明发送邮件到support@aicoin.com,本平台相关工作人员将会进行核查。


