特朗普's assassination pushed Bitcoin to a big rise

The increased probability of Trump's victory has favored risk assets such as Bitcoin. Especially, the mention of ending the crackdown on cryptocurrencies by Trump after taking office in the latest Republican campaign platform has greatly boosted confidence in the cryptocurrency market.
"The Trump trade" is on fire.
After Trump was attacked over the weekend, a series of Trump-related assets such as U.S. bond yields and Bitcoin surged, thanks to his survival from the assassination attempt, which has skyrocketed the support rate for Trump among the American people.
Bitcoin has risen for six consecutive days, with a total increase of 11.59% this week, reaching a high of $66,000.
There are about 11 days left until the next Federal Reserve interest rate meeting (2024.08.01)
https://hk.investing.com/economic-calendar/interest-rate-decision-168
Market Technical and Sentiment Analysis

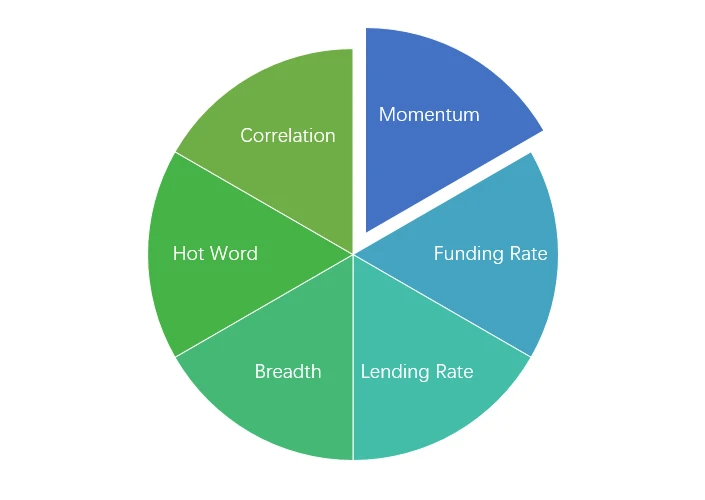
Emotion Analysis Composition
Technical Indicators
Price Trend
BTC prices rose by 11.59% in the past week, and ETH prices rose by 10.55%.
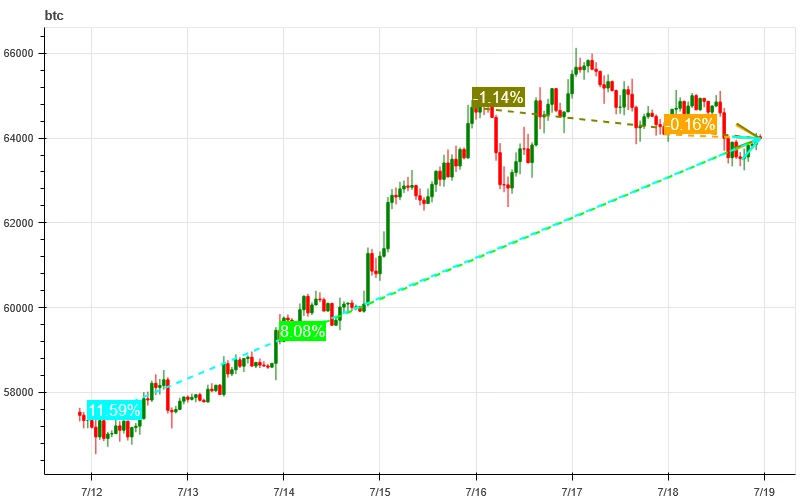
The above chart shows the price trend of BTC in the past week
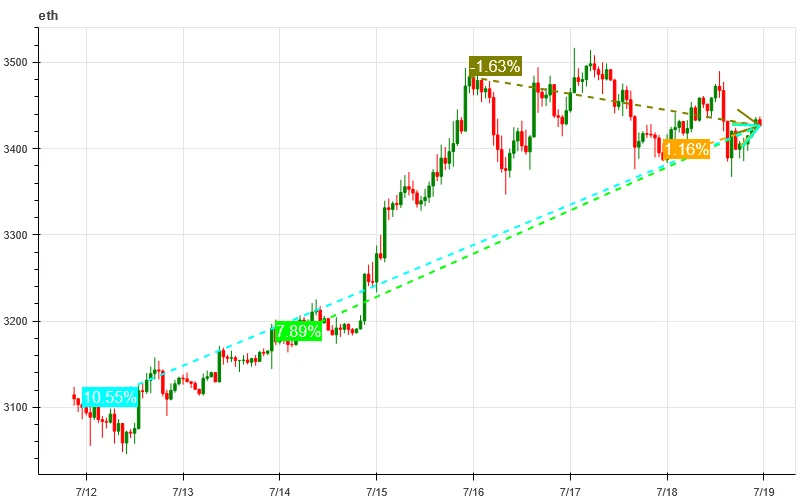
The above chart shows the price trend of ETH in the past week
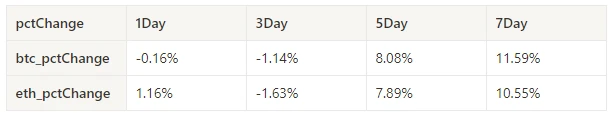
The table shows the price change rate over the past week
Price-Volume Distribution Chart (Support and Resistance)
BTC and ETH formed new dense trading areas with high volume as they rose to new highs in the past week.
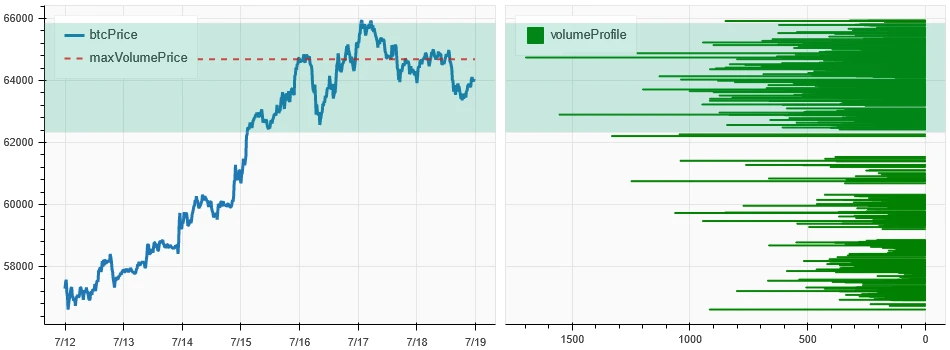
The above chart shows the distribution of dense trading areas for BTC in the past week
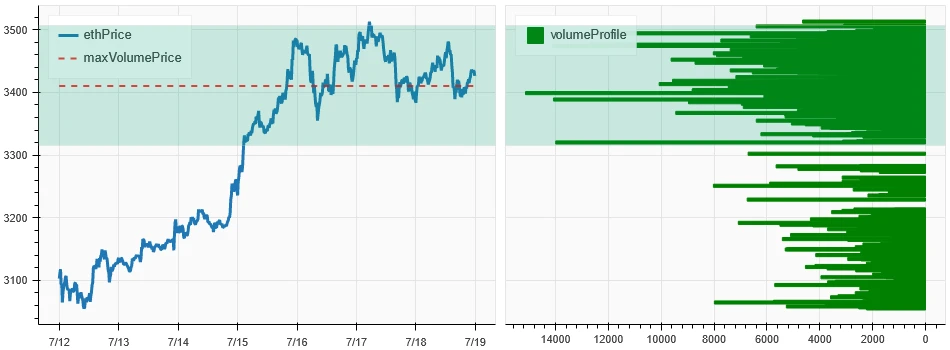
The above chart shows the distribution of dense trading areas for ETH in the past week
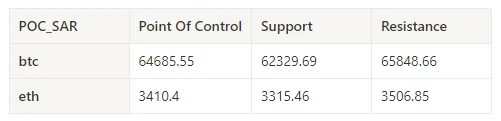
The table shows the dense trading ranges for BTC and ETH in each week of the past week
Volume and Open Interest
BTC and ETH had the largest trading volume on July 15th to 16th when they rose; open interest for both BTC and ETH saw a slight decrease.
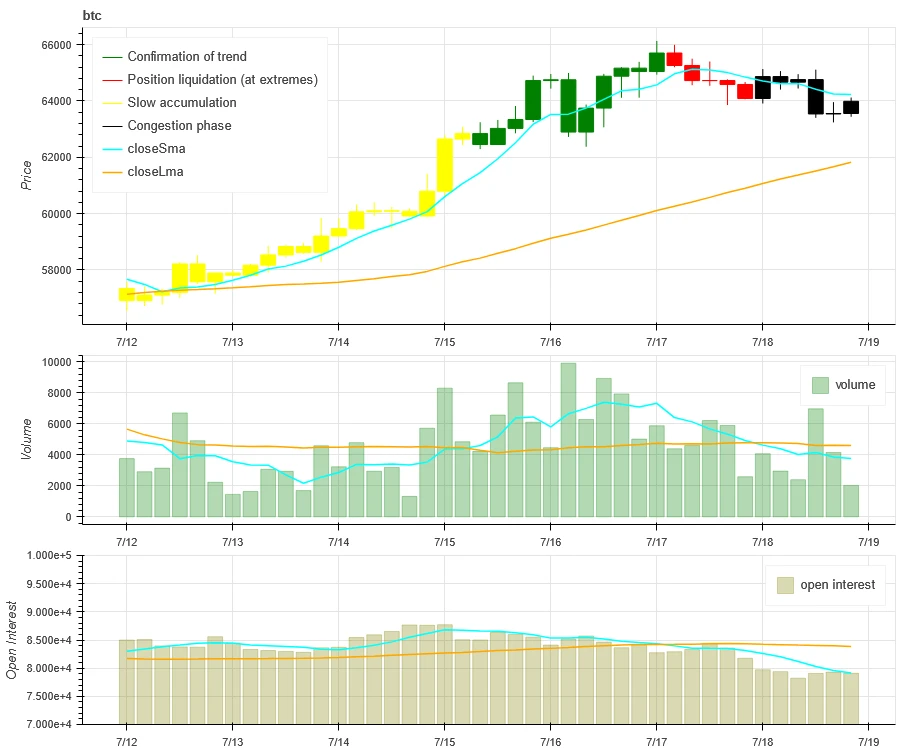
The top of the above chart shows the price trend of BTC, the middle shows the trading volume, and the bottom shows the open interest. The light blue line represents the 1-day average, and the orange line represents the 7-day average. The color of the candlestick represents the current state: green indicates price increase with volume support, red indicates closing positions, yellow indicates slow accumulation of positions, and black indicates crowded conditions.
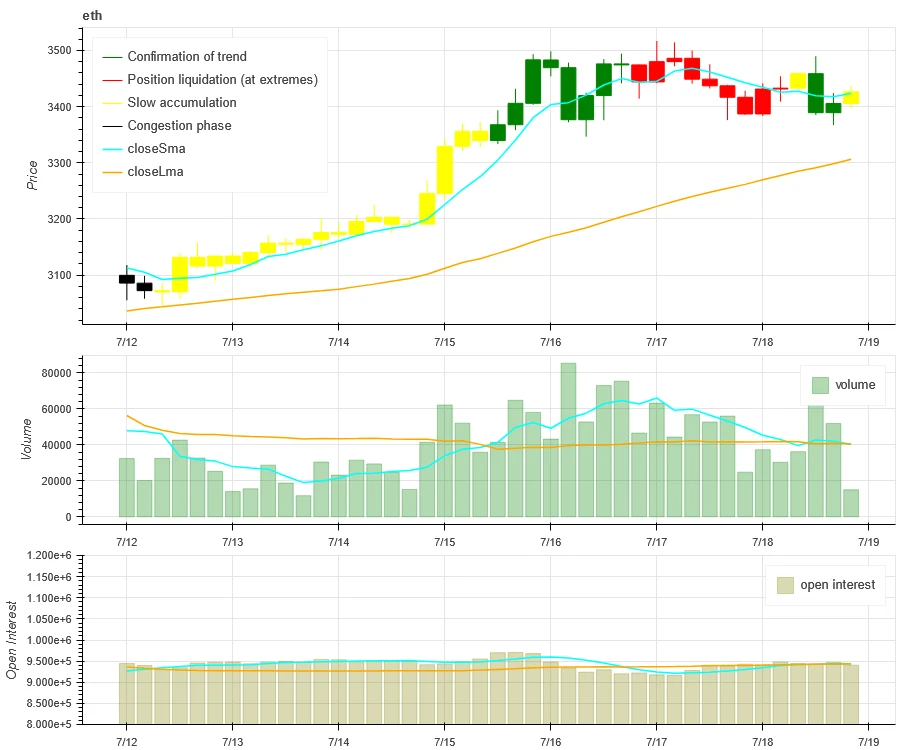
The top of the above chart shows the price trend of ETH, the middle shows the trading volume, and the bottom shows the open interest. The light blue line represents the 1-day average, and the orange line represents the 7-day average. The color of the candlestick represents the current state: green indicates price increase with volume support, red indicates closing positions, yellow indicates slow accumulation of positions, and black indicates crowded conditions.
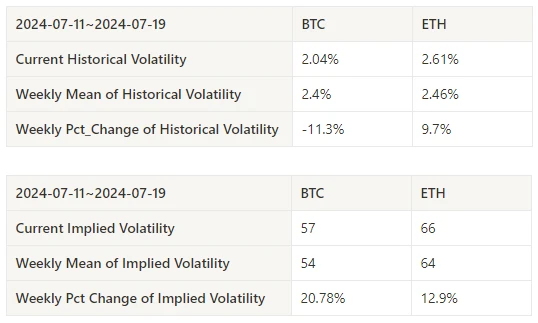
Historical Volatility and Implied Volatility
The historical volatility of BTC and ETH was highest when they rose on July 16th; the implied volatility of BTC and ETH rose simultaneously.
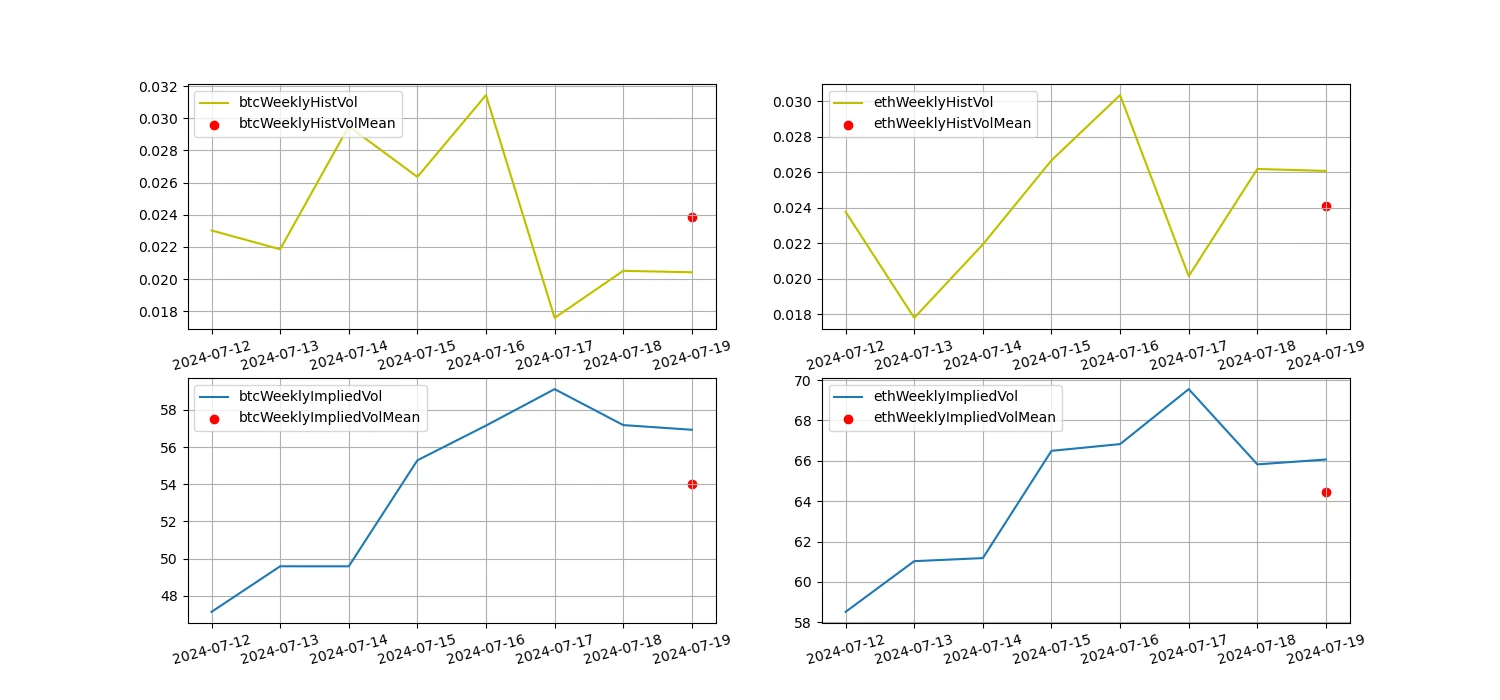
The yellow line represents historical volatility, the blue line represents implied volatility, and the red dots are their 7-day averages
Event-Driven
No major data was released in the past week.
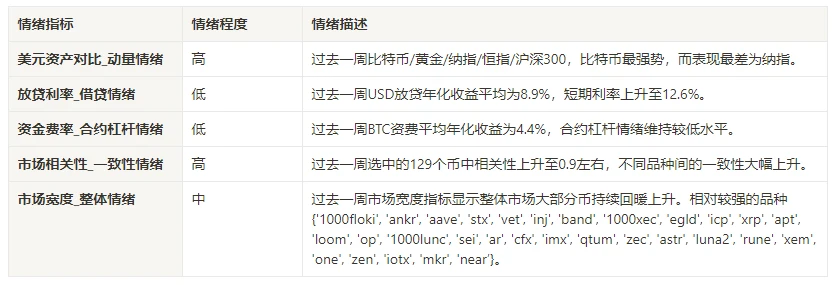
Sentiment Indicators
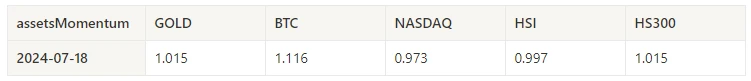
Momentum Sentiment
In the past week, among Bitcoin/Gold/Nasdaq/Hang Seng/Shanghai 300, Bitcoin was the strongest, while Nasdaq performed the worst.
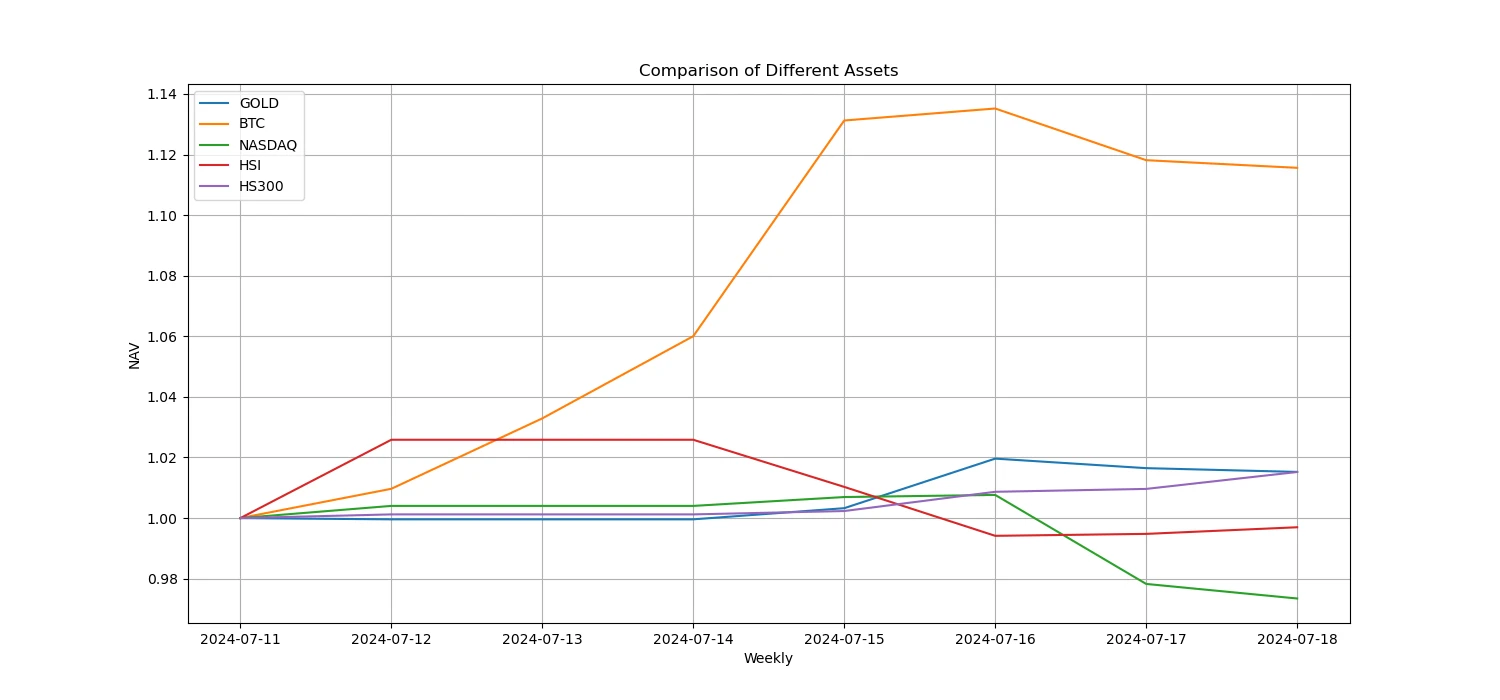
The above chart shows the trends of different assets in the past week.
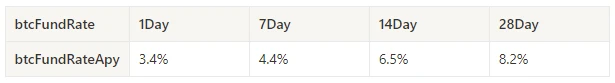
Lending Rate_Lending Sentiment
The average annualized USD lending yield in the past week was 8.9%, and the short-term interest rate rose to 12.6%.
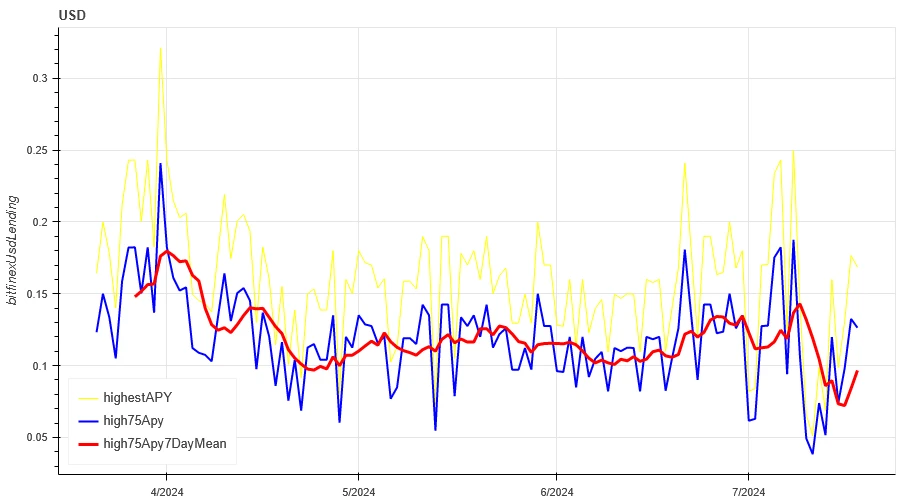
The yellow line represents the highest price of USD interest rates, the blue line represents 75% of the highest price, and the red line represents the 7-day average of 75% of the highest price.
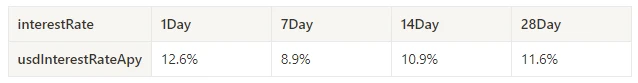
The table shows the average returns of USD interest rates for different holding periods in the past.
Funding Rate_Contract Leverage Sentiment
The average annualized return of BTC funding rate in the past week was 4.4%, and the contract leverage sentiment remained at a relatively low level.
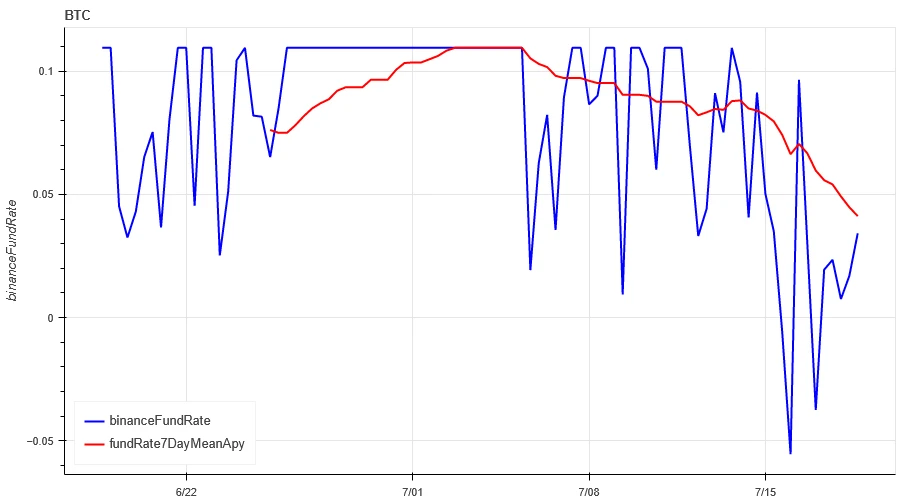
The blue line represents the funding rate of BTC on Binance, and the red line represents its 7-day average.
The table shows the average returns of BTC funding rates for different holding periods in the past.
Market Correlation_Consistency Sentiment
Among the selected 129 coins in the past week, the correlation remained around 0.9, and the consistency between different varieties increased significantly.
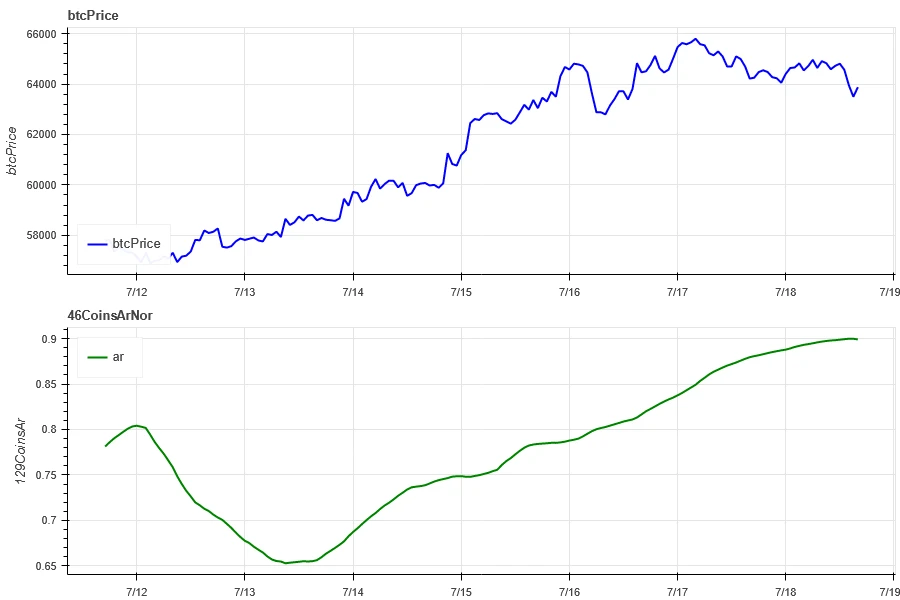
The blue line represents the price of Bitcoin, and the green line represents the overall correlation between ['1000floki', '1000lunc', '1000pepe', '1000shib', '1000xec', '1inch', 'aave', 'ada', 'agix', 'algo', 'ankr', 'ant', 'ape', 'apt', 'arb', 'ar', 'astr', 'atom', 'audio', 'avax', 'axs', 'bal', 'band', 'bat', 'bch', 'bigtime', 'blur', 'bnb', 'btc', 'celo', 'cfx', 'chz', 'ckb', 'comp', 'crv', 'cvx', 'cyber', 'dash', 'doge', 'dot', 'dydx', 'egld', 'enj', 'ens', 'eos','etc', 'eth', 'fet', 'fil', 'flow', 'ftm', 'fxs', 'gala', 'gmt', 'gmx', 'grt', 'hbar', 'hot', 'icp', 'icx', 'imx', 'inj', 'iost', 'iotx', 'jasmy', 'kava', 'klay', 'ksm', 'ldo', 'link', 'loom', 'lpt', 'lqty', 'lrc', 'ltc', 'luna2', 'magic', 'mana', 'matic', 'meme', 'mina', 'mkr', 'near', 'neo', 'ocean', 'one', 'ont', 'op', 'pendle', 'qnt', 'qtum', 'rndr', 'rose', 'rune', 'rvn', 'sand', 'sei', 'sfp', 'skl', 'snx', 'sol', 'ssv', 'stg', 'storj', 'stx', 'sui', 'sushi', 'sxp', 'theta', 'tia', 'trx', 't', 'uma', 'uni', 'vet', 'waves', 'wld', 'woo', 'xem', 'xlm', 'xmr', 'xrp', 'xtz', 'yfi', 'zec', 'zen', 'zil', 'zrx’].
Market Breadth_Overall Sentiment
Among the selected 129 coins in the past week, 78% were above the 30-day moving average, compared to 37% for BTC. 33% were more than 20% above the lowest price in the past 30 days, and 67.7% were less than 10% below the highest price in the past 30 days. The market breadth indicator in the past week shows that most coins in the overall market have rebounded and risen.
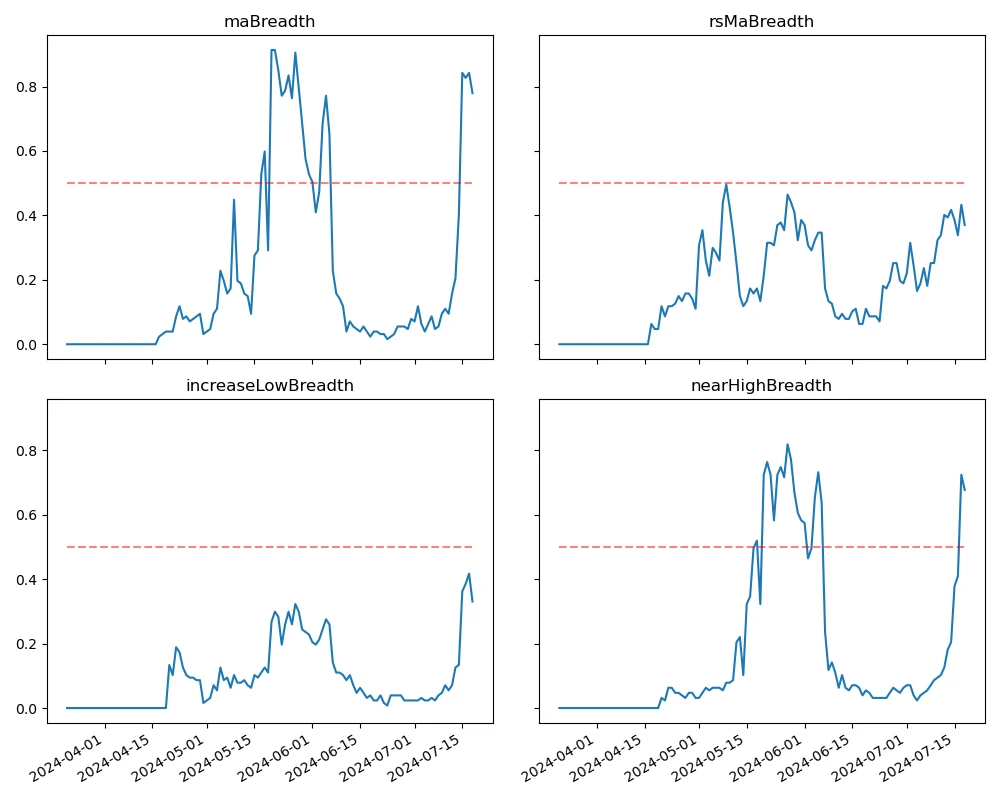
The chart above shows the 30-day width index distribution of the following assets: ['bnb', 'btc', 'sol', 'eth', '1000floki', '1000lunc', '1000pepe', '1000sats', '1000shib', '1000xec', '1inch', 'aave', 'ada', 'agix', 'ai', 'algo', 'alt', 'ankr', 'ape', 'apt', 'arb', 'ar', 'astr', 'atom', 'avax', 'axs', 'bal', 'band', 'bat', 'bch', 'bigtime', 'blur', 'cake', 'celo', 'cfx', 'chz', 'ckb', 'comp', 'crv', 'cvx', 'cyber', 'dash', 'doge', 'dot', 'dydx', 'egld', 'enj', 'ens', 'eos','etc', 'fet', 'fil', 'flow', 'ftm', 'fxs', 'gala', 'gmt', 'gmx', 'grt', 'hbar', 'hot', 'icp', 'icx', 'idu', 'imx', 'inj', 'iost', 'iotx', 'jasmy', 'jto', 'jup', 'kava', 'klay', 'ksm', 'ldo', 'link', 'loom', 'lpt', 'lqty', 'lrc', 'ltc', 'luna2', 'magic', 'mana', 'manta', 'mask', 'matic', 'meme', 'mina', 'mkr', 'near', 'neo', 'nfp', 'ocean', 'one', 'ont', 'op', 'ordi', 'pendle', 'pyth', 'qnt', 'qtum', 'rndr', 'robin', 'rose', 'rune', 'rvn', 'sand', 'sei', 'sfp', 'skl', 'snx', 'ssv', 'stg', 'storj', 'stx', 'sui', 'sushi', 'sxp', 'theta', 'tia', 'trx', 't', 'uma', 'uni', 'vet', 'waves', 'wif', 'wld', 'woo','xai', 'xem', 'xlm', 'xmr', 'xrp', 'xtz', 'yfi', 'zec', 'zen', 'zil', 'zrx' ].
Summary
In the past week, the prices of Bitcoin (BTC) and Ethereum (ETH) have risen for six consecutive days, and the volatility and trading volume of these two cryptocurrencies reached their highest levels on July 16th when they rose. The open interest of Bitcoin and Ethereum futures contracts has been decreasing. In addition, the implied volatility of Bitcoin and Ethereum has also increased simultaneously. The funding rate of Bitcoin has remained at a low level, which may reflect the continued low leverage sentiment of market participants towards Bitcoin. The market breadth indicator shows that most cryptocurrencies have rebounded, indicating a low-level recovery trend in the entire market over the past week.
Twitter: @https://x.com/CTA_ChannelCmt
Website: channelcmt.com
免责声明:本文章仅代表作者个人观点,不代表本平台的立场和观点。本文章仅供信息分享,不构成对任何人的任何投资建议。用户与作者之间的任何争议,与本平台无关。如网页中刊载的文章或图片涉及侵权,请提供相关的权利证明和身份证明发送邮件到support@aicoin.com,本平台相关工作人员将会进行核查。


