June 28th Air Felling: Bitcoin is bullish above 61300, gradually strengthening or welcoming unilateral
The growth of speculative capital flowing with the trend has strengthened the trend and can provide rich returns for the bias of following the trend, and speculative interests have attracted new capital inflows. When speculative capital inflows cannot compensate for the rising interest to be paid, the trend will reverse.
BTC/Daily Chart
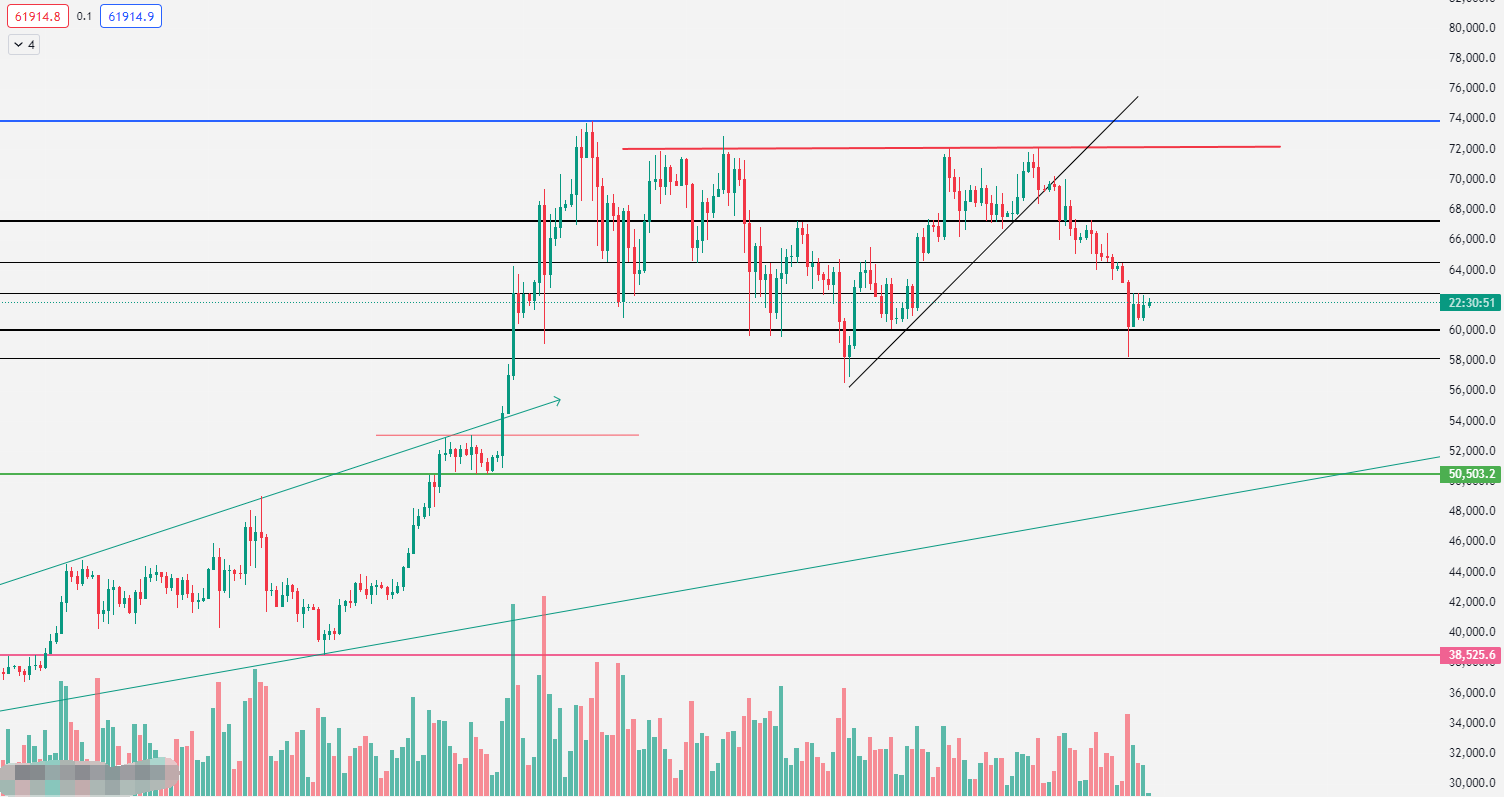
Regarding Bitcoin, the price started to oscillate upwards near 60600 on Wednesday, ushering in a strong counterattack overall, eventually reaching near 62400. Whether it is the continuation of bearish weakness or the bearishness after the oscillation, it has failed. As mentioned in the previous air felling, the trend is still downward. However, due to the launch of the ETH spot ETF, it can prevent the decline. So why did the coin price continue to rise overnight? It can only be said that institutions deliberately did so, currently confusing the retail market. Therefore, the continuation of this weak correction is the key focus for consideration. The author believes that this bull wave is far from over. Today's key resistance is around 63500, and the short-term support below is 61300, which is also the first consideration for rebound stabilization and bullishness.
BTC/4h Chart
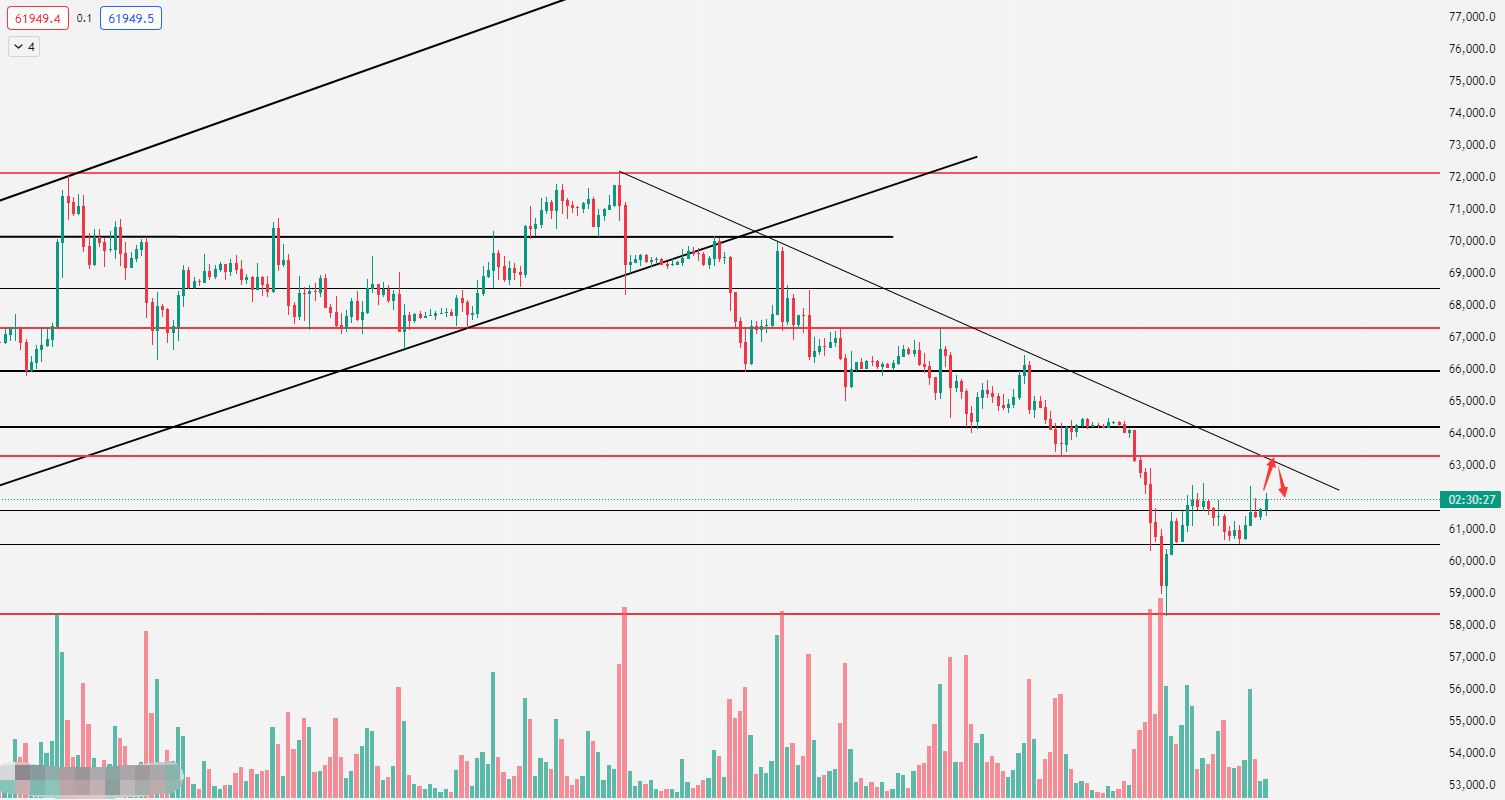
On the 4-hour level of Bitcoin, from the chart, it can be seen that there was a rebound yesterday, and the resistance near 62400 started to pressure downwards. Currently, the price is running near 61500. There is indeed a continuation of the downward trend on the 4-hour level, but if the price does not break the short-term support at 61300, I am more inclined to see an upward trend. If today can stabilize at 62000, the rise to 63500~64000 should not be a problem.
BTC/1H Chart
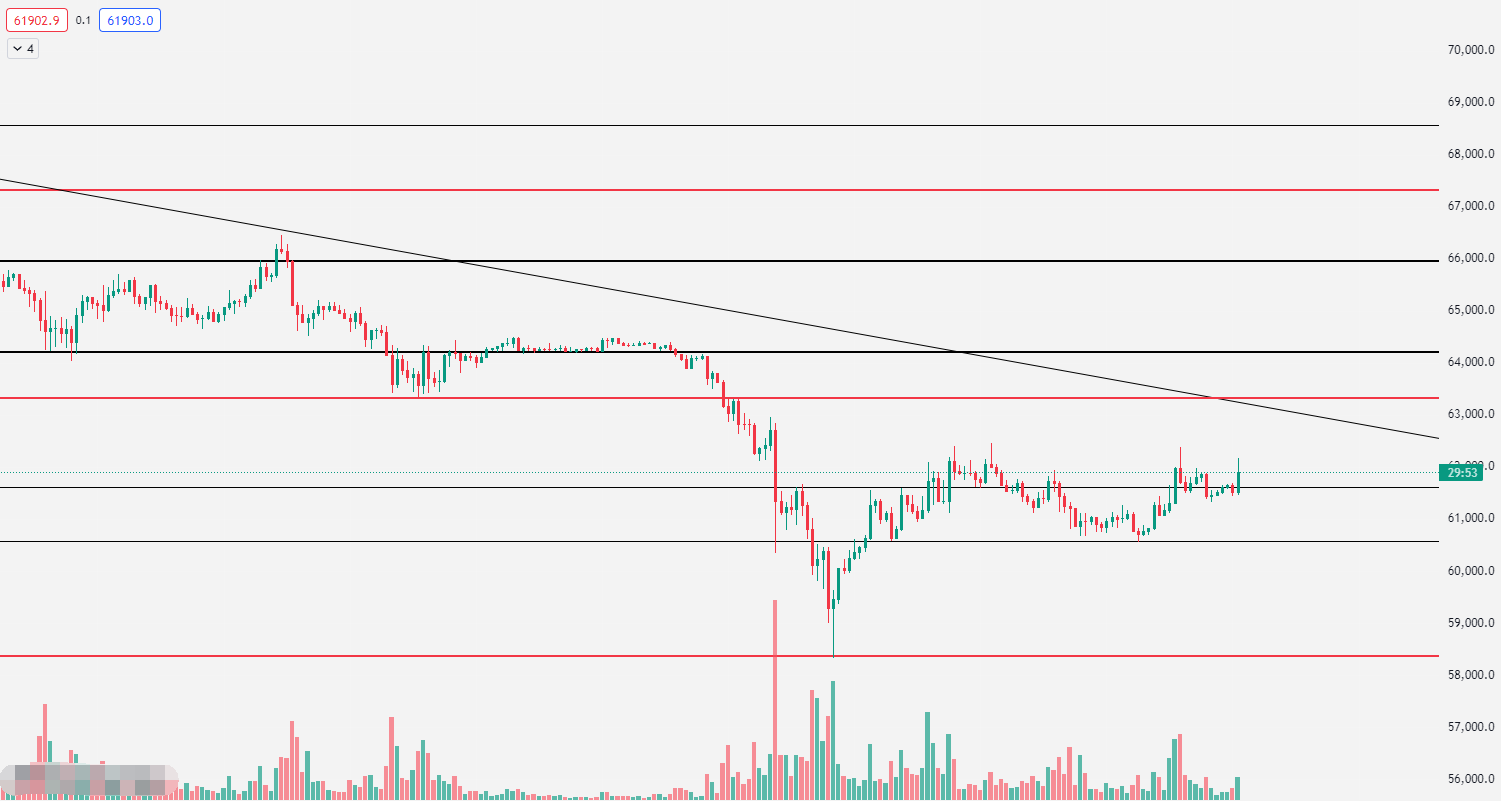
On the 1-hour level of Bitcoin, the current short-term support is at 61300, temporarily making it the watershed between long and short positions. If it cannot break below, it indicates that the decline is very weak, and this kind of movement needs to be observed for a rebound. The short-term resistance above is around 62500. If it can be maintained above 61300 during the day, then look for a rebound or continue yesterday's trend.
Strategy 1: Long in batches from 61600 to 61300, stop loss at 60800, target around 63500~64000
The above is personal advice, for reference only. Investment involves risks, and trading should be cautious.
There may be delays in posting, and the market is ever-changing. The mentioned points in the article do not serve as a basis for following orders. For more information on the market and resolving orders, refer to the real-time strategy of air felling
Scan the QR code below to follow the official account: Band Air Felling
Comprehensive guidance time: 7:00 am to 2:00 am the next day
This article is original by Band Air Felling, with over ten years of investment experience, having handled funds at the tens of millions level, familiar with the operation of main funds, washing and absorbing chips, and boosting methods. It can grasp the integration of knowledge and action in fund management, position control, investment portfolio, and investment mentality. Proficient in judging and analyzing the overall market trend, and well-versed in various candlestick technical tactics, with deep insights into wave theory, form theory, and indicator theory. Scan and follow the official account above to learn about technical market trends and exchange
免责声明:本文章仅代表作者个人观点,不代表本平台的立场和观点。本文章仅供信息分享,不构成对任何人的任何投资建议。用户与作者之间的任何争议,与本平台无关。如网页中刊载的文章或图片涉及侵权,请提供相关的权利证明和身份证明发送邮件到support@aicoin.com,本平台相关工作人员将会进行核查。


